Expert Analysis: MOAT
The stock market of the biggest economy in the world has both inspired Australian investors in allocating their wealth to household names such as Google, Microsoft and Kellogg but also diversified their portfolios to the economic and sector opportunities underrepresented in Australia. Here we provide some insightful analysis for our popular US equity Morningstar Wide Moat ETF (MOAT) versus the US market capitalisation S&P 500 Index.
The stock market of the biggest economy in the world has both inspired Australian investors in allocating their wealth to household names such as Google, Microsoft and Kellogg but also diversified their portfolios to the economic and sector opportunities underrepresented in Australia. Here we provide some insightful analysis for our popular US equity Morningstar Wide Moat ETF (MOAT) versus the US market capitalisation S&P 500 Index.
Many market indices are an accident of history. They were not initially designed for investment purposes, rather they were created to provide an update, or a health check of the market.
When Charles Dow first published the Dow Jones Industrial Average (The Dow Jones) in 1896, he allocated weightings to the top 12 stocks of the day based on their prices.
The Dow Jones is still widely quoted today. Let’s take a look at how it is constructed. It is a price-weighted index, which means that the stocks with the highest price have the largest weighting. Currently, UnitedHealth Group, which has a price of US$486 per share, has the highest weighting in the portfolio. Let’s contrast that with Apple. Apple is a company that is five times larger than UnitedHealth, yet it only makes up 3.2% of the Dow Jones compared to the 9.2% of UnitedHealth.
The Dow Jones provides a general barometer of US equity performance, but does not make any sense from an investment perspective because a share price could be a function of having less (or more) shares on issue.
As a result, the next index innovation was ‘market capitalisation’, which was pioneered by Henry Varnum Poor and the Standard Statistics Co. The result was the 1926 predecessor of the United States’ S&P 500. A market capitalisation index uses the size of a company for inclusion. Therefore, in a market capitalisation index, the larger companies have bigger weights. In the S&P 500, Apple makes up around 7.0%, UnitedHealth around 1.2%. Market capitalisation indices were considered better barometers of the market. Again though, the intention of the index is to be a market barometer, not a tool for investment.
Market capitalisation indices have become the source of market performance reported in the media all over the world. In Australia, for example, the S&P/ASX 200 contains the 200 largest companies in Australia by market capitalisation.
Many funds follow market capitalisation indices. Therefore, funds that track market capitalisation indices allocate more to bigger companies than smaller companies. So when the market overvalues a stock, a fund tracking that index buys too much of the overpriced stock. Conversely when the market undervalues a stock, the fund sells too much of the under-priced stock.
Innovative indices beyond market capitalisation
Innovations in index design for passive funds have delivered above market benchmark returns over the long term while retaining low costs. It is this approach that VanEck offers that is being used by savvy investors as a way to invest in US equities. VanEck has collaborated with Morningstar to bring a unique approach to Australian investors.
Morningstar has turned a well-known investment philosophy and approach into an actionable investment strategy. This philosophy is based on the concept of economic ‘moats’ that was popularised by Warren Buffett. Buffett is quoted as saying, "In business, I look for economic castles protected by unbreachable 'moats'."
Morningstar assigns each company it analyses an Economic Moat Rating of ‘wide’, ‘narrow’ or ’none’. Companies assigned a wide moat rating are those in which Morningstar has very high confidence that excess returns will remain for 10 years, with excess returns more likely than not to remain for at least 20 years. Companies with a narrow moat rating are those Morningstar believes are more likely than not to achieve normalised excess returns for at least the next 10 years. A firm with either no sustainable competitive advantage or one that Morningstar thinks will quickly dissipate is assigned a moat rating of ‘none’.
Our US equity ETF (MOAT) tracks the Morningstar® Wide Moat Focus Index™ (MOAT Index) that is a rules-based, equal-weighted index intended to offer exposure to attractively priced companies with sustainable competitive advantages according to Morningstar’s equity research team.
So let’s walk through the difference between the MOAT and the market capitalisation index for US equities, the S&P 500 Index
MOAT vs S&P 500 Index – FundamentalsTable 1: Statistics and fundamentals
|
|
MOAT |
S&P 500 |
|
Index strategy |
Smart beta |
Market capitalisation weight |
|
Number of holdings |
47 |
500 |
|
12mth trailing Dividend Yield |
1.87% |
1.44% |
|
Dividend frequency |
Annually |
- |
|
Return on equity (ROE) (%) |
24.55 |
27.23 |
|
Financial leverage (debt to equity) (x) |
1.2 |
1.3 |
|
Price to earnings (x) |
20.0 |
20.5 |
|
Price to book (x) |
3.73 |
3.98 |
|
Price to Sales (x) |
2.79 |
2.78 |
As you would expect, MOAT has lower debt to equity and is more attractive on a price to earnings and price to book value perspective.
MOAT vs S&P500 Index - Performance
Moat investing has served Australian investors well. Since its inception, MOAT has outperformed the S&P 500 Index – testament to MOAT’s value and quality approach.
Chart 1: Cumulative performance since MOAT ASX listing date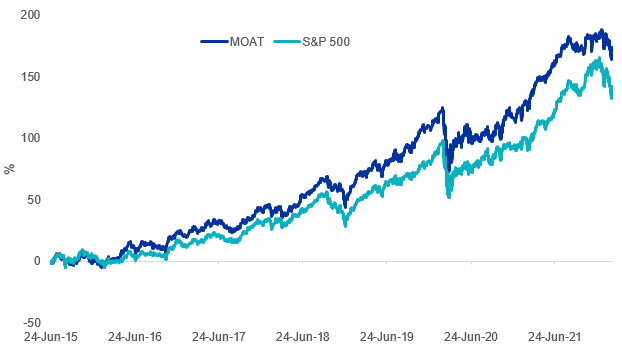
|
YTD (%) |
1 yr (%) |
3 yrs (% p.a.) |
5 yrs (% p.a.) |
Since Inception (% p.a.) |
|
|
MOAT |
-3.24 |
21.10 |
16.86 |
17.03 |
16.25 |
|
S&P 500 Index |
-7.90 |
23.65 |
16.87 |
15.88 |
14.02 |
|
Outperformance |
+4.66 |
-2.55 |
-0.01 |
+1.15 |
+2.23 |
Chart 1 and Table 2 source: Morningstar Direct, VanEck as at 28 February 2022. The chart and table above show past performance of MOAT and of the S&P500 Index. You cannot invest directly in an index. Results are calculated to the last business day of the month and assume immediate reinvestment of distributions. MOAT results are net of management fees and other costs incurred in the fund, but before brokerage fees and bid/ask spreads incurred when investors buy/sell on the ASX. Returns for periods longer than one year are annualised. Past performance is not a reliable indicator of future performance. The S&P 500 is shown for comparison purposes as it is the widely recognised benchmark used to measure the performance of the broad US equities market. It includes the 500 largest US listed companies, weighted by market capitalisation. MOAT’s index measures the performance of 40 to 80 US companies with a Morningstar Economic Moat Rating™ of “Wide”. MOAT’s index has fewer securities and different industry allocations than the S&P 500. Click here for more details.
MOAT vs S&P 500 Index - Top 10 holdings
It has been well documented that the top 10 of the S&P 500 Index have been the drivers of much of the growth of that index. This has led to some unintended concentration within that index, as well as valuation concerns.
Below you can see the top 10 companies. Despite having a tenth of the number of holdings, MOAT’s top 10 make up less than the top 10 of a portfolio of 500 companies. This means that many of the small companies in the S&P 500 do not contribute much to portfolio performance – to see all the holdings in MOAT and their weightings click here.
Table 3: Top 10 holdings MOAT Table 4: S&P 500 Index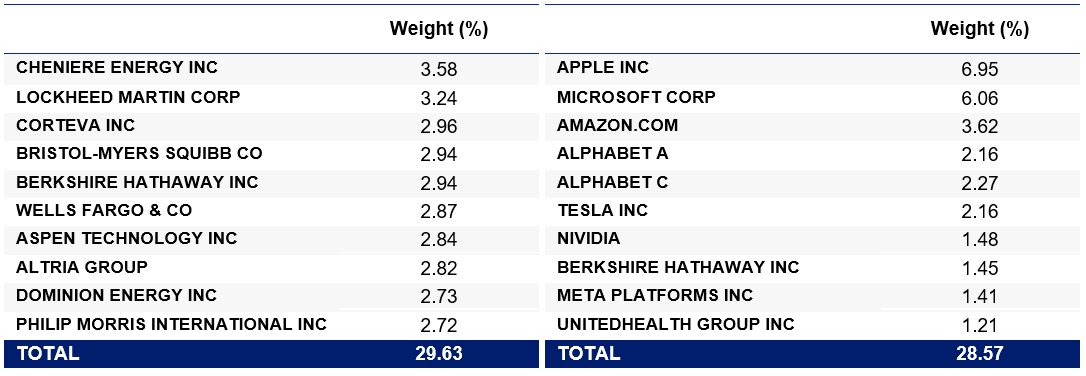
Table 3 & 4 source: VanEck, S&P FactSet, as at 28 February 2022
MOAT vs S&P 500 Index - Style
When looking at portfolios it is important to determine what style e.g. value or growth and what size bias a portfolio holds e.g. giant, large, mid or small. Below we can see MOAT’s. Importantly MOAT holds large companies with a core-value orientation relative to the S&P 500 index.
Chart 2: MOAT holdings based style map Chart 3: S&P 500 Index holdings based style map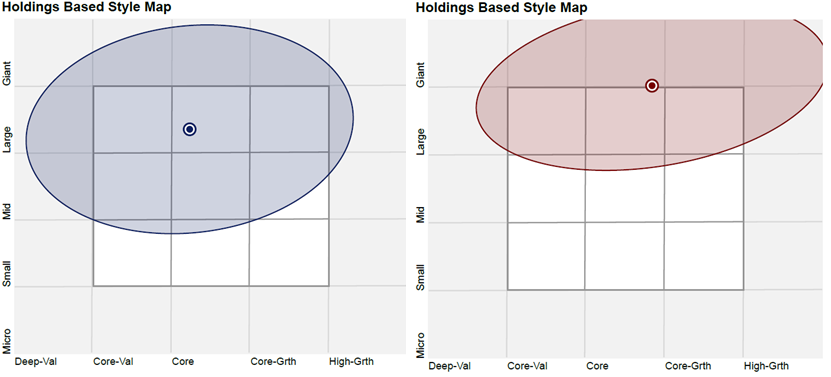
Chart 2 & 3 source: Morningstar Direct, as at 28 February 2022
While each US equity index has its merit for portfolio inclusion, you should assess all the risks and consider your investment objectives.
Past performance is no guarantee of future performance. The above is not a recommendation. Please speak to your financial adviser or stock broker.
For further information you can contact us via email or on +61 2 8038 3300.
Key risks
An investment in MOAT carries risks associated with: financial markets generally, individual company management, industry sectors, ASX trading time differences, foreign currency, country or sector concentration, political, regulatory and tax risks, fund operations and tracking an index. See the PDS for details.
Note - There is no suggestion that Warren Buffett endorses the Morningstar Wide Moat Focus Index or MOAT ETF


Published: 11 March 2022