Let’s talk about fees: Getting value in ETFs
While fees are important, they shouldn't be the only factor when assessing and comparing funds.
While fees are important, they shouldn't be the only factor when assessing and comparing funds.
In the consumer world, the price of goods is seen by consumers as a signal of quality, and while the most expensive is not always the best quality, the cheapest rarely is.
Investments like consumer goods can be assessed. Investors are able to consider performance and risks. Here we assess Australian equity options based on these two metrics to help investors determine if they are getting value for money in Australian equities.
There was a much-publicised fee war a year or so ago among Australian equities ETFs tracking indices that represent the performance of the largest 200 listed companies. A similar scenario played out in 2018. Low costs are seen as a win for investors, but investment outcomes are not the fees paid. Investment outcomes are important and while it is natural investors want to pay less, they also want to avoid unintended risks. So, let’s assess the options available to Australian equity investors on the metrics investors care about beyond fees, that is, performance and risks.
Performance
Noting that past performance should not be relied upon for future performance, it has become a popular sentiment that active managers have tended to underperform the market benchmark, despite the higher fees they charge. This sentiment deserves greater scrutiny because it overlooks two important aspects.
- Style - Each active manager has their style. Saying one strategy outperforms the other is a generalisation when you are comparing, say, a ‘value’ manager with a ‘growth’ manager. These managers are targeting a different outcome, so they should be assessed over the long term. Careful analysis can ensure that active managers are true to their label and, say the value manager, truly adhere to their philosophy and objectives.
- Smart beta – Another aspect overlooked when passive and active are discussed is the strategy that aims to combine the two approaches. Smart beta is a passive strategy, i.e. index tracking, which aims to achieve active outcomes, often by using quantitative and portfolio construction strategies that active managers utilise.
Much of the reason for the negative sentiment for active managers can be found in the S&P Indices versus Active (SPIVA) Australia scorecard, which is released by S&P Dow Jones Indices every six months. It has been well documented that the SPIVA scorecard makes for poor reading for active managers. The most recent1, reported active manager underperformance rates for Australian Equity General of 73.84%, 82.71% and 83.13% over the 5-, 10- and 15-year horizons.
We have long advocated that active managers should be assessed against indices in line with the manager’s style. For example, ‘value’ Australian equity managers should be compared against the Australian benchmark’s value index. If the fund manager can beat that index persistently, that is true skill and deserving of their premium fee.
Now let’s consider the second overlooked aspect in a passive versus active debate, smart beta. In this instance the VanEck Australian Equal Weight ETF (MVW) is a smart beta Australian equity ETF. We can see it has strong performance relative to the S&P/ASX 200 and its peer group of active managers.
In the chart below, each column represents the returns of all of the funds in Morningstar’s Open Ended Australian Equity Large Blend, Large Growth and Large Value Categories over past time period. The shading represents quartile performance. Those managers in the top quartile would achieve returns in the darkest shaded area. Bottom quartile performers achieve returns in the lightest shade. We’ve plotted the returns of MVW and the S&P/ASX 200 Index. You can see that MVW’s performance beats most active fund managers over all trailing time periods, being in the top quartile over one and seven years and since its inception. You can also see, consistent with the SPIVA scorecard, most Australian equity active funds, underperform the benchmark index, hence the rise of passive.
Chart 1: Australian equity smart beta: Performance of MVW relative to peer group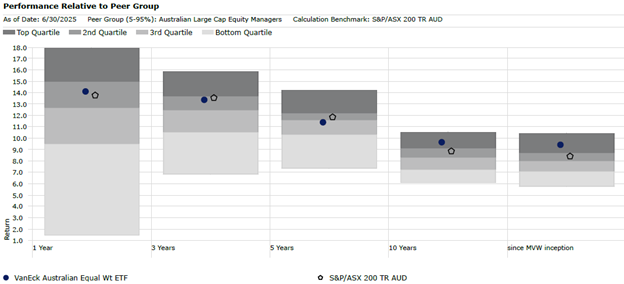
Source: Morningstar Direct, VanEck, as at 30 June 2023. MVW inception 4 March 2014. Results are calculated daily to the last business day of the month and assume immediate reinvestment of all dividends. MVW results are net of management fees and other costs incurred in the fund but do not include brokerage costs or buy/sell spreads incurred when investing in MVW. Past performance is not a reliable indicator of future performance. The Peer group of Australian Large Cap Equity Managers includes Morningstar’s Open Ended Australian Equity Large Blend Category, Morningstar’s Open Ended Australian Equity Large Growth Category and Morningstar’s Open Ended Australian Equity Large Value Category which are based on the defined universe funds that invest primarily in large Australian companies. Stocks in the top 70% of the Australian equities market based on market cap are defined as ‘large’.
MVW’s performance noted above has been achieved with a low management fee of 0.35% p.a. Typically, a third of the cost of the average Active Australian equity fund.
What this also means is that these active managers have to outperform MVW by at least the difference between their total fees (including performance fees) and MVW’s lower fees to just break even with MVW every year. Likewise, MVW starts between 0.31% to 0.22% behind the passive funds that track Australia’s 200 largest companies, but as you can see above it has achieved returns in excess of the benchmark index over one, three, seven years and since its inception.
Risk
It is a myth that tracking the benchmark index reduces risks. Three commonly cited risks that investors aim to limit, or reduce, are:
- Volatility of returns;
- The risk of losing money in a downturn; and
- Concentration risk.
Let’s consider each of these one by one.
Volatility of returns
It is likely that Australian equity investors accept the risk that the performance of their investment will go up and down. The dispersion between the ups and downs of returns is referred to as volatility and is usually measured by the standard deviation of the returns.
Australian equities for example are more volatile, i.e. has a higher standard deviation of returns, than the returns of a term-deposit. But over long-term, equity investors would hope to be rewarded for this higher risk with higher long-term returns.
In addition to standard deviation, investment professionals go one step further. The Sharpe ratio combines the standard deviation measure with the performance to quantify the relationship between the risk and the returns2. It provides a measure of risk-adjusted performance. As can be seen in Chart 2, MVW, generally has had a higher Sharpe ratio than the S&P/ASX 200. This means MVW has had a better risk/return trade-off.
Chart 2: Sharpe ratio: MVW and S&P/ASX 200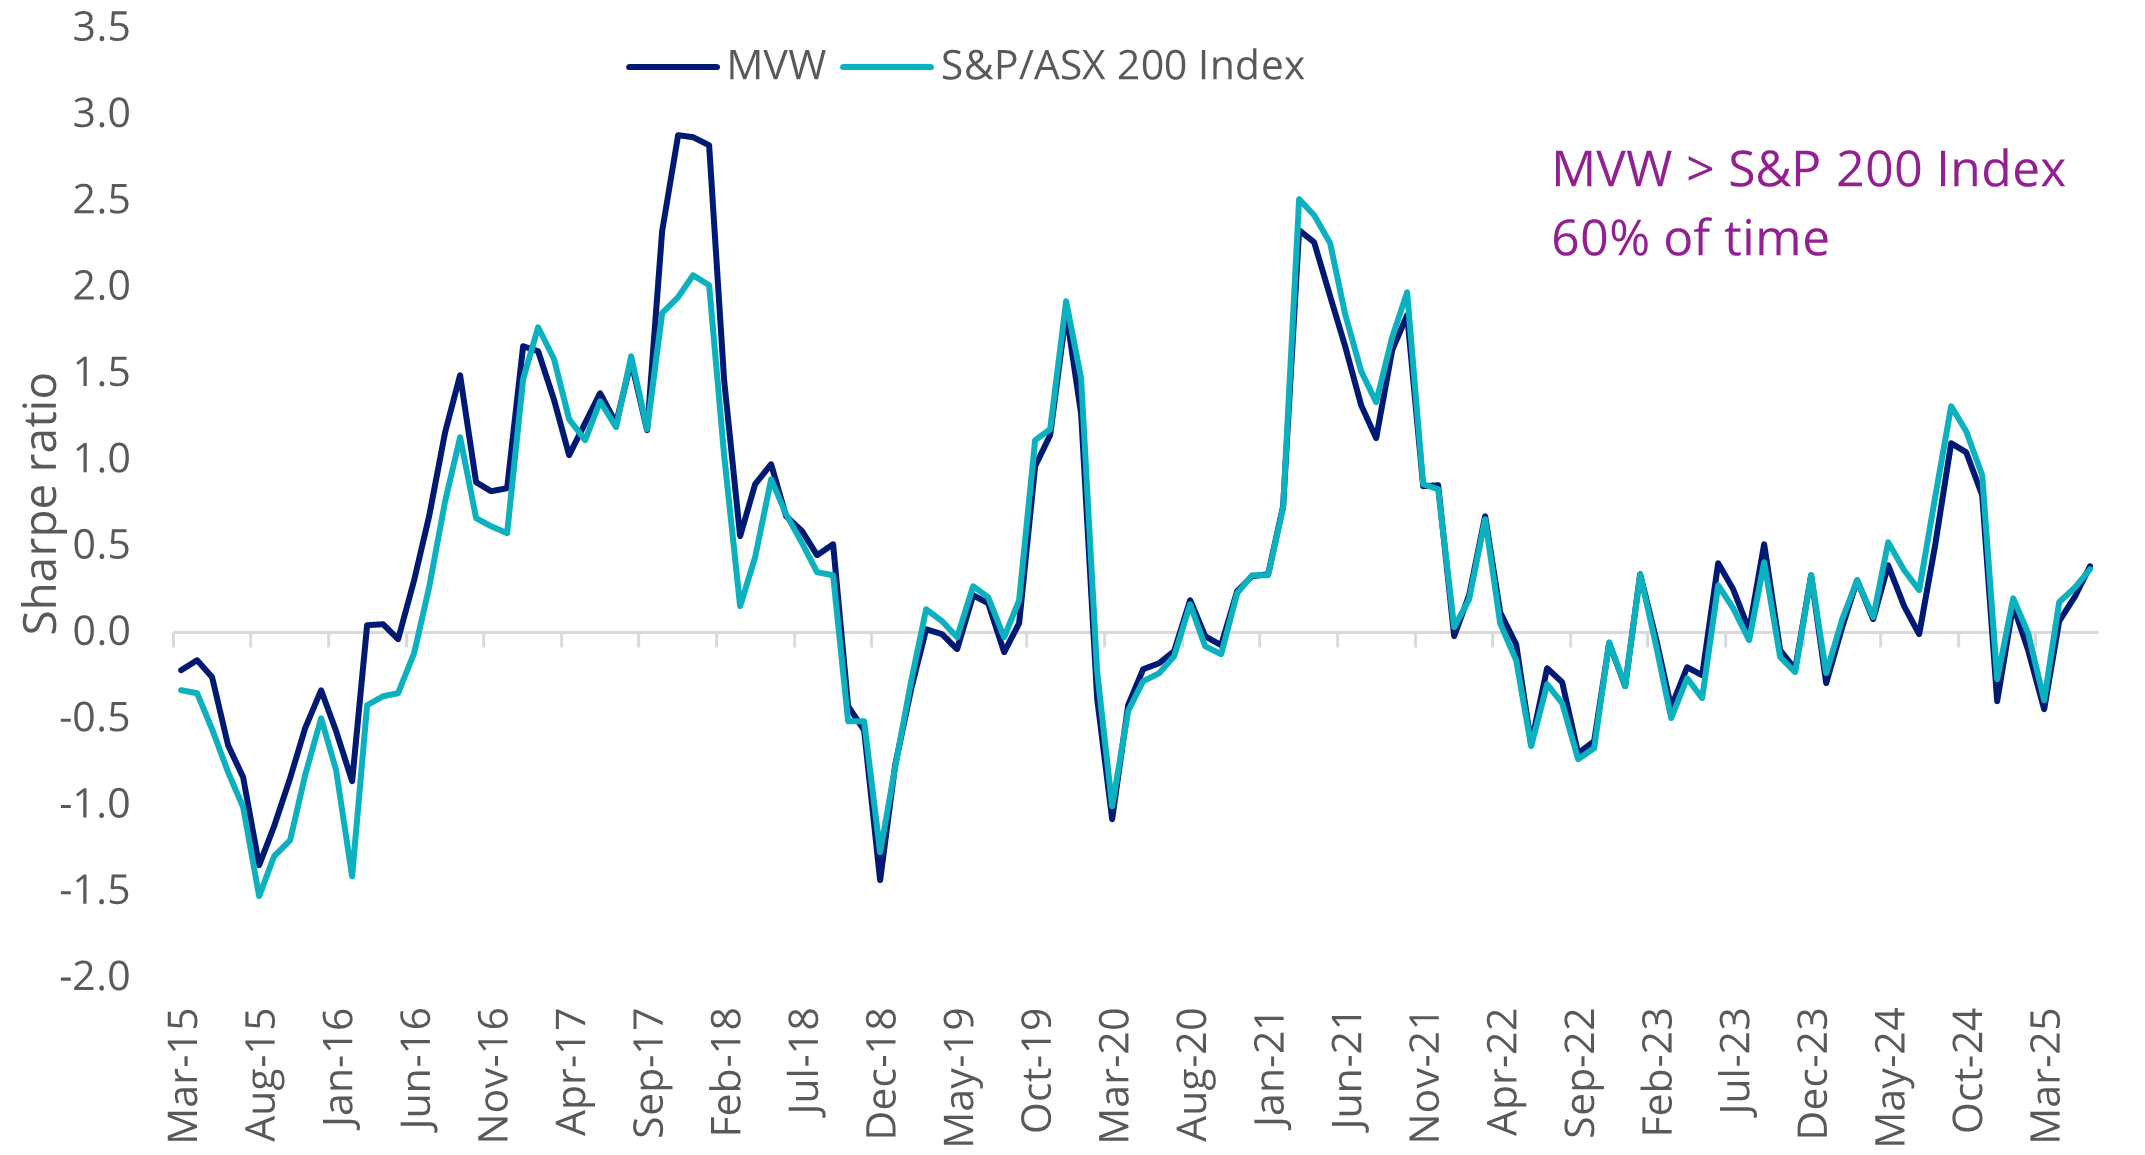
Source: Morningstar Direct, as at 30 June 2025. Results are calculated daily to the last business day of the month and assume immediate reinvestment of all dividends. MVW results are net of management costs but do not include brokerage costs of investing in MVW. Performance on is not a reliable indicator of future performance. The S&P/ASX 200 Index is shown for comparison purposes as it is the widely recognised benchmark used to measure the performance of the broad Australian equities market. It includes the 200 largest ASX-listed companies, weighted by market capitalisation. MVW’s index measures the performance of the largest and most liquid ASX-listed companies, weighted equally at rebalance. MVW’s index has fewer companies and different industry allocations than the S&P/ASX 200.
Risk of losing money in a downturn
Passive investing may not protect investors against market downturns. The S&P/ASX 200 for example lost over 50% of its value during the GFC. Active managers have claimed that they have ways to limit the downside, including stock selection, portfolio construction and the ability to increase their cash allocation, but according to S&P, historical data argues otherwise.
A review of the index MVW tracks, the MVIS Australia Equal Weight Index, compared to the S&P/ASX 200, to capture the aforementioned GFC fall, illustrates it had periods where it performed worse than the benchmark index during a fall (for example the GFC, in which case it recovered faster) and periods when it performed better, and lost less in a downturn (for example 2015-2016) or more recently, after 'Liberation Day'..
Chart 3: Drawdown: MVW’s Index and S&P/ASX 200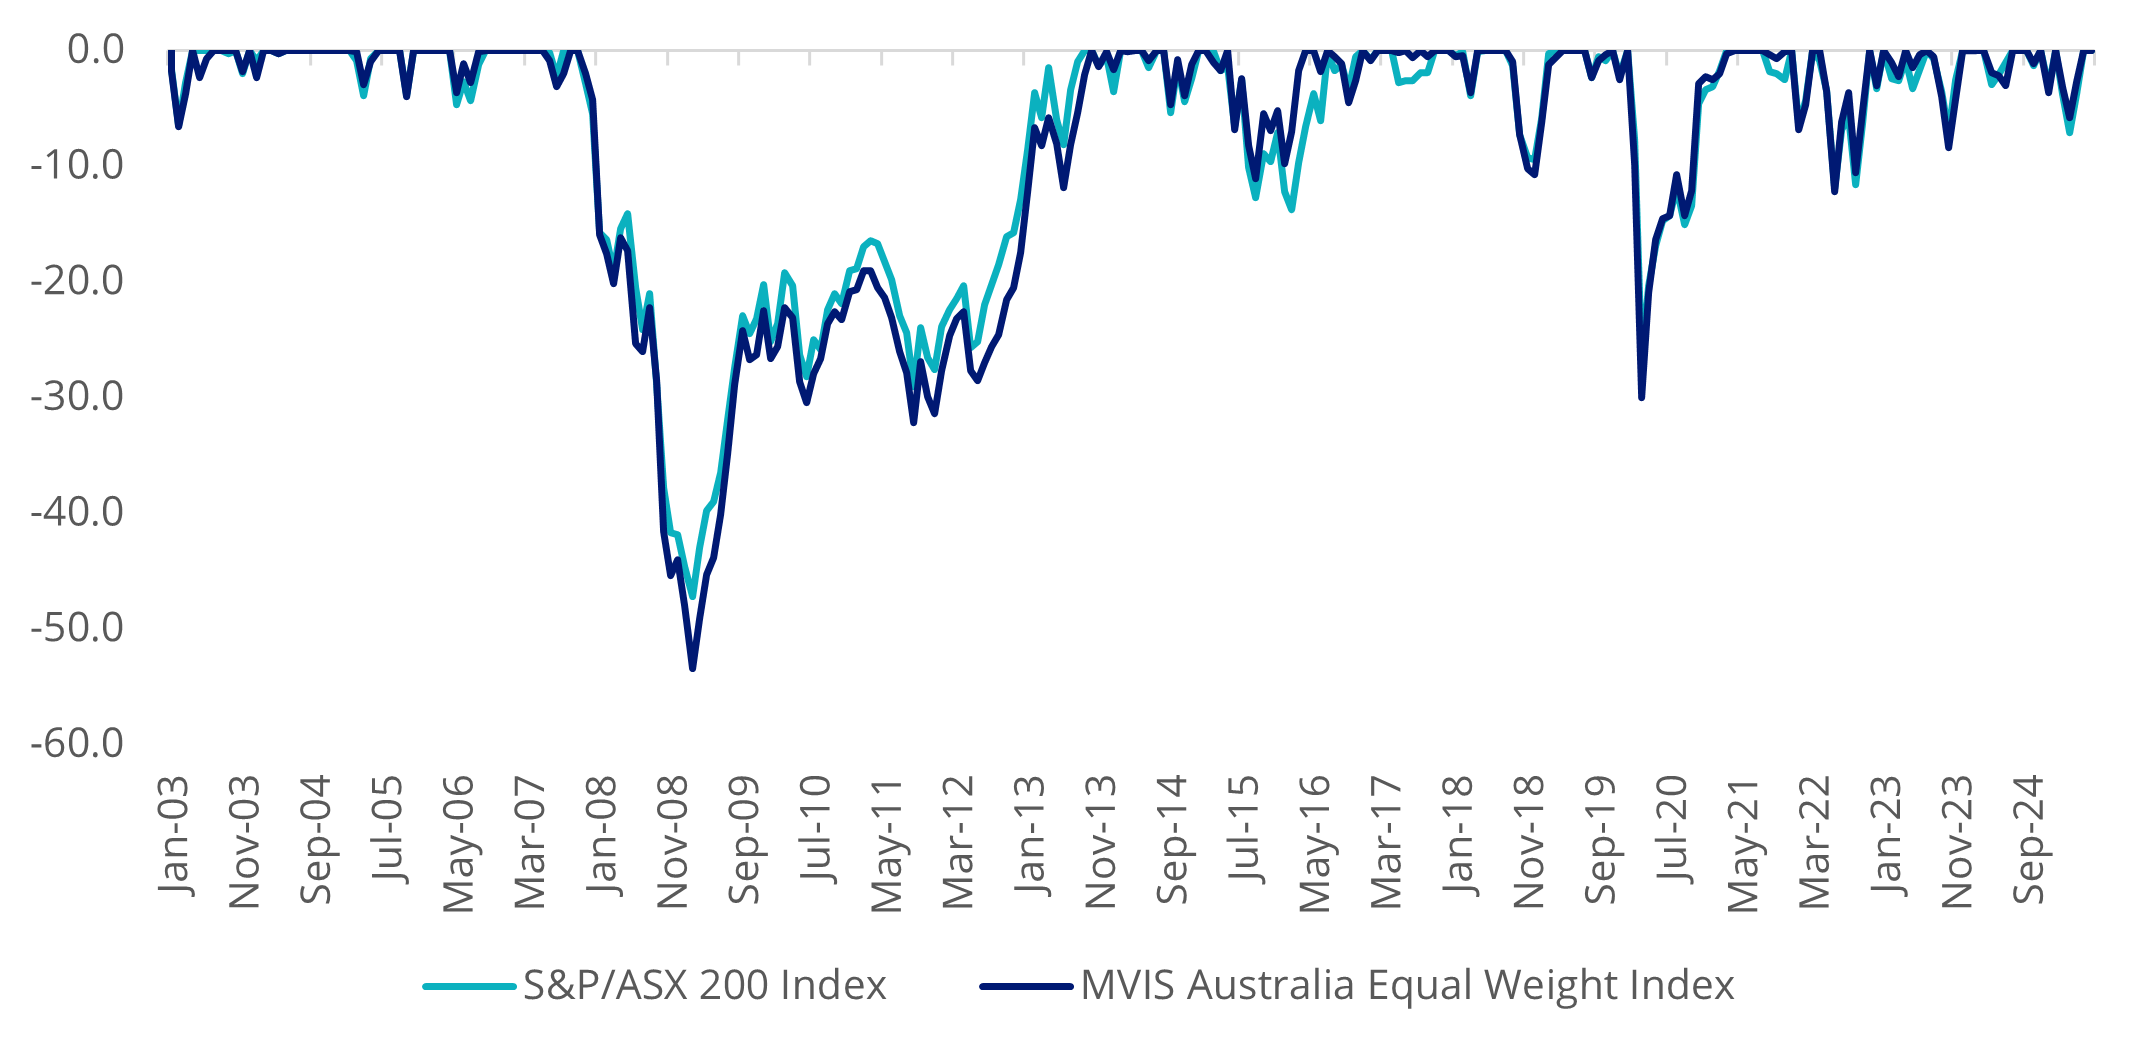
Source: VanEck, FactSet, as at 30 June 2025. MVIS Australia Equal Weight Index (MVW Index) inception date is 1 January 2003. Results are calculated to the last business day of the month and assume immediate reinvestment of all dividends and exclude costs associated with investing in MVW. You can’t invest directly in an index. Past performance of MVW’s Index is not a reliable indicator of future performance of MVW. The S&P/ASX 200 Index is shown for comparison purposes as it is the widely recognised benchmark used to measure the performance of the broad Australian equities market. It includes the 200 largest ASX-listed companies, weighted by market capitalisation. MVW’s index measures the performance of the largest and most liquid ASX-listed companies, weighted equally at rebalance. MVW’s index has fewer companies and different industry allocations than the S&P/ASX 200.
Active, passive and smart beta, there may be no place to hide in an Australian equity market downturn for investors that equate risk with losses.
According to modern portfolio theory, one way to mitigate losses is to diversify. Diversification provides the potential to reduce losses from some stocks with offsetting gains from others. An equities portfolio down therefore should be diversified by sector and stock so no single sector or stock should dominate the portfolio.
This leads us to the third risk, which exposes the myth that tracking a benchmark reduces risks.
Concentration
Most Australian equity investors think they are diversifying and therefore taking on less risk when they invest in passive funds that track indices that include Australia’s largest 200 companies. It sounds odd, but by tracking these benchmarks, investors actually get the opposite of diversification: they get concentration.
Simply put, the Australian benchmark, the market capitalisation weighted S&P/ASX 200 Index, is dominated by financials and materials (including miners) companies. Passive funds which track this index, and even active Australian equity managers not wanting to risk significant underperformance or deviation from the benchmark, carry these inherent biases in their portfolios. This means most Australian investors’ portfolios are overexposed to the largest stocks on ASX: the big 4 banks, the mega-cap miners and their sectors.
This creates concentration risk in Australian portfolios. Concentration makes sense if you have high conviction in these stocks and sectors, but for a core strategic allocation it introduces unintended risk.
Investors buying a ‘diversified’ Australian portfolio would assume that their fund is more diversified than just 10 stocks representing nearly 50% of the portfolio and one sector (financials) representing over 35%, as tracking the S&P/ASX 200 produces.
Of course, there is a way to measure concentration, and therefore when used inversely, it gives an indication of diversification. Economist Orris Clemens Herfindahl developed the Herfindahl Index and he first used his calculation to determine the concentration within the US steel industry. A lower Herfindahl index signifies less concentration and greater diversification.
As at the last rebalance in June 2025, the Herfindahl Index for the S&P/ASX 200 was 334. The equivalent measure for the index MVW tracks was 135. The MVW Index is therefore around two and a half times less concentrated than the S&P/ASX 200. In other words, the MVW Index is almost two and a half times more diversified than the S&P/ASX 200.
Let’s talk about fees
Are you getting value?
There is no doubt that fees are an important consideration for investors. But it is secondary to an investment outcome.
We hope that we have given you a few ideas to assess whether you are getting what you pay for. You don’t want to over pay, likewise, the cheapest may not achieve the outcome you desire.
As always, we would recommend you speak to a financial adviser or broker to determine which Australian equity investment is right for you. Their advice, we would argue, can also be value for money.
Key risks
An investment in MVW carries risks associated with: financial markets generally, individual company management, industry sectors, fund operations and tracking an index. See the PDS for details.
1SPIVA Australia Full-Year 2024 | S&P Dow Jones Indices
2The Sharpe Ratio takes the excess return against a relevant risk-free and divides it by the standard deviation of the return. The risk-free rate used is the RBA Cash Rate.


Last Updated On: 24 July 2025
Any views expressed are opinions of the author at the time of writing and is not a recommendation to act.
VanEck Investments Limited (ACN 146 596 116 AFSL 416755) (VanEck) is the issuer and responsible entity of all VanEck exchange traded funds (Funds) trading on the ASX. This information is general in nature and not personal advice, it does not take into account any person’s financial objectives, situation or needs. The product disclosure statement (PDS) and the target market determination (TMD) for all Funds are available at vaneck.com.au. You should consider whether or not an investment in any Fund is appropriate for you. Investments in a Fund involve risks associated with financial markets. These risks vary depending on a Fund’s investment objective. Refer to the applicable PDS and TMD for more details on risks. Investment returns and capital are not guaranteed.
MVIS Australia Equal Weight Index (‘MVIS Index’) is the exclusive property of MV Index Solutions GmbH based in Frankfurt, Germany (‘MVIS’). MVIS is a related entity of VanEck. MVIS makes no representation regarding the advisability of investing in the Fund. MVIS has contracted with Solactive AG to maintain and calculate the MVIS Index. Solactive uses its best efforts to ensure that the MVIS Index is calculated correctly. Irrespective of its obligations towards MVIS, Solactive has no obligation to point out errors in the MVIS Index to third parties.