Navigating reflations, rotations and recoveries.
April was almost a ‘reverse rotation’, with equity markets posting strong gains following the rotation from growth to value stocks that commenced at the end of last year. This ‘reverse rotation’ has already been shown to be short-lived.
Manoeuvring portfolios to meet the challenges and idiosyncrasies of these capital markets is no easy feat. The recovery will continue as the economy navigates through setbacks such as COVID clusters, poor economic data and the threat of interest rate rises. Seeing through the noise, and focusing on an investment approach that withstands the test of time is as important as ever.
The current recovery in markets highlights the need for investors to have the necessary tools to manoeuvre portfolios to meet the challenges and idiosyncrasies of these markets. Navigating the world of investment opportunities through Smart Beta ETFs has empowered advisers and investors to build robust portfolios and target outcomes.
During the first quarter of this year the pace of recovery surged beyond economists’ expectations with Citigroup’s Economic Surprise Index reaching historic highs in Q3 2020 (chart 1). But it has since started to normalise.
Chart 1 – G10 Citigroup Economic Surprise Index
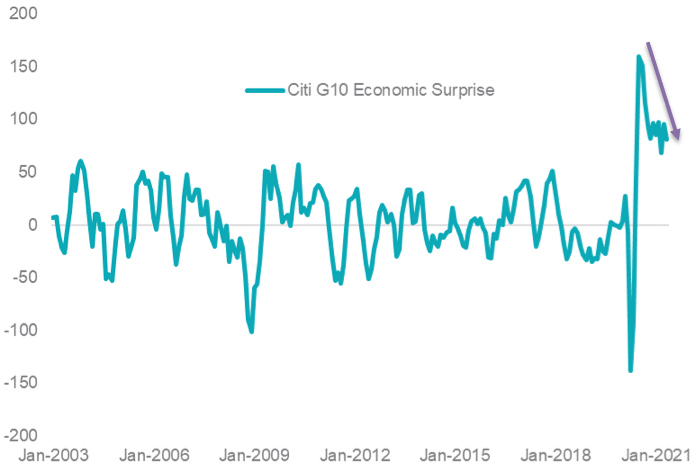
Source: Citigroup, Bloomberg. January 2003 to April 2021.
This chart measures ‘surprise’, but it doesn’t differentiate between an upside surprise and a downside surprise. Therefore, an optimist’s view of this data would be that data releases have been stronger than expected while a pessimist’s would be that data releases have been worse than expected.
The normalisation in results then, may be an indication that the global economy is transitioning from an early-cycle to a mid-cycle recovery, which has historically boded well for quality stocks. Quality stocks, according world leading index provider MSCI, are those with: high return on equity (ROE, stable year-on-year earnings growth and low financial leverage).
An early-cycle to a mid-cycle recovery is usually characterised by falling PMIs (Purchasing Managers' Index).
Expansion in economic activity is at the highest level since 1997, represented by the US Institute of Supply Management (ISM) Manufacturing PMI Index (chart 2). ISM Manufacturing PMI measures the change in production levels across the US economy from month-to-month. It is considered to be a key indicator of the state of the US economy.
Chart 2 – US ISM Manufacturing PMI Index
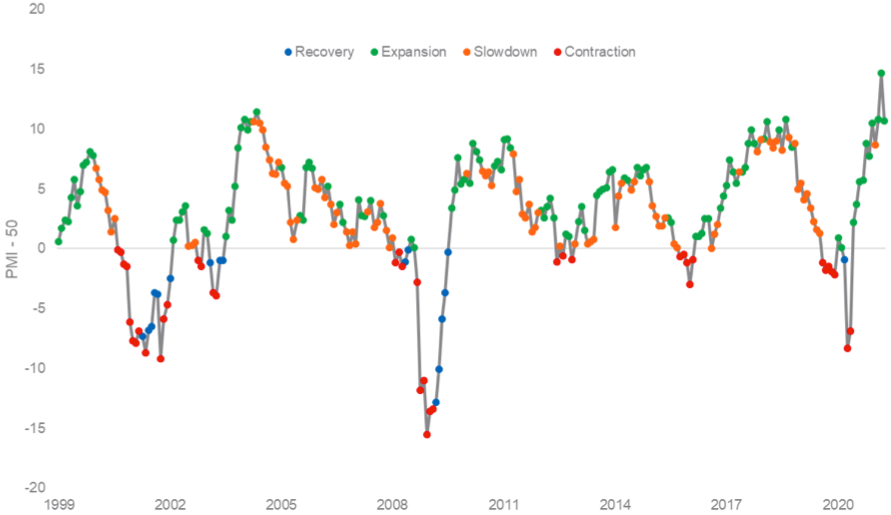
Source: Bloomberg, November 1997 to April 2021. Economic phase is a function on the current value of PMI-50 and the three-month change in PMI. Change>0, Level<0 = Recovery. Change>0, Level>0 = Expansion. Change<0, Level>0 = Slowdown. Change<0,Level<0 = Contraction.
Quality is one of the factors MSCI identify in its factor suite of indices. Others include Momentum, Growth and Enhanced Value. MSCI creates an index for each of these factors. With the performance of these indices we are able to analyse how these factors perform during different phases of the economic cycle noted above.
One useful tool for comparison between different performance series is the information ratio. The information ratio measures returns beyond the performance of a benchmark index compared to the volatility of those returns. A positive value indicates risk-adjusted outperformance relative to the benchmark index.
In this instance we calculate the information ratios of different MSCI World Factors using the MSCI World Index as the benchmark.
Our analysis is presented in Chart 3 below. It shows that those stocks that exhibit the MSCI Quality Factor historically outperform during slowdown “mid-cycle recovery” and contraction “recession” periods.
Chart 3 – Information ratio by MSCI World Factor and economic phase
|
Factor Information Ratio |
||||
|
Period |
Quality |
Momentum |
Growth |
Enhanced Value |
|
Recovery |
0.20 |
0.02 |
0.05 |
0.41 |
|
Expansion |
-0.11 |
0.21 |
0.13 |
0.16 |
|
Slowdown |
0.24 |
0.20 |
0.00 |
0.04 |
|
Contraction |
0.39 |
-0.15 |
0.00 |
-0.01 |
Source: Bloomberg, VanEck. MSCI World Factor indices. November 1997 to April 2021.
Should PMIs print lower than their current levels, which would indicate a slowdown or contraction, Quality could shine. On the other hand, should PMIs continue to be stronger indicating an expansion, Enhanced Value could shine.
Smart beta ETFs empower investors to be positioned for both of these outcomes.
| Quality: | VanEck Vectors MSCI World ex Australia Quality ETF (QUAL) VanEck Vectors MSCI World ex Australia Quality (Hedged) ETF (QHAL) |
Value: |
VanEck Vectors MSCI International Value ETF (VLUE) |
And both of these factors, according to MSCI, are able to demonstrate long-term outperformance versus the parent MSCI World Index.
For Quality – click here
For Value – click here


Published: 21 May 2021
Important notice:
VanEck Investments Limited ACN 146 596 116 AFSL 416755 (‘VanEck’) is the responsible entity and issuer of units in the VanEck Vectors MSCI World ex Australia Quality ETF (QUAL), VanEck Vectors MSCI World ex Australia Quality (Hedged) ETF (QHAL) and VanEck Vectors MSCI International Value ETF (VLUE). This is general advice only, not personal financial advice. It does not take into account any person’s individual objectives, financial situation or needs. Read the PDS and speak with a financial adviser to determine if the fund is appropriate for your circumstances. The PDS is available here.
An investment in QUAL, QHAL and VLUE has risks, including possible loss of capital invested. QUAL QHAL and VLUE carry risks associated with: financial markets generally, individual company management, industry sectors, ASX trading time differences, foreign currency, country or sector concentration, political, regulatory and tax risks, fund operations and tracking an index. See the PDS for details. No member of the VanEck group guarantees the repayment of capital, the payment of income, performance, or any particular rate of return from either fund.
QUAL, QHAL and VLUE are indexed to a MSCI indices. QUAL, QHAL and VLUE are not sponsored, endorsed or promoted by MSCI, and MSCI bears no liability with respect to QUAL, QHAL and VLUE or the MSCI Index. The PDS contains a more detailed description of the limited relationship MSCI has with VanEck and QUAL, QHAL and VLUE.