Smart beta: the Adviser’s choice
Each year VanEck conducts the Australian Smart Beta Survey. This is its sixth year and over 540 financial advisers from around the country took part. The results are clear. More and more financial advisers are using smart beta to replace active managers. Advisers that use smart beta are satisfied with its construct and performance. The rise of smart beta is happening in Australia right now.
We’ve talked extensively about the rise of smart beta and the disruption of active management. We think that smart beta products are a disruptive innovation with the potential to affect the businesses of active managers. Now we are finally witnessing active managers changing their businesses, highlighting that the disruption is well and truly underway. VanEck’s most recent Smart Beta Survey shows advisers are flocking to smart beta, attracted by their performance, targeted outcome, diversification, lower fees relative to active and ease of use.
Institutional investors have used smart beta as a low cost way to invest and their genesis can be traced back to the 1970s. Smart beta strategies combine the systemic approaches of active management within the construct of a passive strategy, combining the best of both worlds.
At the forefront of smart beta innovation is another more recent innovation in investing: exchange traded funds or ‘ETFs’. Smart beta ETFs therefore combine the best aspects of active and passive management by tracking indices that deliver a chosen investment outcome, all the while retaining transparency, liquidity and ease of trading within defined rules.
We think the disruption is well and truly underway.
This is not as surprising as it should be
Forewarning the rise of smart beta was a 2016 scholarly article published in the CFA Institute's Financial Analysts Journal. In their paper, ‘The Asset Manager's Dilemma: How Smart Beta is Disrupting the Investment Management Industry', authors Ronald Kahn and Michael Lemmon described smart beta as:
“a disruptive financial innovation with the potential to significantly affect the business of traditional active management..” (Kahn and Lemmon, 2016)
Their paper successfully illustrated that current fee levels, of the global equity universe they analysed, were inconsistent with the performance outcome. They are too high. Over 35% of global equity managers, according to Kahn and Lemmon’s analysis, will be disrupted by smart beta.
That figure might be too low.
The disruption is happening in Australia
VanEck’s recent, sixth annual Smart Beta Survey, the biggest survey of its kind worldwide, once again demonstrated that the most important factor for an adviser selecting smart beta, is not fees. It is performance.
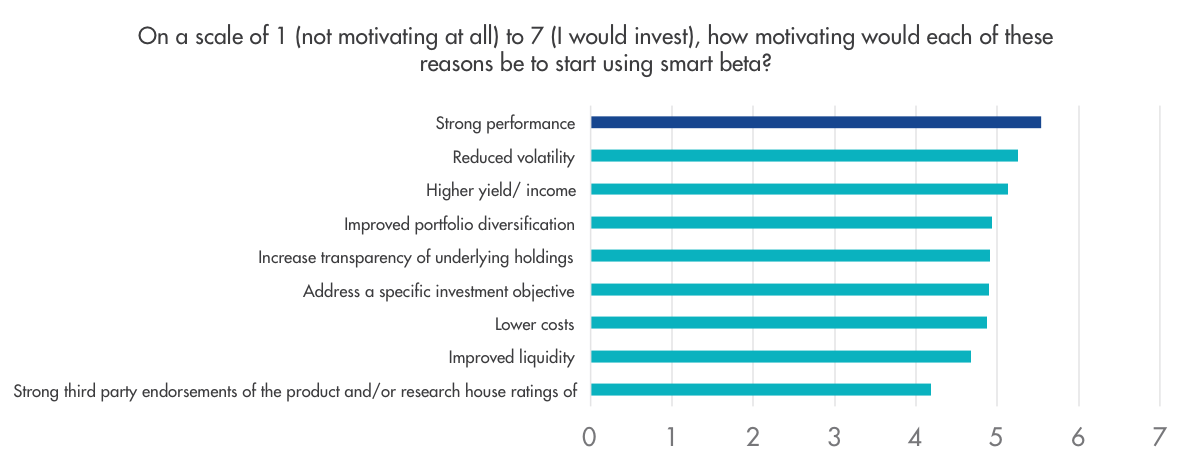
Source: VanEck Smart Beta Survey, 2021
Active managers should take note. This past week S&P released its most recent SPIVA report for Australian Funds and once again it does not make good reading for active fund managers. The summary states: “For longer measured periods (3, 5, 10, and 15 years), the majority of active funds underperformed their respective benchmark indices across categories.”
More worrying for active managers, the VanEck Smart Beta Survey indicates over 50% of advisers are using smart beta to replace active managers. The reason is increased performance.
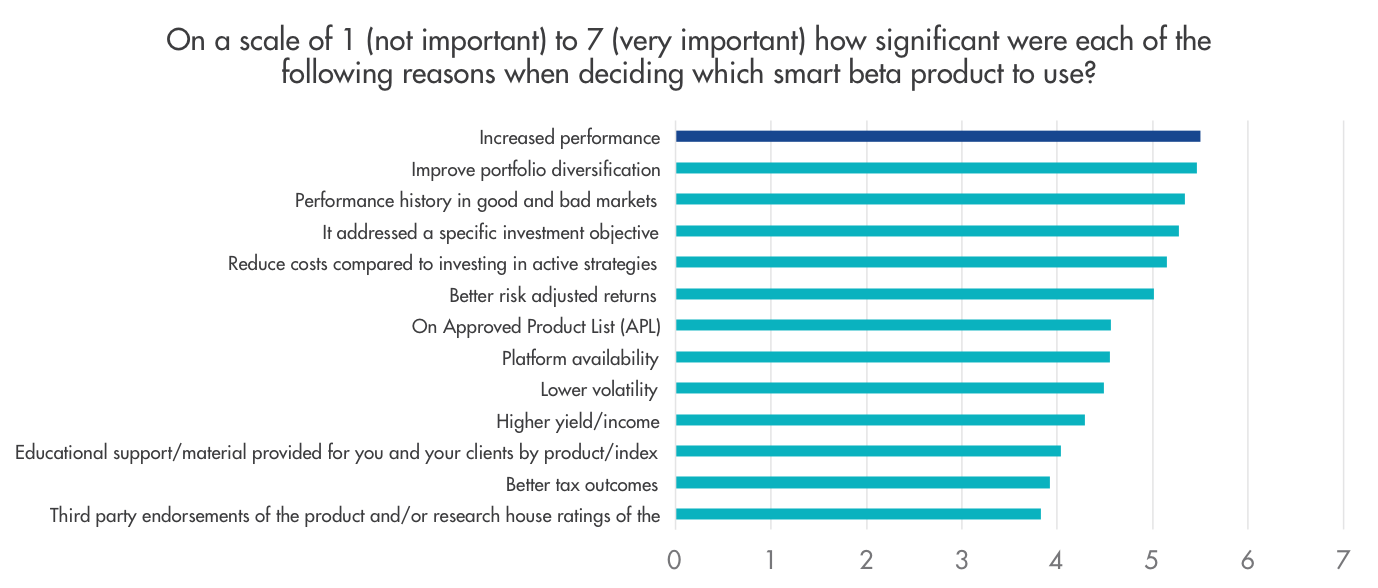
Source: VanEck Smart Beta Survey, 2021
The survey also found 99% of smart beta users are satisfied with their strategy. This finding has been consistent in every year of the survey. The disruption is happening.
In practice, we are seeing this play out in global equities. Since its inception on 29 October 2014, the VanEck MSCI International Quality ETF (QUAL) has returned 18.72% p.a., outstripping the standard industry benchmark, the MSCI World ex Australia Index, by 3.73% p.a.
QUAL Performance to 31 August 2021
|
1 Mth (%) |
3 Mths (%) |
6 Mths (%) |
1 Year |
2 Years (% p.a.) |
3 Years (% p.a.) |
4 Years (% p.a.) |
5 Years (% p.a.) |
Since QUAL Inception (% p.a.) |
|
|
QUAL |
3.91 |
17.73 |
30.56 |
32.97 |
24.58 |
20.10 |
22.45 |
19.65 |
18.72 |
|
MSCI World ex Australia Index |
3.10 |
12.31 |
23.23 |
31.37 |
18.40 |
14.68 |
17.01 |
15.59 |
14.99 |
|
Difference |
+0.81 |
+5.42 |
+7.33 |
+1.60 |
+6.18 |
+5.42 |
+5.44 |
+4.06 |
+3.73 |
*Inception date is 29 October 2014
Source: Morningstar Direct, VanEck. The chart above shows past performance of QUAL and of the MSCI World ex Australia Index. You cannot invest directly in an index. Results are calculated to the last business day of the month and assume immediate reinvestment of distributions. QUAL results are net of management fees and other costs incurred in the fund, but before brokerage fees and bid/ask spreads incurred when investors buy/sell on the ASX. Returns for periods longer than one year are annualised. Past performance is not a reliable indicator of future performance. The MSCI World ex Australia Index (“MSCI World ex Aus”) is shown for comparison purposes as it is the widely recognised benchmark used to measure the performance of developed market large- and mid-cap companies, weighted by market capitalisation. QUAL’s index measures the performance of 300 companies selected from MSCI World ex Aus based on MSCI quality scores, weighted by market cap x quality score at rebalance. Consequently QUAL’s index has fewer companies and different country and industry allocations than MSCI World ex Aus.
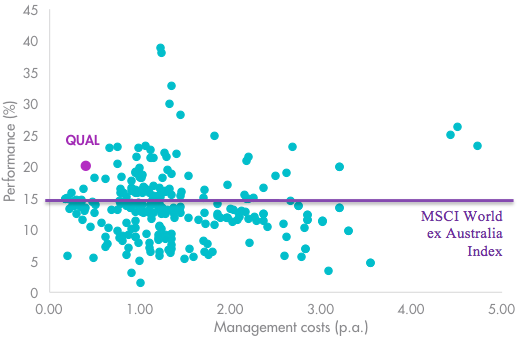
The impressive performance above has been achieved for a fee of just 0.40% p.a., making QUAL one of the lowest cost managed funds in its peer group. As you can see below, QUAL’s low fee stands out among those managers that can boast outperformance over the past three and five years to the end of August 2021. You can see most actively managed funds charge much higher fees, generally between 1% and 1.5% p.a. What this means is that active managers have to outperform QUAL by at least the difference between their total fees (including performance fees) and QUAL’s lower fees to just break even with QUAL every year. You can see below despite these higher fees the bulk of these funds have underperformed QUAL and the benchmark.
|
Global equity: |
Global equity: |
 |
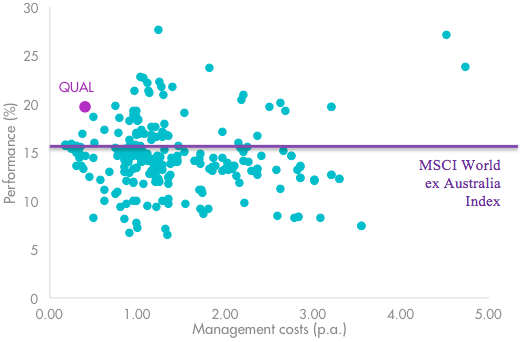 |
Source: Morningstar, as at 31 August 2021. Past performance is not a reliable indicator of future performance. . Results are calculated to the last business day of the month and assume immediate reinvestment of distributions. Results are net of management fees and other costs incurred in the fund, but before brokerage fees and bid/ask spreads. Returns for periods longer than one year are annualised. Past performance is not a reliable indicator of future performance. The peer group of Global Equities includes Morningstar’s Open Ended Global Equity Blend Category, Morningstar’s Open Ended Global Equity Growth Category and Morningstar’s Open Ended Global Equity Value Category that are based on the defined Australian universe of funds that invest primarily in large global companies. Management costs are Maximum Management Costs in Morningstar Direct and does not include performance fees.
QUAL demonstrates that smart beta strategies can consistently deliver investors active outcomes for low passive fees.
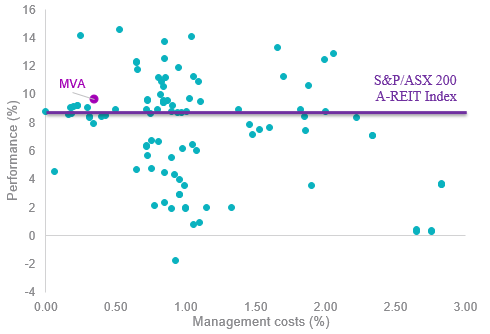
The same is true of other asset classes. For example, VanEck’s smart beta Australian Property ETF (MVA) has outperformed the market capitalisation S&P 200 A-REIT Index since its inception. As you can see below, MVA’s low fee stands out among those managers that can boast outperformance over the past three and five years to the end of August 2021 too.
|
Australian Property: |
Australian Property: |
 |
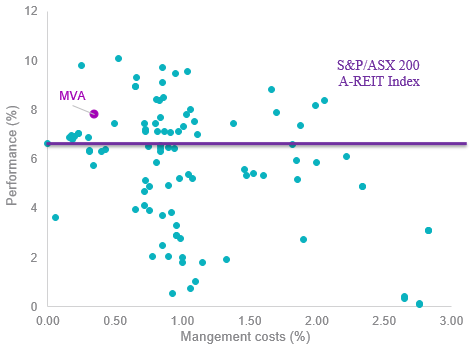 |
Source: Morningstar, as at 31 August 2021. Past performance is not a reliable indicator of future performance. . Results are net of management fees and other costs incurred in the fund, but before brokerage fees and bid/ask spreads. Results are calculated to the last business day of the month and assume immediate reinvestment of distributions. Returns for periods longer than one year are annualised. Past performance is not a reliable indicator of future performance. The peer group of Australian Property includes Morningstar’s Open Ended Equity Australia - Real Estate Category which includes funds invest almost exclusively in Australian listed property trusts. This may be either completely in their own right or through property syndicates. At least 75% of the portfolio is invested in listed property, with a smaller component in direct property and/or cash. Management costs are Maximum Management Costs in Morningstar Direct and does not include performance fees.
There is no doubt that those active managers with an investing edge will continue to be selected in portfolios, but you can see from the above, there are many active managers below the purple line and even more below the purple dots.
QUAL and MVA are just two smart beta strategies disrupting active management.
Active fund managers often use management jargon like ‘disruptive innovation’ in their marketing when they describe how they assess the companies and industries they invest. Now, to compete with existing smart beta strategies they have to recognise the disruption in their own industry. At the very least, they need to lower fees to better reflect their performance. It is one way to ensure their long-term survival.
Those with performance that does not match up to fees, will not survive.


Published: 10 September 2021
VanEck Investments Limited ACN 146 596 116 AFSL 416755 (‘VanEck’) is the responsible entity and issuer of units in the VanEck MSCI International Quality ETF (QUAL) and VanEck Australian Property ETF (MVA). This is general advice only, not personal financial advice. It does not take into account any person’s individual objectives, financial situation or needs. Read the PDS and speak with a financial adviser to determine if the fund is appropriate for your circumstances. The PDS is available here. An investment in QUAL carries risks associated with: financial markets generally, individual company management, industry sectors, ASX trading time differences, foreign currency, country or sector concentration, political, regulatory and tax risks, fund operations and tracking an index. See the PDS for details. No member of the VanEck group of companies guarantees the repayment of capital, the payment of income, performance, or any particular rate of return from any fund. An investment in MVA carries risks associated with: financial markets generally, individual company management, industry sectors, fund operations and tracking an index. See the PDS for details. No member of the VanEck group of companies guarantees the repayment of capital, the payment of income, performance, or any particular rate of return from any fund