Stagflation – returning or not?
After Russia’s invasion of Ukraine, economists became more concerned about the risk of stagflation. For many people this may have been the first they heard that term. They were not alive in the ‘70s, when stagnation last reared its ugly head. The ‘stag’ they know is a male deer. Strong and majestic. The ‘stag’ of stagflation, derives from the Latin stagnare, meaning form a pool of standing water. In other words, stagnant water. It can be unpleasant. Whether it is coming or not, investors can position for it.
The term ‘stagflation’ is attributed to Iain Macleod, a Chancellor of the Exchequer who used the word in a speech to British parliament to describe a period of simultaneous high inflation and low employment. "We now have the worst of both worlds—not just inflation on the one side or stagnation on the other, but both of them together. We have a sort of 'stagflation' situation,” Macleod warned. In 1965, the UK was heading toward a period of stagflation. Now, there are fears we too are heading toward a period of stagflation.
Prior to ‘stagflation’ occurring in the late 1960s and 1970s, many economists thought it was not possible. Unemployment and inflation rates, according to Keynesian economics, generally move in opposite direction. The foundation of this idea was the experience that as prices rise due to high demand, it in turn encourages companies to hire more. Vice versa, as demand falls, prices fall so too does demand for employment.
In the late ‘60s and early ‘70s economies, starting with the UK, were experiencing high inflation coupled with low demand and thus low employment growth. This had come about from an, almost, perfect storm of factors.
By the late ‘60s the post-World War II boom was fading. Industrialised countries such as the UK and the US faced greater competition for manufacturing jobs from Asia and Eastern Europe. The US was also fighting an expensive war in Vietnam. At the same time, the US was the global reserve currency, backed by gold. When the French President Charles de Gaulle announced the intention to exchange its US dollar reserves for gold at the official exchange rate. The US could not afford this and its currency went into free-fall.
There was pressure on employment, growth was slow but pressure on prices was increasing.
President Nixon undertook a series of measures intended to create jobs, manage inflation and protect the value of the US dollar. He implemented a 90-day freeze on wages and prices, imposed tariffs on imports and “closed the gold window”, essentially flagging the beginning of the end of the Bretton Woods system.
Now known as the “Nixon shock”, these moves heightened stagflation. So too did the subsequent ‘oil shock’, because of the formation of the Organization of the Petroleum Exporting Countries (OPEC) that pushed the price of oil sky high.
The old prescriptions, did not work in the face of a negative supply shocks, when the supply curve moves up and in, output falls and prices rise. Attempts to push output up by stimulating the economy has the effect of pushing prices even higher.
Enter the US Federal Reserve (Fed), to do what central banks do to fight inflation. Raising rates. Using monetary policy worsened the issue. Between 1971 and 1978, the Fed was in a seemingly losing battle, raising rates to fight inflation and lowering them to combat a recession.
Stagflation ended after a deep recession brought on by soaring interest rates imposed by the Fed, at the time led by Paul Volker. US inflation, which peaked at 14.8 percent in March 1980, fell below 3 percent by 1983. The Fed funds rate that had averaged 11.2 percent in 1979 soared to a peak of 20 percent in June 1981. Politically and socially unpopular at the time, today economists credit Volker’s Fed for curbing stagflation.
As well as the unemployment and misery caused by the recession, some markets also suffered falls. The trauma inflicted on some investors has had them jumping at stagflation bogeymen ever since.
Today we have some of the similar ingredients that led to stagflation of the ‘70s.
Figure 1: Stagflation worries, the US similarities

Source: US Federal Reserve, US Energy Information Administration, Bureau of Labor Statistics
Inflation is soaring, driven by supply factors. At the same time, economic growth is sluggish. The Russian invasion of Ukraine and subsequent rise in oil prices caused many pundits to point to the similarities between now and the 1970s. The term ‘stagflation’ started to appear in the media.
While the threat of stagflation exists, we think the likelihood of its return is overstated. Either way, there are ways investors can position themselves for high inflation, high rate environments.
Firstly, why do we think stagflation will not occur? Many of the inflation concerns, such as increased infrastructure spending by governments is long term and unlikely to have an immediate impact. Inflation in the US, we think, will not reach levels much higher than its recent high prints. Locally, there may still be some inflation pain to come through.
Economies are also better adapting to ongoing supply constraints. COVID restrictions are easing and populations are becoming more mobile. As well, current Fed Chair, Jerome Powell is a professed admirer of Paul Volker and seems more likely than not to stay on the Fed’s current hiking course.
We think the secular stagnation era, the justification for low rates off into the hazy future, is over.
In an inflationary, high rate, sluggish growth environment there are many ways investors can position their portfolios.
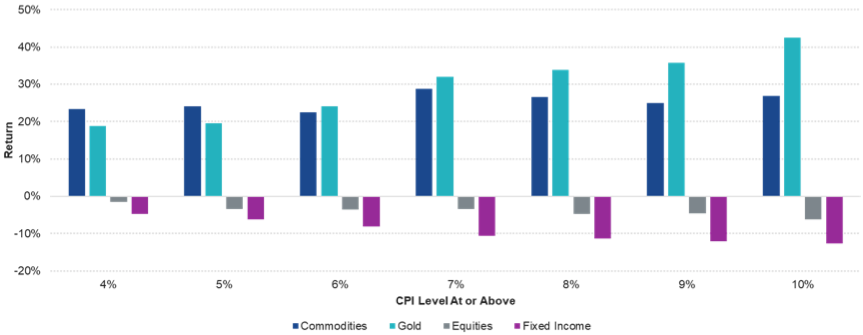
Inflation erodes the value of money, so investors in the past have used gold as a ‘hedge’ against inflation. At the same time, ‘cyclicals’ such as commodities have tended to do well when inflation was high.
Figure 2: Average 12-month real return when CPI is at or above certain levels (1969-1981)

Source: Bloomberg. “Commodities” = Bloomberg Commodity Index; “Gold” = Gold spot price in U.S. dollars per troy ounce; “Equities” = S&P 500 Index; “Fixed Income” = U.S. Generic Government 10-Year Treasury yield. Past performance is not indicative of future results.
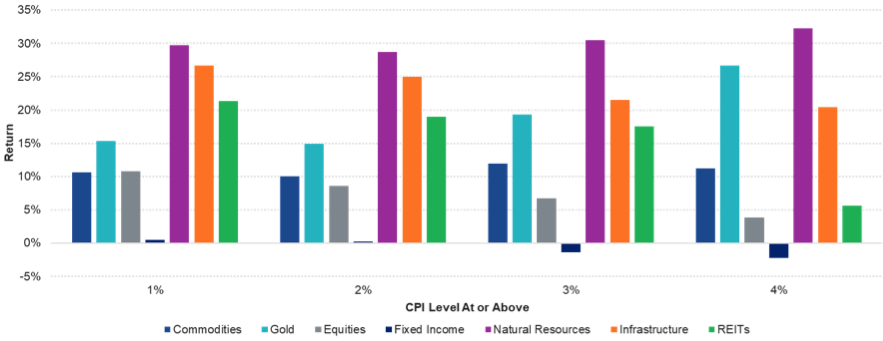
Real assets, that is those with physical value, such as real estate and have infrastructure outperformed in periods of high inflation in the past.
Figure 3: Average 12-month real return when CPI is at or above certain levels (2003-2007)

Source: Bloomberg. “Commodities” = Bloomberg Commodity Index; “Gold” = Gold spot price in U.S. dollars per troy ounce; “Equities” = S&P 500 Index; “Fixed Income” = U.S. Generic Government 10-Year Treasury yield; “Natural Resources” = S&P Global Natural Resources Index; “Infrastructure” = S&P Global Infrastructure Index; “REITS” = Dow Jones Equity REIT Index Past performance is not indicative of future results.
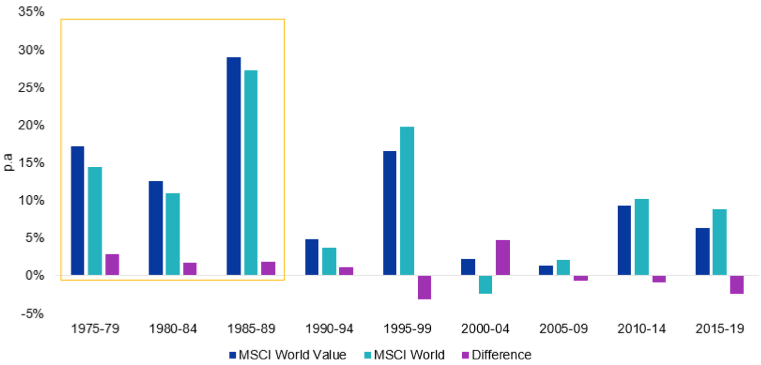
In addition, for equity investors, value companies have tended to outperform when inflation and interest rates increase, as they are less sensitive to changes in macro-economic conditions.
Figure 4: Five year per annum performance comparisons

Source: Bloomberg. MSCI World Value index inception 31 December 1974. Past performance is not a reliable indicator of future performance.
Should global growth continue to be slow, quality could be the go-to strategy1.
We have said before, that the only thing constant in markets is uncertainty. Investors, more than ever need to be on guard to ensure that inflation does not erode their returns or the value of their capital. While the threat of stagflation remains, central bankers and policy makers will be doing all they can to avoid it. If this time next year inflation is still hitting historical highs, they may be forced to bring the Volker artillery, but we think are a long way off that.
Related Insights
Published: 01 April 2022
Any views expressed are opinions of the author at the time of writing and is not a recommendation to act.
VanEck Investments Limited (ACN 146 596 116 AFSL 416755) (VanEck) is the issuer and responsible entity of all VanEck exchange trades funds (Funds) listed on the ASX. This is general advice only and does not take into account any person’s financial objectives, situation or needs. The product disclosure statement (PDS) and the target market determination (TMD) for all Funds are available at vaneck.com.au. You should consider whether or not an investment in any Fund is appropriate for you. Investments in a Fund involve risks associated with financial markets. These risks vary depending on a Fund’s investment objective. Refer to the applicable PDS and TMD for more details on risks. Investment returns and capital are not guaranteed.
1- https://www.vaneck.com.au/globalassets/home.au/media/managedassets/library/assets/white-papers/vaneck_whitepaper_qual_w05.pdf & https://www.vaneck.com.au/globalassets/home.au/etf/equity/qual/vaneck_qual-brochure_f_online.pdf


