Time to come clean
Despite the fees they charge Australian investors, some active fund managers aren’t very active at all. They could more accurately be described as closet benchmark-huggers rather than stock pickers. Now’s the time for investors to identify those with something to hide and demand they be more transparent about their activities, or lack of them.
A simple statistic can reveal just how active an equity manager is. ‘Active share’ is a measure of the amount by which a fund manager's portfolio differs from the benchmark index.
Active management is picking stocks to outperform a benchmark index. An active manager can only add value relative to the index by deviating from it. The ability to pick the right stocks is the pretext for investors paying a higher management cost than they would pay an index fund manager who merely aims to track the benchmark. So, as an investor, you’d expect that as a starting point the active share for an active Australian equity fund would be quite high.
But, you’d be wrong.
According to Morningstar the range of active share scores, compared to the S&P/ASX 200, for Large Cap Australian1 active equity managers ranges from around 25% to 85%. The median is consistently around 50%. The Yale academics2 who first proposed the metric suggested that funds with active shares below 60% should be avoided because they are ”closet indexers”3 that charge high fees for providing index-like returns. It seems this may be the case for many Australian equity funds.
Active share is calculated by taking the sum of the absolute differences between the weight of each holding in the manager's portfolio, and the weight of that holding in the benchmark index, and dividing by two.
![]()
An analysis by VanEck of the active share for the ten largest Australian broad-based equity funds in Morningstar universe reinforces that some active managers are in fact closet index-huggers. In other words, they aren’t doing much stock-picking. They aren’t doing the work that investors expect and that investors pay them to do.
The table below reveals that eight of the 10 largest broad-based Australian equity funds most have had average active share measures below 50%, indicating they have been holding portfolios similar to their benchmark.
We have also shown in the table, our smart beta, VanEck Vectors Australian Equal Weight ETF (MVW). MVW tracks a different Australian equity index than the S&P/ASX 200. The table shows that MVW is more active than six of the ‘active’ fund managers in the table. Yet its management cost is significantly lower than five of them. In other words, for a lower fee, you can be more active than some of the biggest funds in Australia.
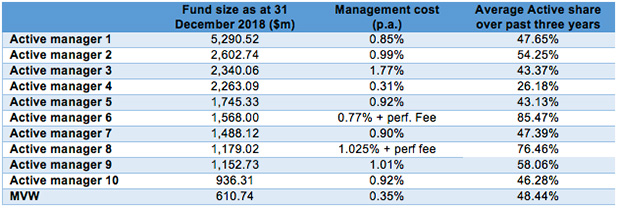
Source: Morningstar, Active manager PDS’s. Average active share over the three years to 31 December 2018 is based on quarter end holdings. Results are calculated daily and assume immediate reinvestment of all dividends. Results are net of management fees and other costs incurred in the fund but do not include brokerage costs or buy/sell spreads incurred when investing. Past performance is not a reliable indicator of future performance.
By using active share statistics, investors can distinguish between active managers that are truly active and those who simply hold portfolios very similar to the benchmark index. If your manager falls into the latter category and is charging fees higher than index funds, you could be paying for a service that you aren’t receiving.
An investor might want to dig below the active share statistic to understand better the extent their active manager is truly active. The investor might want to look at how the current portfolio is made up.
This curious investor though will find that only index-tracking exchange-traded funds offer investors this transparency.
Because these ETFs publish their holdings daily, investors can review their holdings as often and in as much detail as they require. This can provide a deeper understanding of a fund’s risk/return profile and value for money. This transparency also allows a clear picture of any overlap with stocks they already own, allow them to determine their true diversification.
We expect to see ETFs increasingly becoming the first choice for investors, just as they have in the US, due to their transparency and low fees.
IMPORTANT NOTICE:
For use by financial services professionals only. This information is issued by VanEck Investments Limited ABN 22 146 596 116 AFSL 416755 (‘VanEck’) as responsible entity of the VanEck Vectors Australian Equal Weight ETF (MVW) (‘Fund’). This is general advice only about financial products and not personal advice. It does not take into account any person’s individual objectives, financial situation nor needs. Before making an investment decision in relation to the Fund, you should read the PDS and with the assistance of a financial adviser, consider if it is appropriate for your circumstances. The PDS is available at www.vaneck.com.au or by calling 1300 68 3837. The Fund is subject to investment risk, including possible loss of capital invested. Past performance is not a reliable indicator of future performance. No member of the VanEck group of companies gives any guarantee or assurance as to the repayment of capital, the payment of income, the performance or any particular rate of return from the Fund.
© 2019 VanEck Australia Pty Ltd
1as defined by Morningstar
2Cremers, K. J. Martijn and Petajisto, 2009, How Active is Your Fund Manager? A New Measure That Predicts Performance (March 31, 2009). The Review of Financial Studies, Vol. 22, Issue 9, pp. 3329-3365, 2009
3p 3329


Published: 01 February 2019