History has a way of repeating itself
Why remaining invested comes up trumps
Stock markets are fairly good at pricing in demand trends, earnings expectations, technology innovations and many other things. However, one thing markets have great difficulty putting a price on is uncertainty. A few weeks into his presidency and it appears that Trump's administration will be unconventional, controversial and unpredictable. If we could measure the level of market uncertainty over the next four years, it would likely be off the charts.
The markets are obsessed with Trump's actions and statements, most of which come as tweets. Anything from @realDonaldTrump triggers significant emotional reactions which are hard for any market to ignore. The market fell when it was underwhelmed by the President’s first official interview however more recently the market rallied after President Trump tweeted about tax cuts. When markets fall, it is understandable that investors get spooked and flee the market. However, this can result in losses and prevent investors from reaping the rewards when the market rebounds. Choosing an investment strategy that can outperform in temperamental markets is no mean feat.
Active managers are under increasing pressure to prove their ability to navigate an increasingly volatile political landscape. This is in addition to intimately knowing the companies that they invest in and understanding the environment in which these companies compete. This is difficult.
Most Australian active funds were outperformed by their respective benchmark over one, three and five-year periods according to the latest S&P Dow Jones SPIVA® Australia Scorecard. The following table summarises the percentage of active funds outperformed by their benchmark across Australian equity and Australian bond funds as of 30 June 2016.
Percentage (%) of active funds outperformed by their index
|
Fund category |
Comparison Index |
One-year (%) |
Three-year (%) |
Five-year (%) |
|
Australian Equity General |
S&P/ASX 200 |
59.68 |
65.69 |
69.18 |
|
Australian Equity Mid- and Small-Cap |
S&P/ASX Mid-Small |
61.32 |
51.55 |
38.00 |
|
Australian Bonds |
S&P/ASX Australian Fixed Interest Index |
89.47 |
92.16 |
88.68 |
|
Australian Equity A‑REIT |
S&P/ASX 200 A-REIT |
87.50 |
93.06 |
92.41 |
Source: S&P Dow Jones Indices LLC, Morningstar. Data as of June 30, 2016. Table is provided for illustrative purposes. Past performance is not a reliable indicator of future performance.
Typically, active managers suggest they outperform during period of volatility. The above table captures the first half of a volatile 2016 and, over the longer term, it captures the economic environment recovering from the European debt crisis. Only the best outperformed. Investors in most active funds would have been better off in a low-cost passive fund such as an ETF.
As active managers scramble to position their portfolios to navigate new political complexities and uncover opportunities that will provide strong returns, prudent investors understand the importance of remaining invested during the down times and, most importantly, all the rebounds over the next four years.
2016 provides an extreme example of the importance remaining invested. Let’s look at a scenario where four different investors have $1,000 at the start of 2016 in the VanEck Vectors Australian Equal Weight ETF (MVW).
In January 2016 no poll was predicting Brexit and there were still 16 candidates campaigning for the Republican nomination.
- Investor A had the discipline to stay in MVW throughout the volatility of 2016. At the end of the year she had $1,181.60, a return of 18.16%.
- Investor B got spooked by Brexit in June, redeemed the day after the unexpected result and reinvested a month later when markets had turned. Investor B had $1,103.10 at the end of 2016, a return of a 10.31%.
- Investor C lost confidence in the market after the surprising US presidential election result and missed the December rally. She finished the year with $1,110.80 (11.08% return).
- Investor D tried to time the market and went in and out after both of 2016’s unpredicted poll results. He finished the year with $1,037.20 for a paltry 3.27% return.
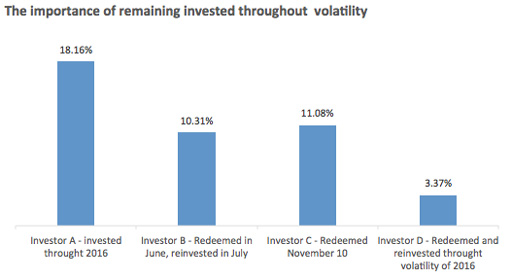
Source: Morningstar Direct, VanEck. Results are calculated daily to the last business day of the month and assume immediate reinvestment of all dividends. MVW results are net of management costs but do not include brokerage costs of investing in MVW. Past performance is not a reliable indicator of future performance.
This shows that if you try to time the market and get it wrong you would be significantly worse off than if you stayed invested for the duration. The probability of correctly timing the market is low. As the old adage says, investing is about “time in the market, not timing the market.”
IMPORTANT NOTICE:
This information is issued by VanEck Investments Limited ABN 22 146 596 116 AFSL 416755 (‘VanEck’) as responsible entity of the VanEck Vectors Australian Equal Weight ETF (MVW) (‘Fund’). This is general information only and not financial advice. It is intended for use by financial services professionals only. It does not take into account any person’s individual objectives, financial situation nor needs. Before making an investment decision in relation to the Fund, you should read the PDS and with the assistance of a financial adviser and consider if it is appropriate for your circumstances. The PDS is available at www.vaneck.com.au or by calling 1300 68 38 37. The Fund is subject to investment risk, including possible loss of capital invested. Past performance is not a reliable indicator of future performance. No member of the VanEck group of companies gives any guarantee or assurance as to the repayment of capital, the payment of income, the performance or any particular rate of return from the Fund.

Published: 09 August 2018