ASX earnings season ends: Keep calm and equal weight
In the current market environment, equal weight investing could show its prowess by allocating to a broader range of sectors and sub-sectors within the Australian economy.
As the earnings season ends, many Australian investors are considering their portfolios. While the season, overall, came in line with expectations, most forward guidance, if given at all was muted. With macro indicators such as GDP growth, a weak commodity outlook and a tightening monetary policy, Australia’s equity market faces headwinds. But having an Australian equity exposure is important. We think, in the current market environment, equal weight investing could show its prowess by being less tied to commodities (metals and mining) and GDP growth (banking).
The earnings season
Australian earnings came in-line with expectations.
Chart 1: S&P/ASX 200 August 2023 earnings result split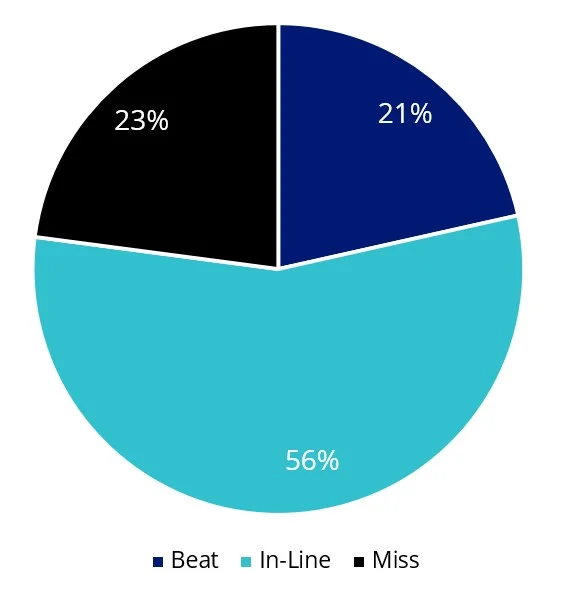
Source: Bloomberg, Index Weighted, as at 25 August 2023, ±5% range for beat/miss
The consumer discretionary sector’s prices jumped on average 2.65% post earnings result with Australian consumers showing resilience. Unfazed (yet) by rising interest rates, fixed rate mortgage cliff and elevated inflation, sales across Wesfarmers, JB Hi-FI, Super Retail Group and Nick Scali grew during FY23.
Australia’s largest bank CBA’s share price rose 2.6% after it announced its results. However, 75% of analysts flag CBA as a sell1. It is one of the most expensive banks in the world based on price to earnings and concerns about the impact of the sector-wide headwinds intensifying in 2024; households experiencing elevated interest burdens from higher interest rates and intense mortgage and deposit competition.
The macro headwinds
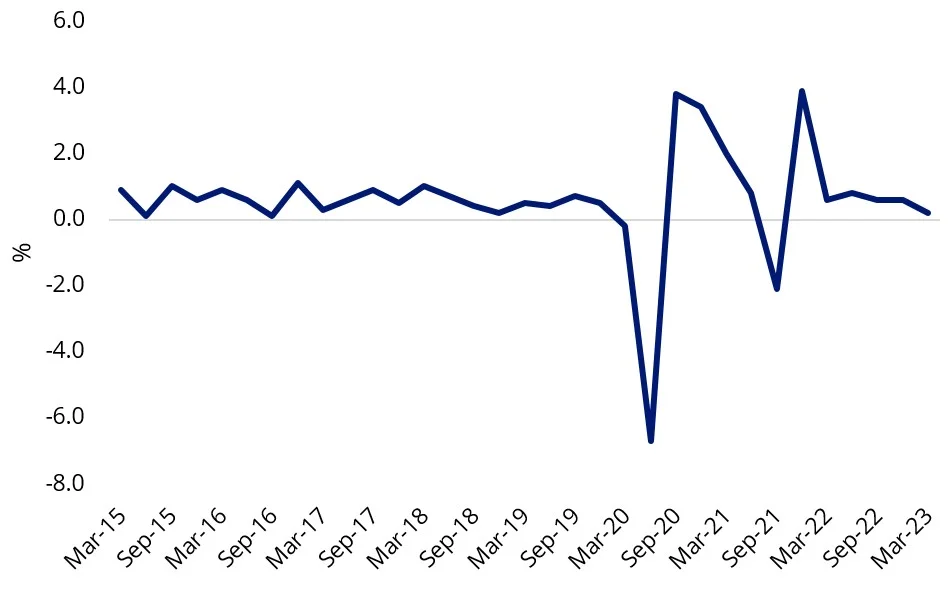
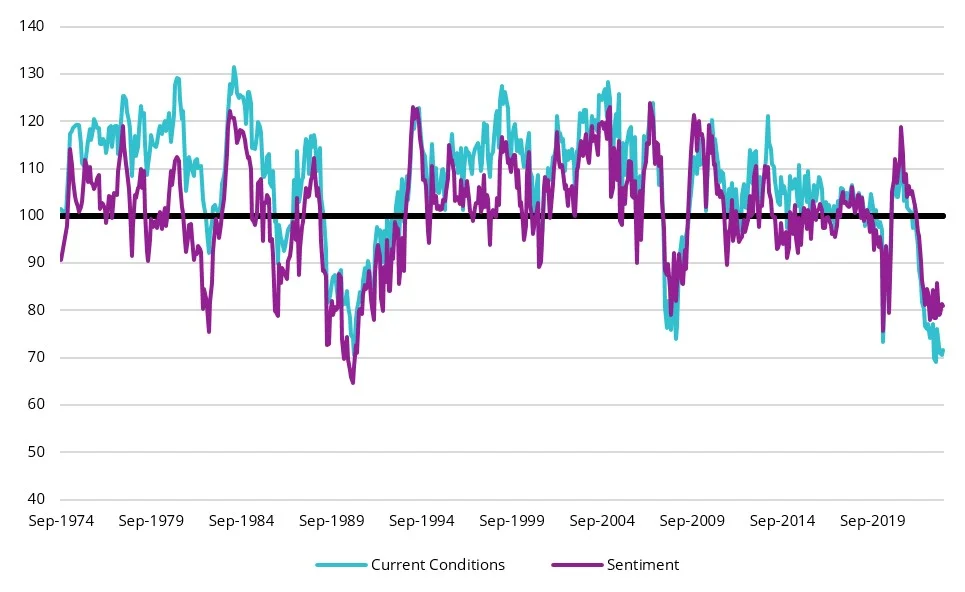
As GDP growth continues to decline and consumer confidence conditions at all-time lows, companies on the Australian share market are expected to face headwinds.
| Chart 2: Australia quarterly growth in GDP (seasonally adjusted) | Chart 3: Westpac - Melbourne Institute Consumer Sentiment & Current Conditions |
 |
 |
| Source: ABS, latest release March 2023 quarter. |
Source: Westpac, Bloomberg, July 2023 |
That’s not to say that there won’t be winners. But it’s unlikely that the winners will come from the sectors that dominate most Australian equity portfolios. A slower-growing China is likely to keep metal prices low, while the Australian banking sector faces the headwinds of lower economic activity, intense mortgage competition, higher funding costs, and customers switching to term deposits (from low-cost transaction and high-interest accounts).
A more balanced approach to Australian equities
Picking those Australian companies that will thrive in this environment is difficult, but it may be a risk going into 2024 having your portfolio overexposed to banking and, metals and mining, as most Australian equity portfolios benchmarked to the S&P/ASX 200 are likely to be.
VanEck’s Australian Equal Weight ETF (MVW) is underweight those sectors. You have probably seen the differences in GICS sector breakdown before. MVW is currently underweight the financials sector by 7.9% and materials by 6.0%.
Chart 4: S&P/ASX 200 and MVW sector weightings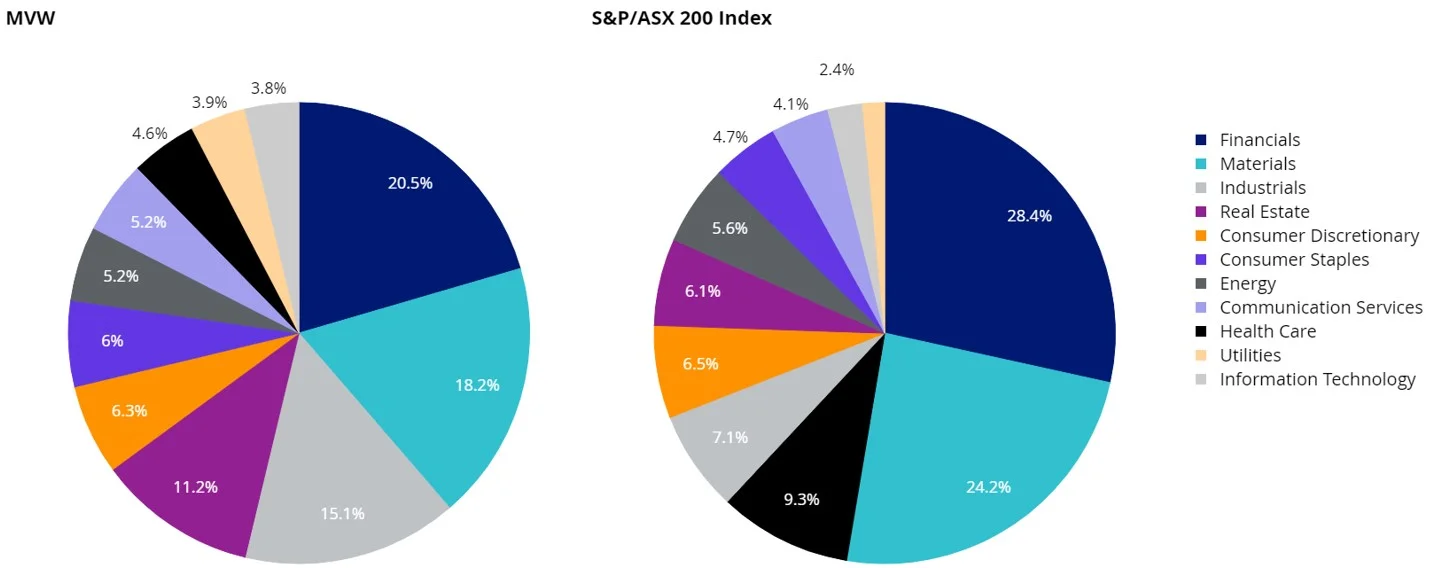
Source: FactSet, 31 July 2023
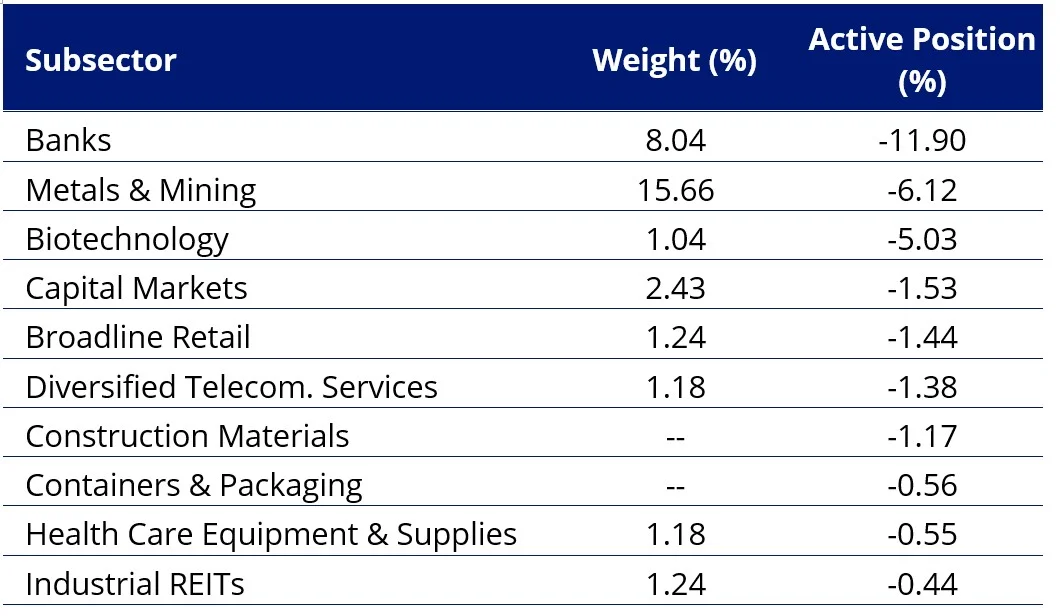
To understand this different diversification better, we have also compared MVW’s GICS sub-sector breakdown to that of the S&P/ASX 200. Its largest underweight positions are in banks (-11.90%), metals and mining, (-6.12%) and biotechnology (-5.03%). MVW is overweight insurance (+3.98%), diversified REITs (+3.98%) and interactive media and services (+2.73%).
| Table 1: MVW’s active underweight sub-sector Top 10 | Table 2: MVW’s active overweight sub-sector Top 10 |
 |
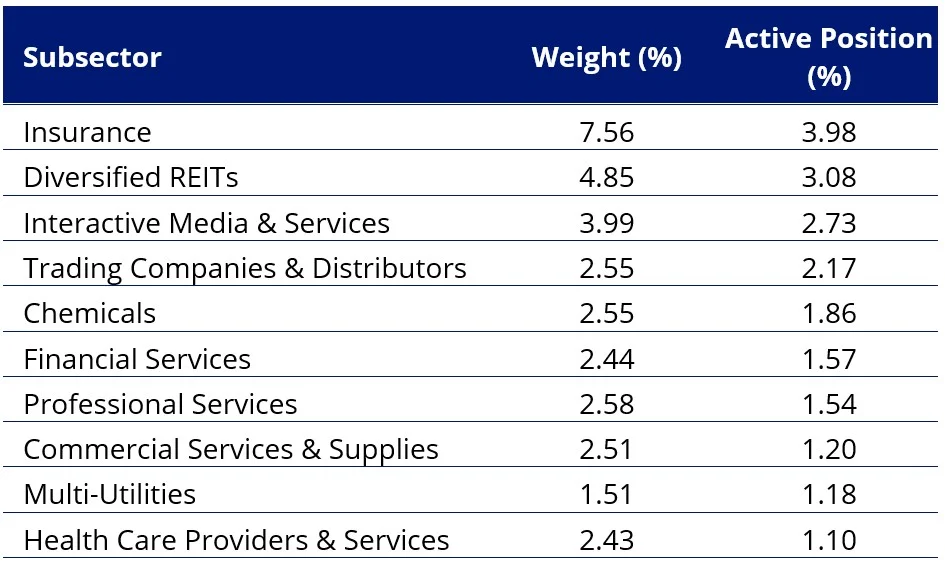 |
Table 1 and 2, source: FactSet, VanEck, S&P. 31 July 2023. Active position is relative to S&P/ASX 200.
Chart 5: Price change post earnings result by sector
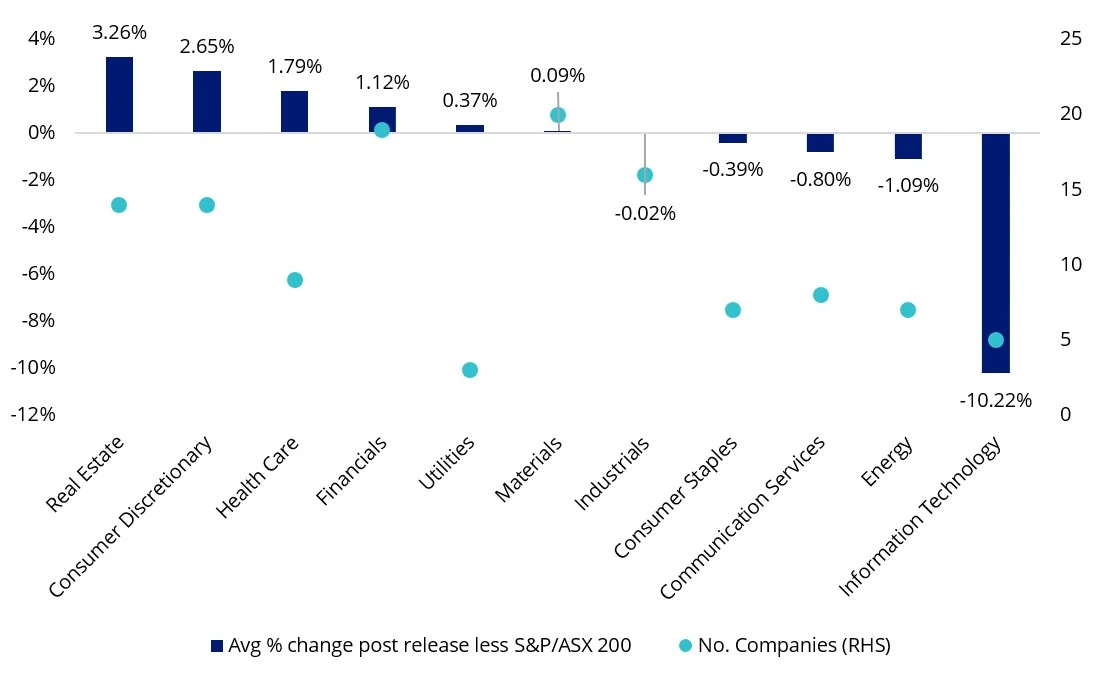
Source: Bloomberg, Index Weighted, as at 25 August 2023. S&P/ASX 200 sector indices.
We believe MVW is well positioned for the likely challenging macroeconomic environment ahead as we approach 2024.
How MVW gets its exposure
The index MVW tracks, equally weights the largest and most liquid stocks on the ASX at each rebalance. Because of this, at last rebalance, no company was more than 1.25%.
If you have MVW as a core Australian equity portfolio and you believe the economic environment will become favourable for banks or if China starts to stimulate more, you can add to your MVW portfolio by buying your preferred bank or resource company directly as a satellite position. Alternatively, you could consider the VanEck Australian Banks ETF or VanEck Australian Resources ETF. In this way, ETFs are efficient tools to express portfolio ideas for the prevailing economic environment.
Irrespective of the stage of the economic cycle, MVW is designed to be a long-term portfolio solution as an alternative to an active manager or an S&P/ASX index tracker. In the current environment it has outperformed the S&P/ASX 200, as evidenced by its recent performance. Over the long term too, MVW has outperformed. Since its inception in 2014, to 24 August 2023, MVW has outperformed the S&P/ASX 200 Index by 176 basis points per annum. As always, past performance is by no means a reliable indicator of future performance.Chart 6: Cumulative performance: MVW versus S&P/ASX 200 Index since inception to 24 August 2023
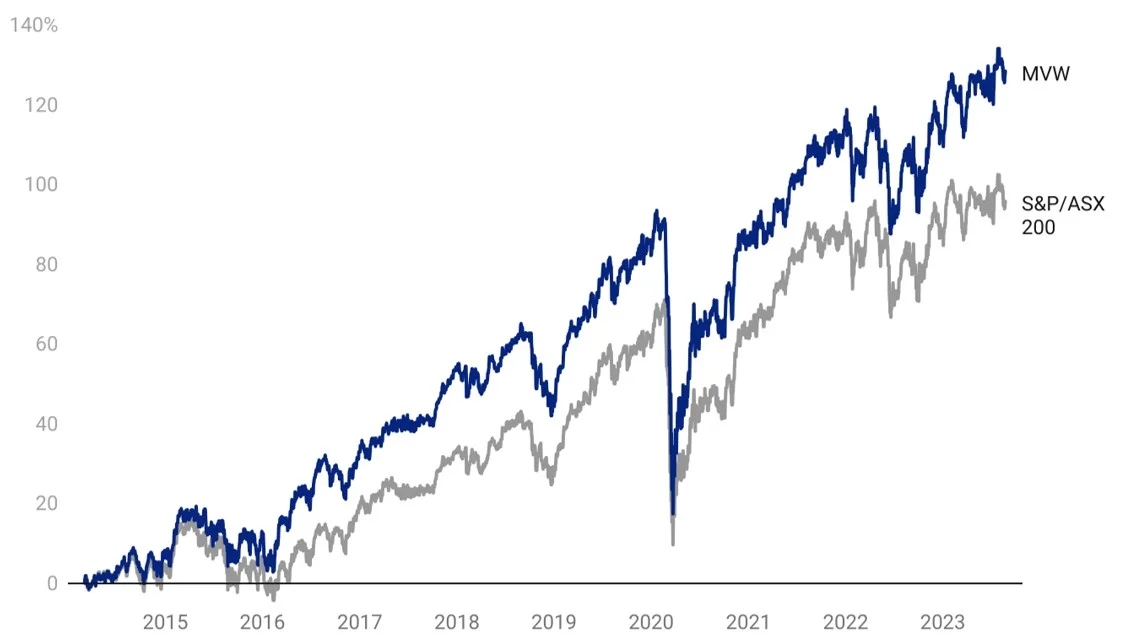
Table 3: MVW Performance to 24 August 2023
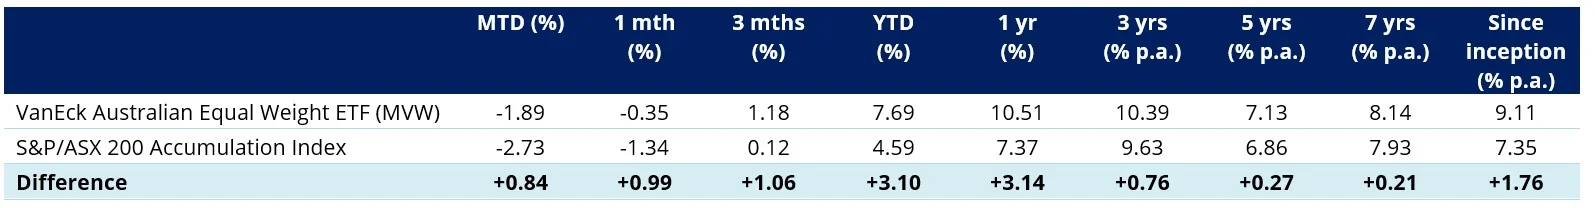
Inception date is 4 March, 2014.
Chart 6 and Table 1: Source: Morningstar Direct, VanEck. Results are calculated daily and assume immediate reinvestment of all dividends. MVW results are net of management fees and other costs incurred in the fund but do not include brokerage costs and buy/sell spreads incurred when investing in MVW. Past performance is not a reliable indicator of future performance. You cannot invest directly in an index. The S&P/ASX 200 Index is shown for comparison purposes as it is the widely recognised benchmark used to measure the performance of the broad Australian equities market. It includes the 200 largest ASX-listed companies, weighted by market capitalisation. MVW’s index measures the performance of the largest and most liquid ASX-listed companies, weighted equally at rebalance. MVW’s index has fewer companies and different industry allocations than the S&P/ASX 200.
Key risks
An investment in the ETF carries risks. These include risks associated with financial markets generally, individual company management, industry sectors, fund operations and tracking an index. See the PDS for details.
1Bloomberg Analyst Coverage as at 25 August 2023.
2For more information on the Herfindahl Index click here


Published: 30 August 2023
IMPORTANT NOTICE
VanEck Investments Limited (ACN 146 596 116 AFSL 416755) (‘VanEck’) is the issuer and responsible entity of all VanEck exchange traded funds (Funds) listed on the ASX. This is general advice only and does not take into account any person’s financial objectives, situation or needs. The product disclosure statement (PDS) and the target market determination (TMD) for all Funds are available at vaneck.com.au. You should consider whether or not any Fund is appropriate for you. Investments in a Fund involve risks associated with financial markets. These risks vary depending on a Fund’s investment objective. Refer to the applicable PDS and TMD for more details on risks. Investment returns and capital are not guaranteed.