The ABC of CBA in portfolios
All eyes were on CBA last week and its results. While the market’s response was positive, we think, for Australian investors’ portfolios, CBA’s dominance could also be cause for caution. It may even be a risk.
The Commonwealth Bank may be one of the most widely held stocks in the country, but in recent months many market analysts have placed sell recommendations on the bank due to concerns about the headwinds it, and the wider banking sector, is facing.
CBA’s full-year results provided some insights into the clouds forming over the Australian banking sector, CEO Matt Comyn saying, “there are signs of downside risks building as rising interest rates have a lagged impact on mortgage customers and other cost of living pressures become a financial strain for more Australians.”
The bank said it’s continuing to manage headwinds after a peak in net interest margins (NIMs) in late 2022. CBA’s key gauge of profitability dipped by five basis points from the first half of the year to 2.07%, while loan impairment expenses rose to $1.5 billion and weighed on profits. CBA expects competition, customer deposit switching and higher wholesale funding costs to remain headwinds to margins. The lender also lifted its loan impairment expenses, citing in part the ongoing cost of living pressures facing consumers, though the bank said this will be partly offset by the benefit of higher interest rates.
CBA’s share price rose almost 2.6% last Wednesday after it announced its results. However, not everyone is convinced CBA will be able to successfully navigate the headwinds it is facing because of 13 interest rate rises and the increasing financial strain many consumers are under. You can see from the chart below that a whopping 76% of analysts now have a “sell” rating on CBA with none recommending it as a “buy.”
Chart 1: CBA broker split (17 analysts)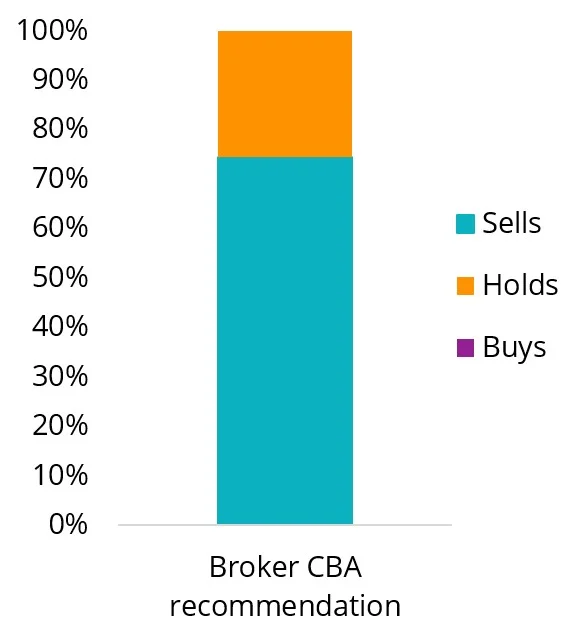
Source: Bloomberg, 9 August 2023
As an example of analysts' concerns, in a note following CBA’s 2023 full-year results, investment bank Goldman Sachs said, “Overall we reiterate our Sell rating, given: i) CBA’s consumer banking skew leaves its earnings more exposed to sector wide headwinds, including intense mortgage and deposit competition, and adverse impacts from households experiencing elevated interest burdens from higher interest rates, and ii) while CBA has historically done a good job in balancing investment and productivity, we do not think it can escape elevated FY24E cost pressures given heightened inflation. Therefore, given we expect underlying PPOP to cumulatively fall by 6% over FY24/25E, and not recover to FY23 levels until FY28E, we struggle to justify the 58% 12-month forward PPOP premium it is currently trading on versus peers (ex-dividend adjusted), compared to the 28% historical 15-year average.”
Table 1: Goldman Sachs changing forecast for CBA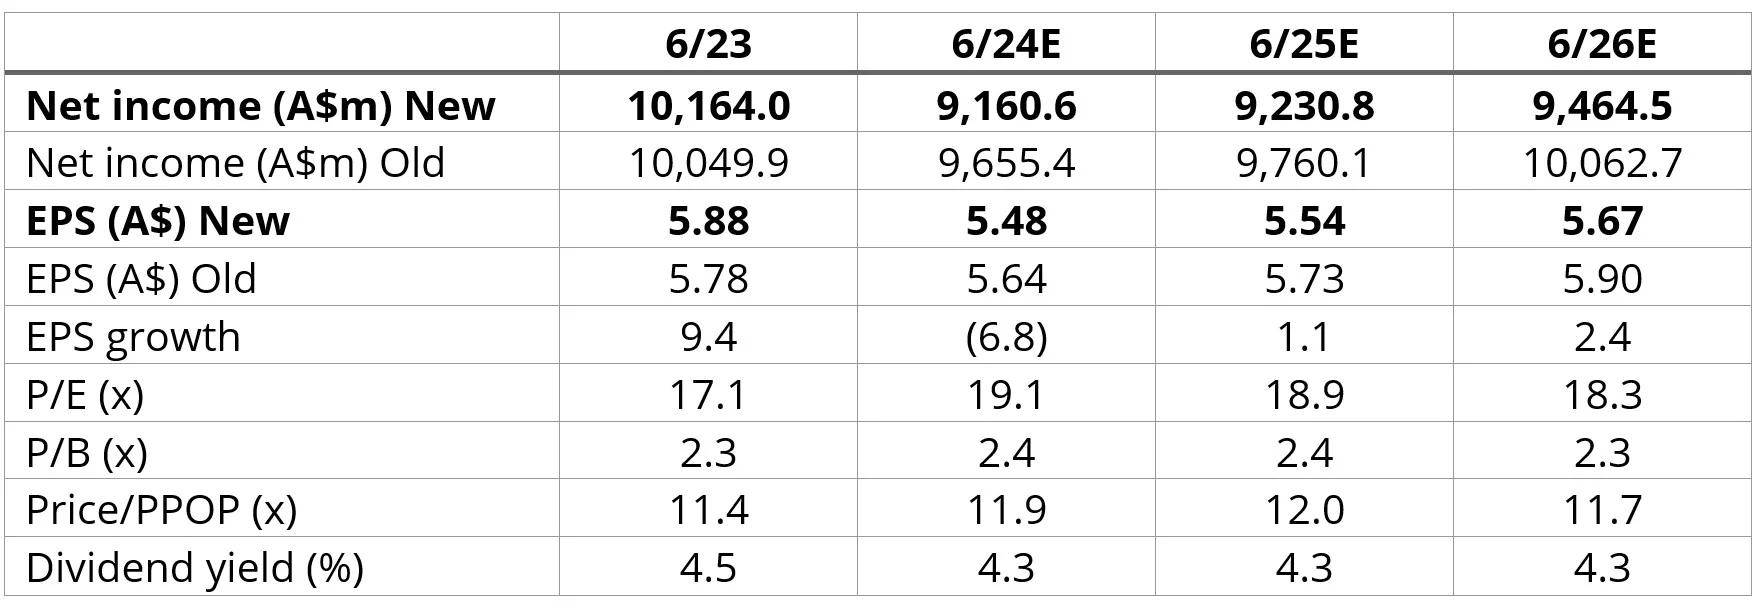
Source: Goldman Sachs
Investment Bank Citi also currently has a sell rating on the bank, saying; “lending volume growth is set to slow down as rates rise. With RBA tightening cycle, revenue growth is set to swing to deposits derived (vs lending derived) as NIMs expand from cash rate hikes. However, there are multiple headwinds, which partially offset the cash-hike benefit: intense mortgage competition, higher funding costs, and customers switching to term deposits (from low cost transaction and high interest accounts). Furthermore, we see CBA’s current stock price as expensive versus its core revenue and earnings outlook.”
Many of these headwinds are not unique to CBA, but the Australian banking sector. We are not saying sell or short banks such as CBA, they are an important sector in the Australian economy. What we would always caution is, it is a risk to have your portfolio too overexposed to them. Many investors seek diversification to spread risks.
Unfortunately, many investors may not even realise they are overexposed to the Australian banking sector.
Most Australian equity portfolios, passive and active, are linked to the S&P/ASX 200 Index and these are likely to have a significant exposure to banks. A purely passive exposure sits at around 20%.
The reason banks dominate Australian portfolios is because of their size. The S&P/ASX 200 is a market capitalisation index. A market capitalisation index uses the size of a company for inclusion and its representation in that index relates to its size. Therefore, in a market capitalisation index, the larger companies have bigger weights. This means Australian portfolios linked to this index currently have significant exposure to the big banks.
At a sector level, financials, of which the banks make up the lion's share, and materials dominate the S&P/ASX 200, accounting for more than 50% of the index. Such a sizable allocation makes sense if you are more confident in the future growth prospects of those sectors, but even then, it may not be prudent risk management. Additionally, you may be forgoing growth in other sectors.
Investors may seek growth opportunities in sectors that have potential for earnings per share (EPS) growth such as IT, utilities, communication and consumer sectors. You can see that it is estimated that the EPS of materials and financials are not expected to grow as they have been for the past three years.
This means if you are invested in a fund that tracks the S&P/ASX 200 index you could be missing out on opportunities elsewhere in the Australian economy.
Table 2: Earnings per share for different sectors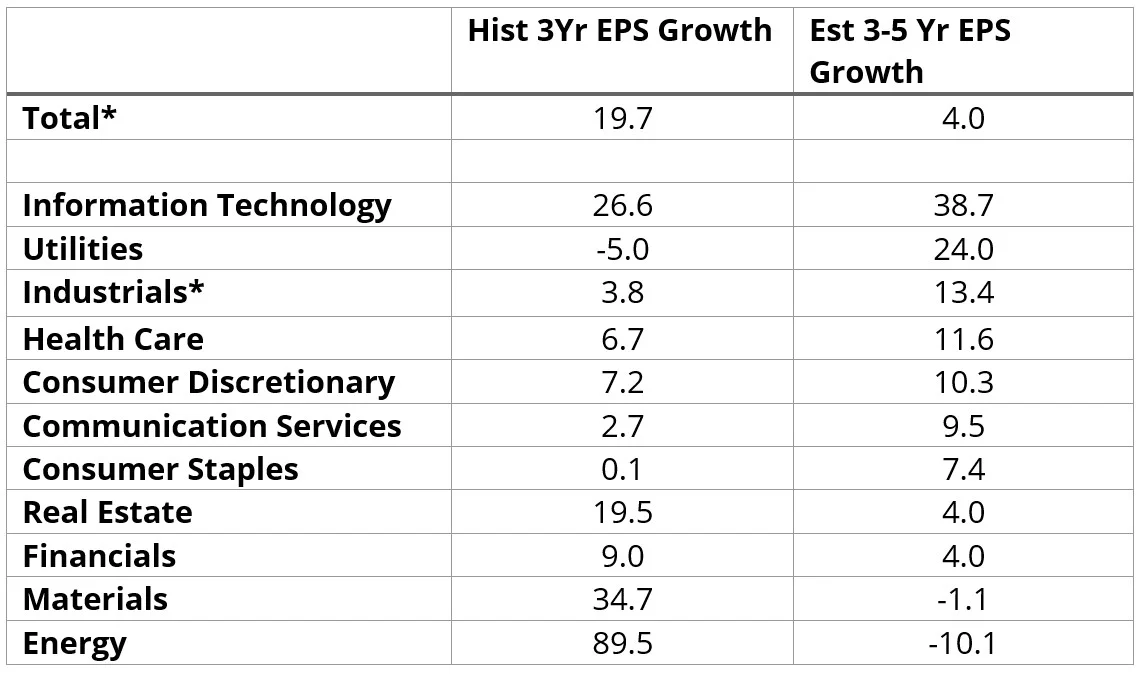
Source: Factset. *Please note for the industrials sector significant outlier Qantas (-217% Estimated 3Yr EPS Growth) has been removed from the calculation.
So how do you improve diversification when investing in a highly concentrated equity market such as Australia’s?
There is a passive approach that results in a broader allocation to all the sectors of the Australian economy: Equal weighting.
The equal weight index that the VanEck Australian Equal Weight ETF (MVW) tracks is a smart beta index that equally weights the largest and most liquid stocks on the ASX at each rebalance. Because of this, at the last rebalance, no company was more than 1.25%. MVW’s exposure to the big four banks at that time was only 5% (as at 31 July 2023 it was 5.38%).
MVW vs S&P/ASX 200 Index – Sectors
MVW is currently underweight in the financials sector by 7.9% compared to the S&P/ASX 200. It is underweight the materials sector by 6.0%. Conversely, it is overweight industrials, information technology, utilities, communication services and the consumer sectors.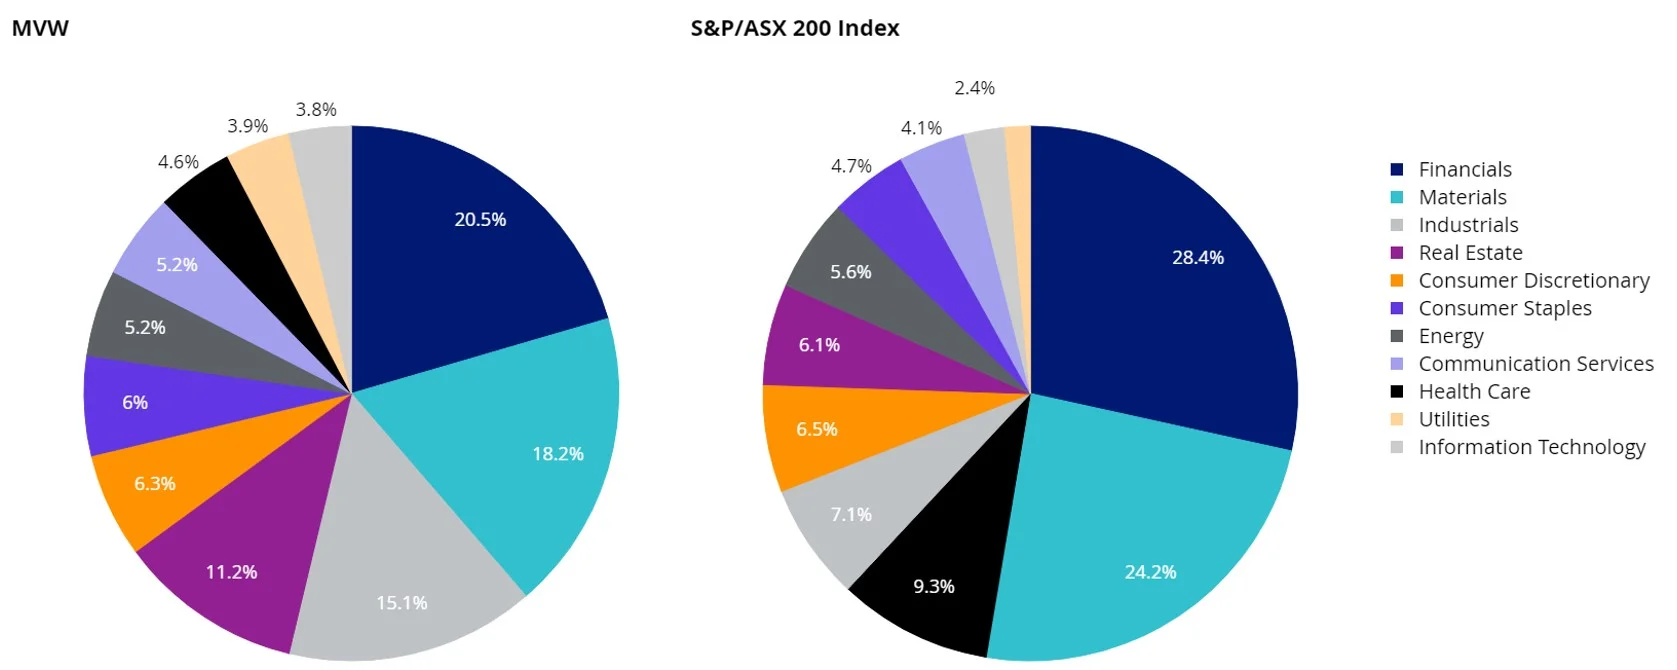
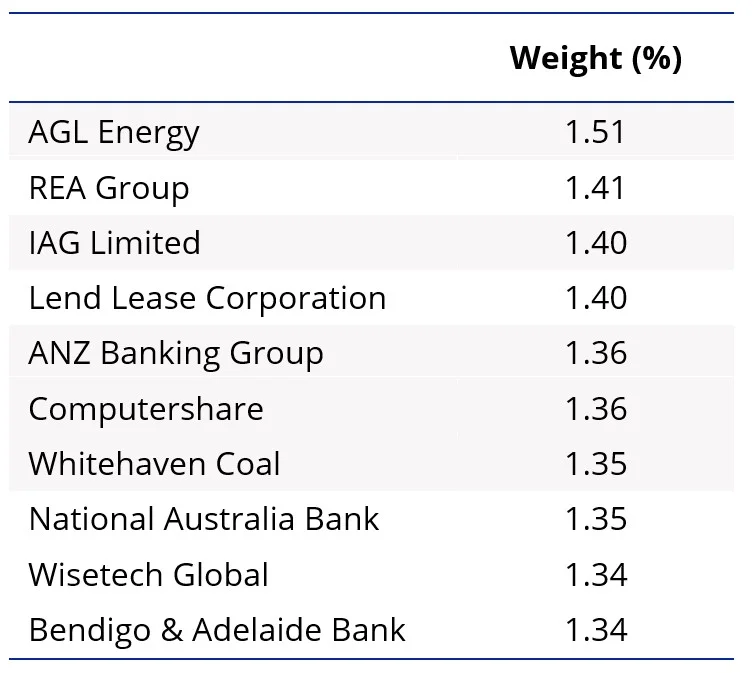
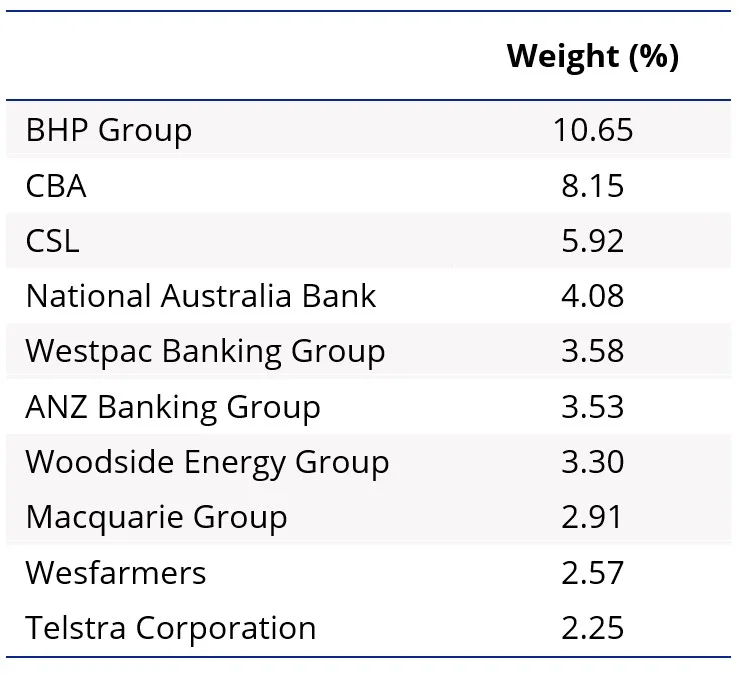
MVW vs S&P/ASX 200 Index - Top 10 holdings
Below you can see the top 10 companies. The differences are stark. Nearly half of the 200-company portfolio is in just 10 companies in the S&P/ASX 200. That means the other 190 companies squeeze into the remaining 50%. MVW’s top ten, total just 13.82%, the remaining 86.18% includes 70 companies all roughly equally weighted. The reason MVW’s holdings are not equal below is that it only rebalances back to equal weight each quarter. To see all the holdings in MVW and their weightings click here.
|
Table 3: Top 10 holdings MVW |
Table 4: Top 10 S&P/ASX 200 |
 |
 |
|
Source: FactSet, VanEck, as at 31 July 2023 |
Source: FactSet, VanEck, S&P, as at 31 July 2023 |
MVW vs S&P/ASX 200 - Diversification
A way to measure the diversification of a portfolio is to calculate its Herfindahl Index. This index is a broadly used technique to quantify concentration. When used inversely, this index measures diversification. As at the last rebalance in June 2023, the Herfindahl Index for the S&P/ASX 200 was 304.5. The equivalent measure for the index MVW tracks was 125.0. The MVW Index is therefore nearly 2.5 times less concentrated than the S&P/ASX 200. In other words, the MVW Index is roughly two and a half times more diversified than the S&P/ASX 200.
Most investors are familiar with the concept of diversification. We know that if we put all our eggs in one basket our returns will experience high volatility, but if we spread our investments across several different assets we’ll reduce the volatility of returns.
Reporting seasons can often act as triggers for investors to consider their portfolios, and CBA’s recent presentation could prompt many to consider their approach and concentration in Australian equities.
To achieve a broader exposure to the Australian economy, than the market capitalisation index, MVW is being used by savvy investors as their core Australian equity portfolio. Around MVW, investors can add investment ideas. For example, should the economic environment become more favourable for banks, you can add to MVW by buying your preferred bank directly, as a satellite position. Alternatively, you could consider the VanEck Australian Banks ETF.
Diversification is such a key component of share investing that the Cambridge Dictionary even refers to the stock market in its definition of ‘diversify’: People are advised to diversify their investments in the stock market to reduce risk. We agree.
Key risks
An investment MVW carries risks associated with: ASX trading time differences, financial markets generally, individual company management, industry sectors, country or sector concentration, political, regulatory and tax risks, fund operations and tracking an index. See the PDS for details.


Published: 13 August 2023
Any views expressed are opinions of the author at the time of writing and is not a recommendation to act.
VanEck Investments Limited (ACN 146 596 116 AFSL 416755) (‘VanEck’) is the issuer and responsible entity of all VanEck exchange trades funds (Funds) listed on the ASX. This is general advice only and does not take into account any person’s financial objectives, situation or needs. The product disclosure statement (PDS) and the target market determination (TMD) for all Funds are available at vaneck.com.au. You should consider whether or not an investment in any Fund is appropriate for you. Investments in a Fund involve risks associated with financial markets. These risks vary depending on a Fund’s investment objective. Refer to the applicable PDS and TMD for more details on risks. Investment returns and capital are not guaranteed.
MVIS Australia Equal Weight Index (‘MVIS Index’) is the exclusive property of MV Index Solutions GmbH based in Frankfurt, Germany (‘MVIS’). MVIS is a related entity of VanEck. MVIS makes no representation regarding the advisability of investing in the Fund. MVIS has contracted with Solactive AG to maintain and calculate the MVIS Index. Solactive uses its best efforts to ensure that the MVIS Index is calculated correctly. Irrespective of its obligations towards MVIS, Solactive has no obligation to point out errors in the MVIS Index to third parties.