Experts choice: Australian banks and the property market
Australian banks face a headwind, the declining property market. Because of their exposure to the residential property market via mortgages, this puts pressure on Australian banks, and by proxy Australian equity portfolios linked to Australia’s benchmark index, S&P/ASX 200. Why? Because banks make up almost one in five dollars invested in funds linked to that index.
A Chanticleer column in last week’s AFR, “Is it time to short Aussie banks? One Wall St guru says yes” presented contrasting views on Australian banks:
-
- One paints a grim outlook highlighting the property market,
- The other is that banks may be entering a period of margin expansion as rates rise.
There is no doubt that Australian banks face a period of uncertainty in the face of a declining property market. But despite rate rises this year, an analysis of RBA data shows that, Australian Banks’ Net Interest Margins (NIMS) have been contracting. These do not bode well for bank shares.
While we are not saying sell or short banks, we are saying that it is a risk to have your portfolio overexposed to them. There is a different, broad Australian equity approach that maintains bank exposure but provides greater stock and sector diversification. And recently it has been outperforming the Australian broad based benchmark, S&P/ASX 200 Index.
Analysts at Bank of America, who the Chanticleer cited in its short Aussie banks article, are not the only ones predicting pressure on Australia’s property market. Each investment bank and brokerage house has a view.
Consistent themes across many reports are:
- Home prices are expected to continue to fall in Australia,
- Any downturn in housing possesses downside risk to the Australian economy, and
- Central banks, including the RBA, are unlikely to pivot from their current hiking cycle because of weaker housing markets.
For years Australian banks have been able to grow their mortgage books as new home buyers looked to take advantage of record low rates. It now looks as though growth in new mortgages will slow. In addition, a fall in property prices is likely to put pressure on non-performing loans.
Most Australian portfolios linked to the S&P/ASX 200 Index are likely to have an exposure to banks around 18% because of their size.
The reason the S&P/ASX 200 Index has such as large allocation to Australian banks is because it is a market capitalisation index. A market capitalisation index uses the size of a company for inclusion and its representation in that index relates to its size. Therefore, in a market capitalisation index, the larger companies have bigger weights. This means Australian portfolios linked to this index have significant exposure to big banks.
A sizeable allocation makes sense if you are confident the sector will do well, but if you are not, it may not be prudent risk management.
The equal weight index that the VanEck Australian Equal Weight ETF (MVW) tracks is a smart beta index that equally weights the largest and most liquid stocks on the ASX at each rebalance. Because of this, at last rebalance, no company was more than 1.17%. MVW’s exposure to the big four banks at that time was only 4.68% (as at 31 August 2022 it was 4.69%).
Taking an equally weighted approach has been proven to produce outperformance over the long-term compared to a benchmark market capitalisation approach as well as providing diversification benefits.
So, let’s walk through the difference between MVW and the S&P/ASX 200.
MVW vs S&P/ASX 200 - Performance
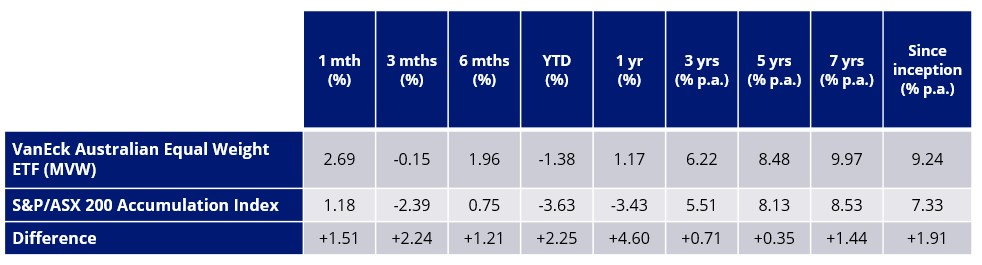
Equal weight investing has served Australian investors. At the end of August 2022, since its inception on ASX in 2014, MVW has outperformed the S&P/ASX 200 by 1.91% p.a.
Chart 1: Cumulative performance since MVW inception date to 31 August 2022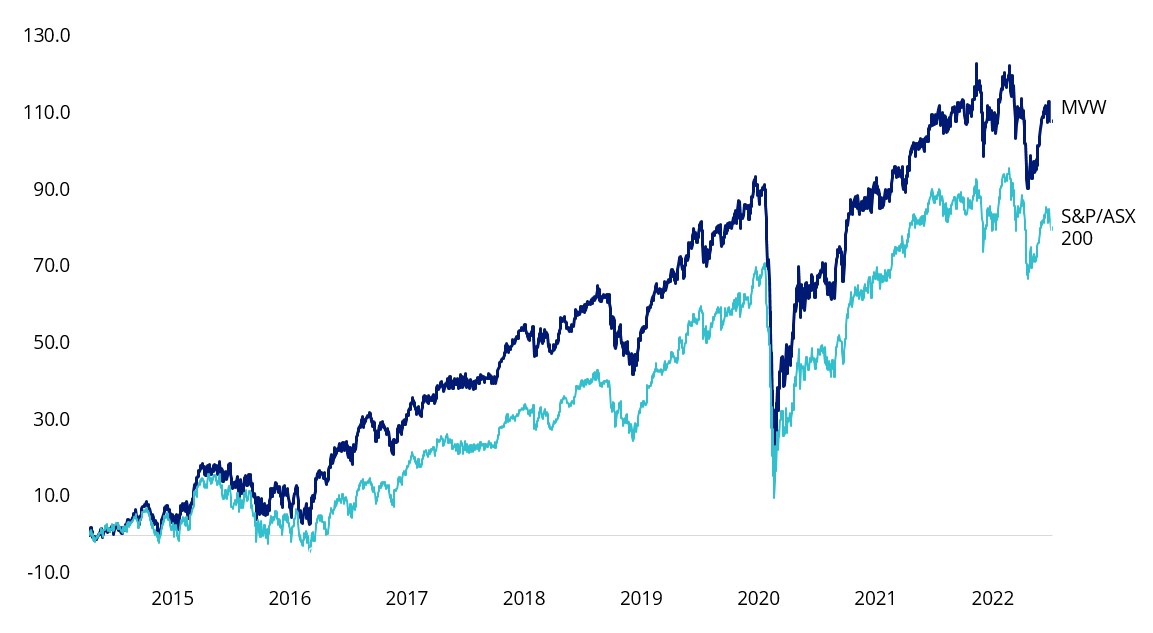
Table 1: Trailing performance to 31 August 2022
* MVW Inception date is 4 March 2014 a copy of the factsheet is here.
Chart 1 and Table 1 source: Morningstar Direct, VanEck as at 31 August 2022. The chart and table above show past performance of MVW and of the S&P/ASX 200. You cannot invest directly in an index. Results are calculated to the last business day of the month and assume immediate reinvestment of distributions. MVW results are net of management fees and other costs incurred in the fund, but before brokerage fees and bid/ask spreads incurred when investors buy/sell on the ASX. Returns for periods longer than one year are annualised. Past performance is not a reliable indicator of future performance. The S&P/ASX 200 Index is shown for comparison purposes as it is the widely recognised benchmark used to measure the performance of the broad Australian equities market. It includes the 200 largest ASX-listed companies, weighted by market capitalisation. MVW’s index measures the performance of the largest and most liquid ASX-listed companies, weighted equally at rebalance. MVW’s index has fewer companies and different industry allocations than the S&P/ASX 200. Click here for more details.
MVW vs S&P/ASX 200 - Diversification
A way to measure diversification of a portfolio is to calculate its Herfindahl Index. This index is a broadly used technique to quantify concentration. When used inversely, this index measures diversification. As at the last rebalance in June 2022, the Herfindahl Index for the S&P/ASX 200 was 338. The equivalent measure for the index MVW tracks was 114. The MVW Index is therefore around a third as concentrated as the S&P/ASX 200. In other words, the MVW Index is roughly three times more diversified than the S&P/ASX 200.
MVW vs S&P/ASX 200 Index - Top 10 holdings
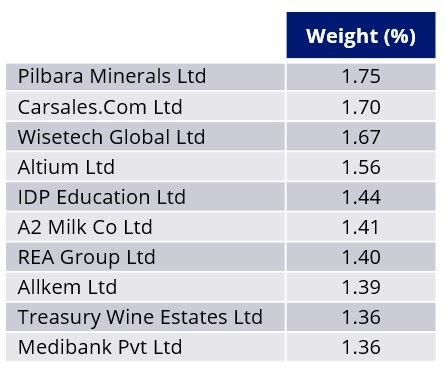
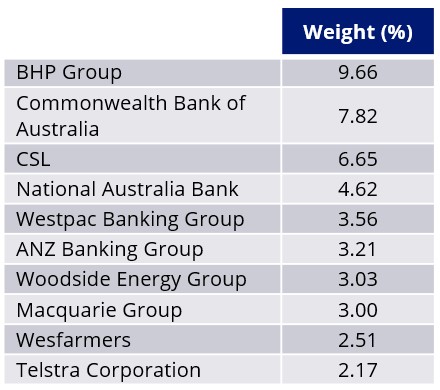
Below you can see the top 10 companies. The differences are stark – to see all the holdings in MVW and their weightings click here.
|
Table 2: Top 10 holdings MVW |
Table 3: Top 10 S&P/ASX 200 |
Source: Left - FactSet, VanEck, as at 31 August 2022. Right - FactSet, VanEck, S&P, as at 31 August 2022.
The reason MVW’s holdings are not equal above is that it only rebalances back to equal weight each quarter. Noticeably Pilbara Minerals is now 1.75% of MVW. At June’s rebalance, it was 1.17%, like every other holding, but due to strong lithium prices its share price has gone up so it makes up a bigger part of MVW now. At the next quarterly rebalance, it will be pared and the portfolio holding will be equal.
MVW vs S&P/ASX 200 Index - Sectors
MVW is currently underweight the financials’ sector by 9.56% compared to the S&P/ASX 200. Conversely, it is overweight industrials by 5.49% and information technology by 2.40%.
Chart 2: S&P/ASX 200 and MVW Index company weightings
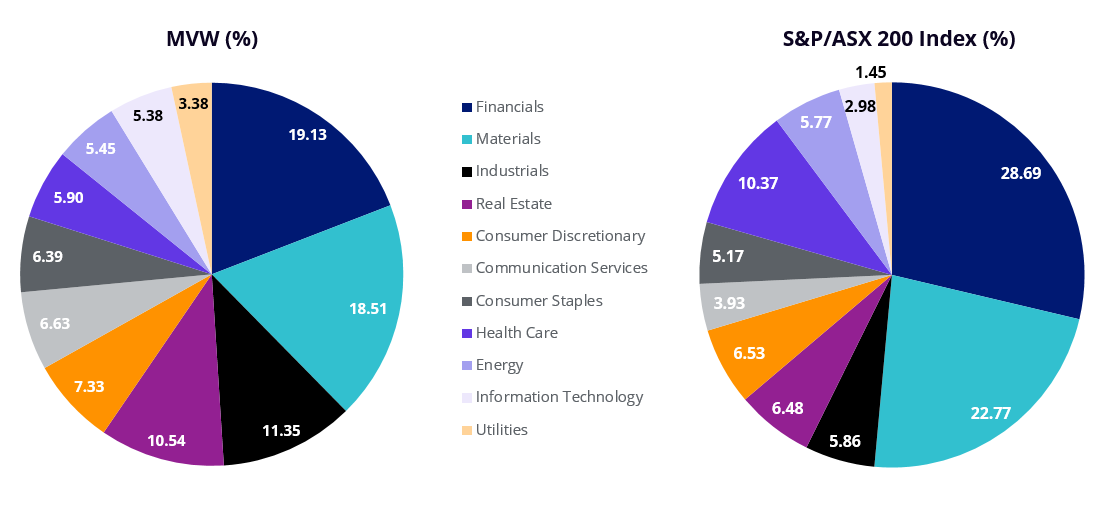
Source: FactSet, 31 August 2022
What this means is that if there is another systematic banking issue, or commodities fall the impact on the S&P/ASX 200 is greater than in the MVW Index.
MVW vs S&P/ASX 200 Index - Style
When looking at portfolios it is important to determine what style e.g. value or growth and what size bias a portfolio holds e.g. giant, large, mid or small. Below we can see MVW’s. Importantly MVW holds large companies with a similar Morningstar style of core orientation relative to the S&P/ASX 200, which skews larger (giant) and more toward value.
|
Chart 3: MVW holdings based style map |
Chart 4:S&P/ASX 200 holdings based style map |
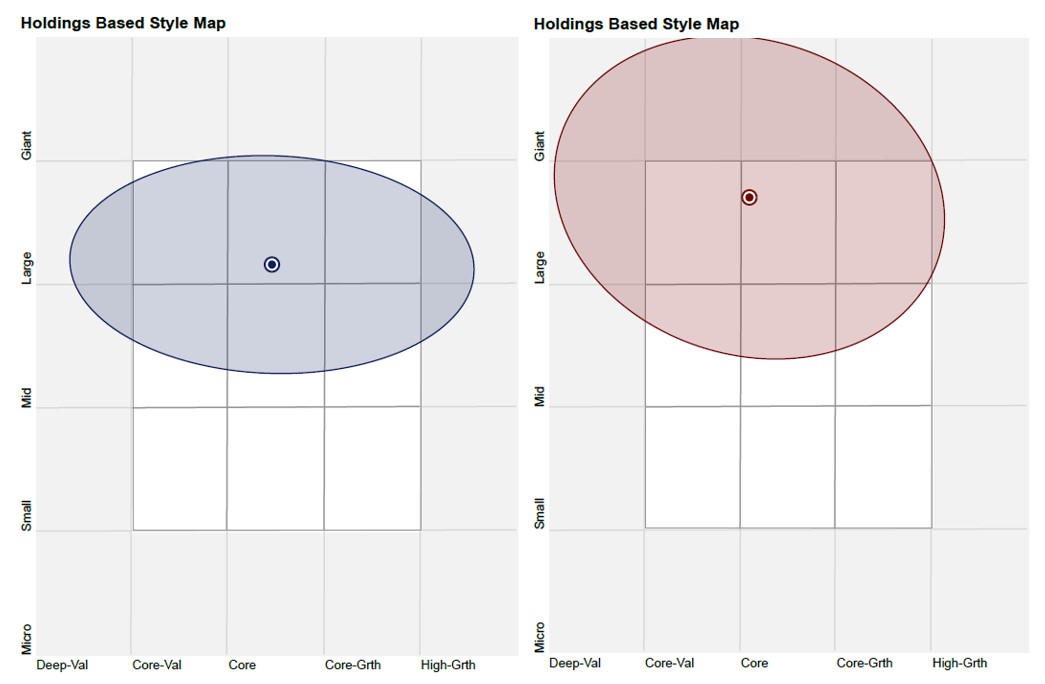
Source: Morningstar Direct, as at 31 August 2022
MVW is being used by savvy investors as their core Australian equity portfolio, around which they add investment ideas. For example, should the economic environment become more favourable for banks, you can add to MVW by buying your preferred bank directly, as a satellite position. Alternatively, you could consider the VanEck Australian Banks ETF.
While each Australian equity approach, equal weight and market capitalisation, has its merit for portfolio inclusion, you should assess all the risks and consider your investment objectives.
Past performance is no guarantee of future performance. The above is not a recommendation. Please speak to your financial adviser or stock broker.
For further information you can email us or call on us on +61 2 8038 3300.
Key risks
An investment MVW carries risks associated with: ASX trading time differences, financial markets generally, individual company management, industry sectors, country or sector concentration, political, regulatory and tax risks, fund operations and tracking an index. See the PDS for details.


Published: 09 September 2022
Any views expressed are opinions of the author at the time of writing and is not a recommendation to act.
VanEck Investments Limited (ACN 146 596 116 AFSL 416755) (‘VanEck’) is the issuer and responsible entity of all VanEck exchange trades funds (Funds) listed on the ASX. This is general advice only and does not take into account any person’s financial objectives, situation or needs. The product disclosure statement (PDS) and the target market determination (TMD) for all Funds are available at vaneck.com.au. You should consider whether or not an investment in any Fund is appropriate for you. Investments in a Fund involve risks associated with financial markets. These risks vary depending on a Fund’s investment objective. Refer to the applicable PDS and TMD for more details on risks. Investment returns and capital are not guaranteed.
MVIS Australia Equal Weight Index (‘MVIS Index’) is the exclusive property of MV Index Solutions GmbH based in Frankfurt, Germany (‘MVIS’). MVIS is a related entity of VanEck. MVIS makes no representation regarding the advisability of investing in the Fund. MVIS has contracted with Solactive AG to maintain and calculate the MVIS Index. Solactive uses its best efforts to ensure that the MVIS Index is calculated correctly. Irrespective of its obligations towards MVIS, Solactive has no obligation to point out errors in the MVIS Index to third parties.