Earnings season shakes up the ASX
The August earnings season was one of the most volatile in ASX’s recent history, with one in five ASX 200 companies moving more than 10% post results. Despite this, the S&P/ASX 200 gained 3.1% this August. In aggregate, most companies (62%) reported results in-line with expectations, and beats (22%) slightly outpaced misses (16%).
For Australia’s largest names, simply meeting expectations seemed insufficient. Commonwealth Bank (ASX: CBA) dropped 4.8% post earnings as concerns over margin compression and stretched valuations loomed large. JB Hi-Fi (ASX: JBH) also fell 8.4% after earnings as executive management changes overshadowed otherwise decent results.
Several companies, including CSL Ltd (ASX: CSL), attributed their earnings misses to low productivity, which the Australian government addressed at its recent Economic Forum Roundtable.
On a market weighted basis, mid-caps, as represented by the S&P/ASX Midcap 50 Index, delivered solid results, with a net beat rate of 2.9% versus the S&P/ASX 200 Index’s 1.2%. These companies benefited from macro tailwinds including falling interest rates, resilient retail sales and improving growth. They also benefited from higher consensus 12-month price target revisions.
By sector, consumer discretionary was among the best performers, reporting a 55% net beat rate (S&P/ASX 200 Index had a net beat rate of 5%) and a positive average one-day price reaction of 1.6%. Healthcare was the worst performing, with a net beat rate of only 1% and a negative average one-day price reaction of -8.3%.
Chart 1: Average one day price reaction post earnings release
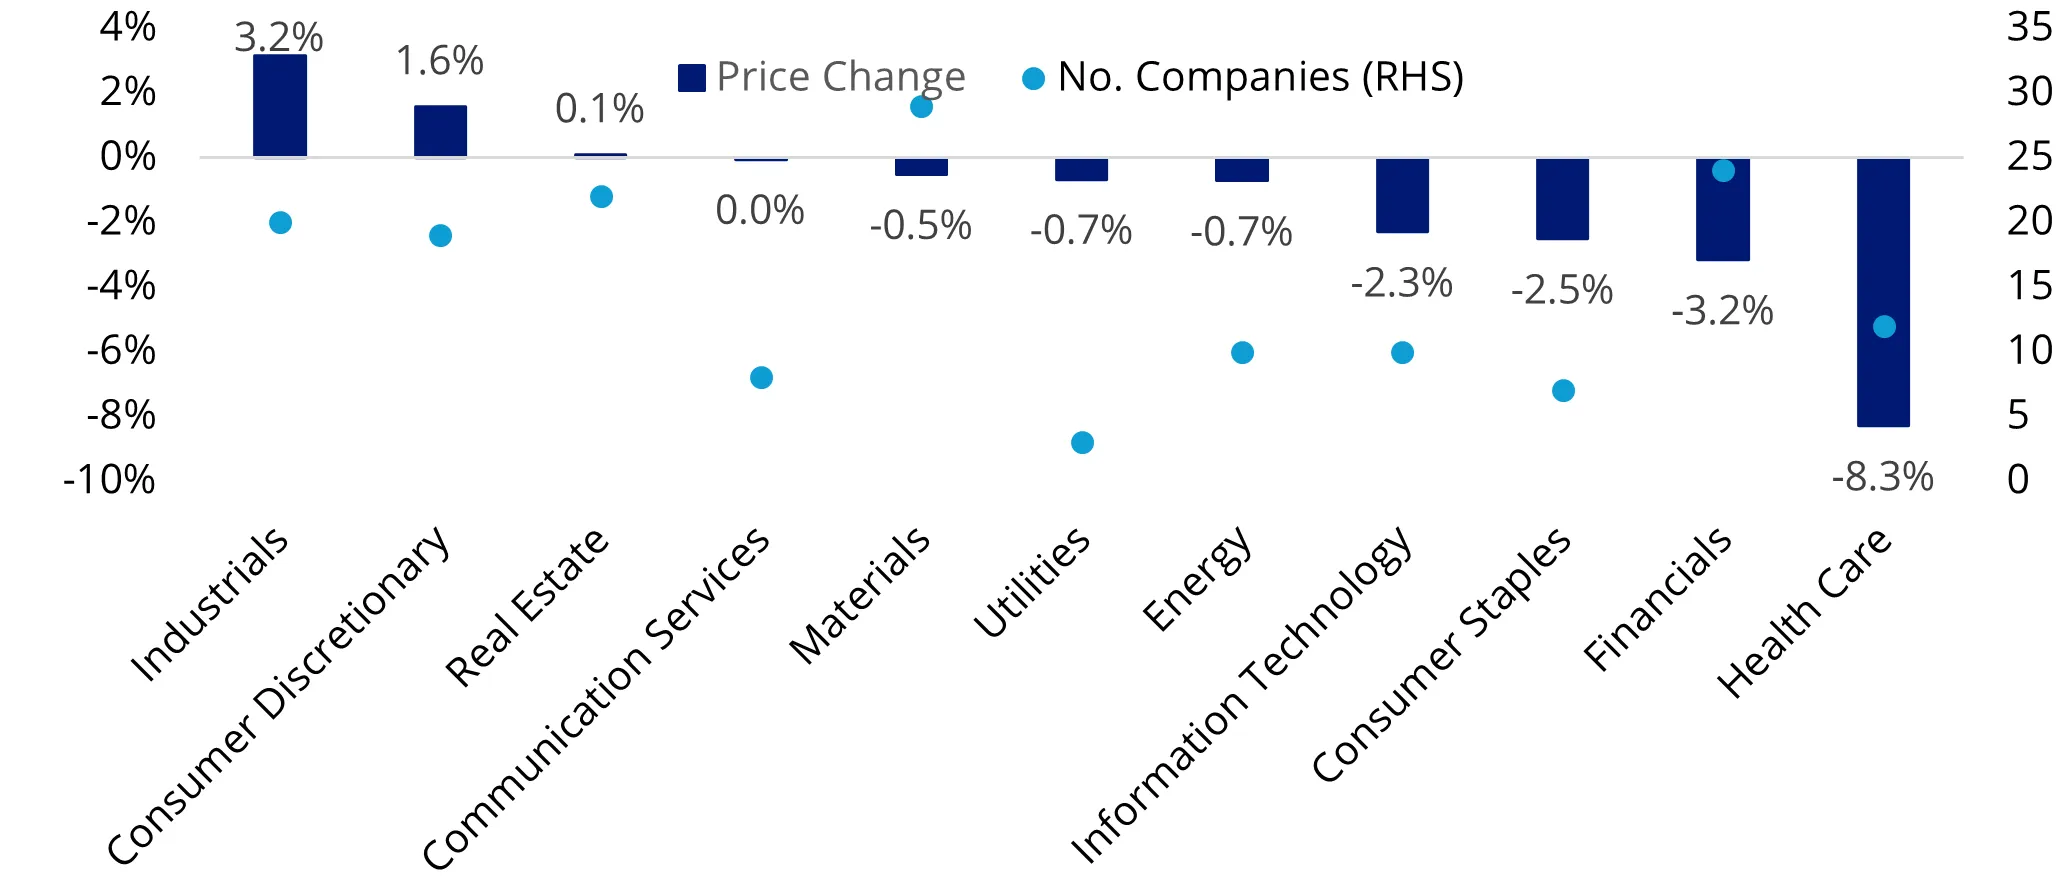
Source: VanEck, Bloomberg. S&P/ASX sector indices. Data as at 29 August 2025, performance in AUD.
Sector highlight: Healthcare under pressure, but some segments in fine form
Healthcare continued its year-to-date trajectory of underperformance, falling 13.21% in August. US tariff uncertainty and subdued industry growth contributed to this weakness.
Healthcare heavyweight CSL Ltd (ASX: CSL) fell 17% post-earnings due to weakness in its core business line(revenue undershot expectations by 4-7%) and a softer near-term outlook driven by productivity concerns. Ramsay Health Care (ASX: RHC) and Healius Ltd (ASX:HLS) dropped more than 10% after reporting margin pressures from increased wages and insurance costs, as well as softer revenue outlooks driven by tariff-related uncertainty across the sector.
However, there were green shoots. Among smaller names that reported positive earnings growth. For example, Ansell Ltd (ASX: ANN) rallied 10.3% post-earnings as investors rewarded solid sales and margin growth after integrating KBU (formerly Kimberly-Clark’s Personal Protective Equipment business).
Sector highlight: Retail surprised to the upside
The consumer discretionary sector has benefited from an improved growth outlook, easing rates and resilient consumer spending, gaining almost 19% year-to-date, as of 31 August 2025.
Continuing on from the broader earnings theme, several consumer discretionary stocks that beat/met expectations saw large drawdowns on weak margin guidance and/or negative headlines, such as Guzman y Gomez Ltd (ASX: GTG), which slumped -18%. Smaller names with a clear growth story, meanwhile, rallied. Super Retail Group Ltd (ASX: SUL) gained around 12% post earnings off the back of record sales and store expansion.
Mid-caps and small caps still have an edge
Over the course of this earnings season (31 July to 31 August 2025), mid-caps (5.5%) and small caps (8.4%) have delivered strong outperformance against large caps (2.1%) and the broader S&P/ASX 200 Index (3.1%). A major driver was the higher consensus price target revisions from sell-side analysts for the next 12 months.
Chart 2: 12-month price target revisions
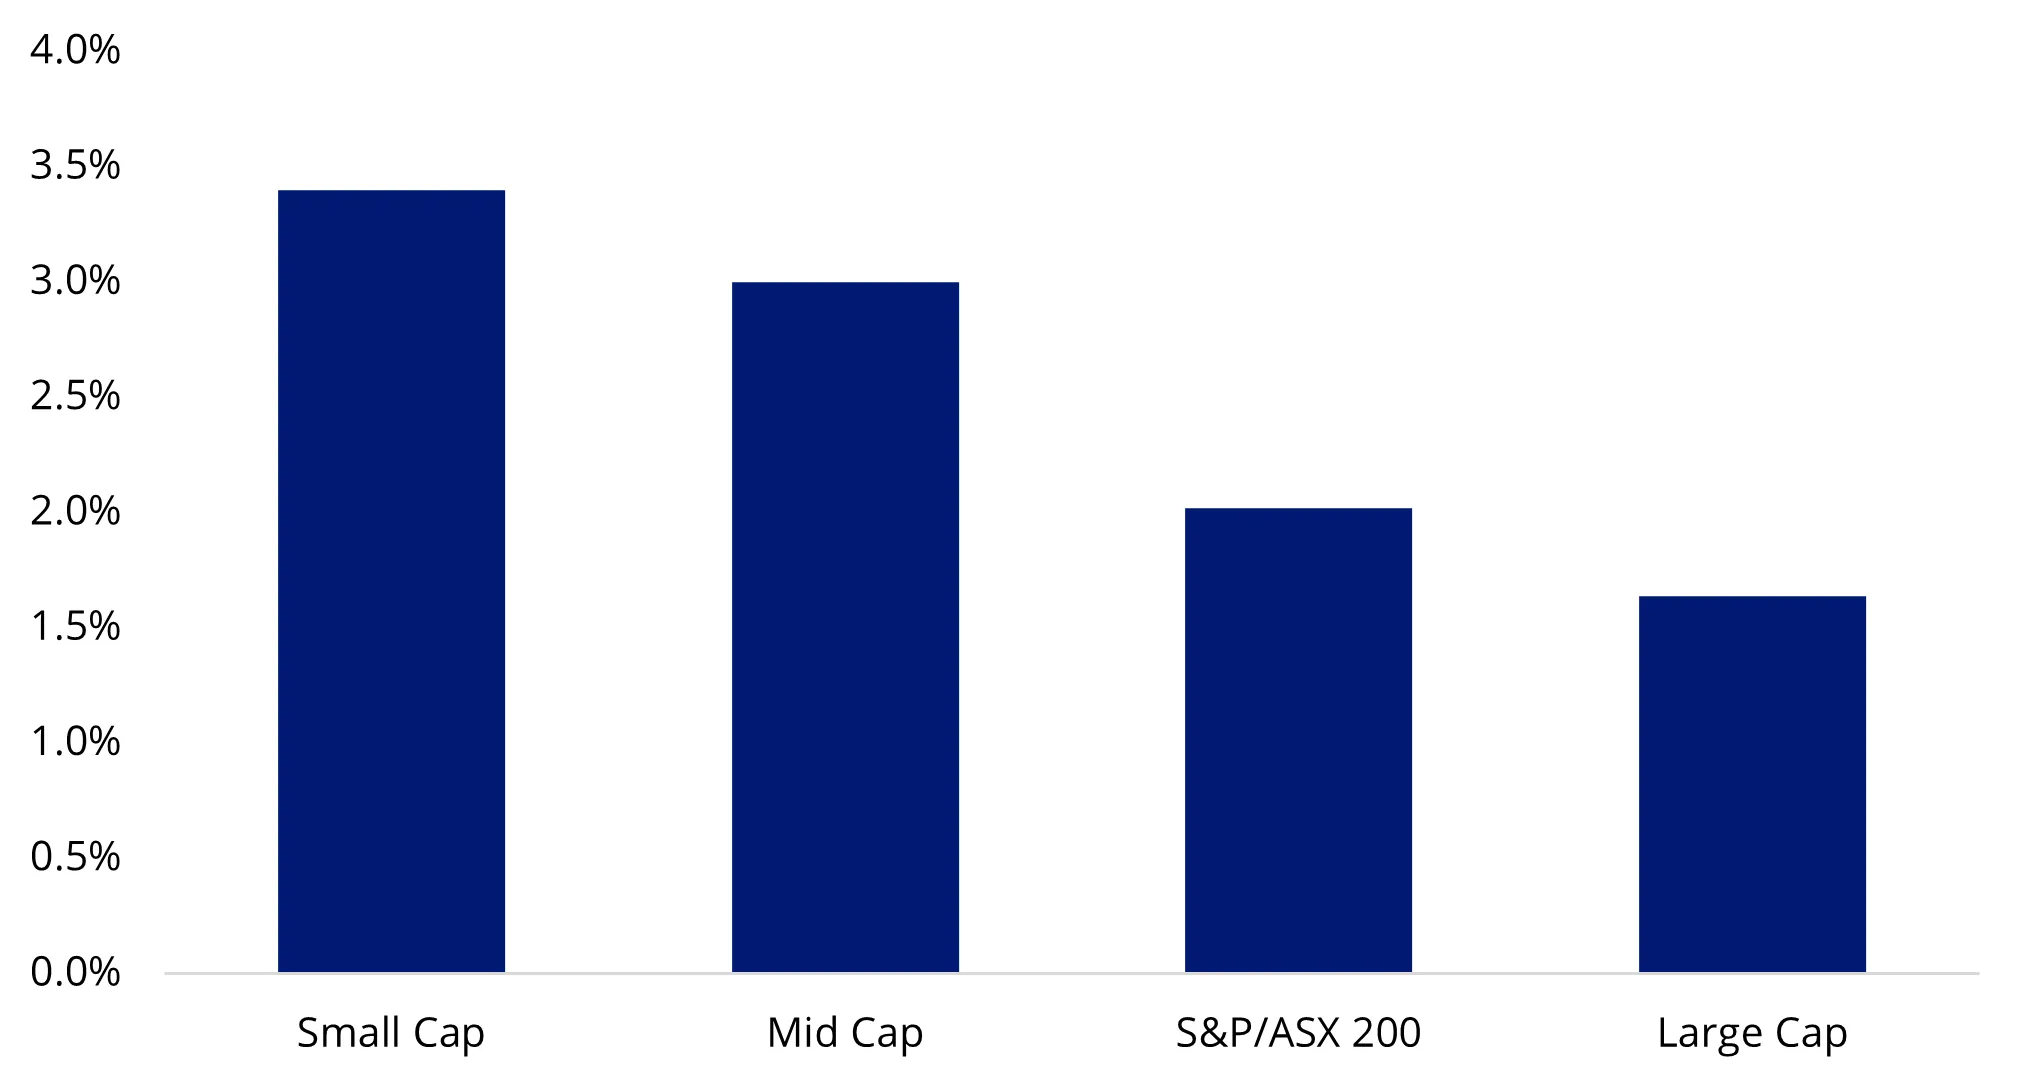
Source: VanEck. Bloomberg. Data as at 31 August 2025. Large cap is S&P/ASX 20 Index. Mid cap is S&P/ASX Midcap 50 Index. Small cap is S&P/ASX Small Ordinaries Index. Price targets are not guaranteed and subject to change without notice.
Looking ahead, we remain constructive on the prospects for Australia’s mid- to small-cap stocks. Continued growth in household spending, as shown in the latest GDP print and monthly household spending indicator, bodes well for this more macro-sensitive segment of the market. However, given the wild swings we saw during the earnings season, diversification is key.
Investors seeking exposure to the growth potential of mid-caps and small caps on the ASX will need to look past ETFs tracking the S&P/ASX 200. This is because the top 10 largest companies by market capitalisation represent roughly 50% of the S&P/ASX 200, with the other 190 stocks squeezed into the other half of the portfolio. The VanEck S&P/ASX MidCap ETF (MVE) provides access to a diversified portfolio of ASX-listed mid-sized companies. It is also Australia’s only dedicated Mid-Caps ETF. The VanEck Small Companies Masters ETF (MVS) gives investors exposure to a diversified portfolio of ASX-listed small companies that are considered to offer growth potential for a reasonable price (GARP).
Key risks
An investment in the ETF carries risks associated with: financial markets generally, individual company management, industry sectors, stock and sector concentration, fund operations and tracking an index. See the PDS and TMD for more details.


Published: 19 September 2025
Any views expressed are opinions of the author at the time of writing and is not a recommendation to act.
VanEck Investments Limited (ACN 146 596 116 AFSL 416755) (VanEck) is the issuer and responsible entity of all VanEck exchange traded funds (Funds) trading on the ASX. This information is general in nature and not personal advice, it does not take into account any person’s financial objectives, situation or needs. The product disclosure statement (PDS) and the target market determination (TMD) for all Funds are available at vaneck.com.au. You should consider whether or not an investment in any Fund is appropriate for you. Investments in a Fund involve risks associated with financial markets. These risks vary depending on a Fund’s investment objective. Refer to the applicable PDS and TMD for more details on risks. Investment returns and capital are not guaranteed.
MVS and MVE are likely to be appropriate for a consumer is who seeking capital growth and a regular income distribution, is intending to use the product as a minor or satellite allocation within a portfolio, has an investment timeframe of at least 5 years, and a high risk/return profile.