Picking the optimal Australian equity ETF
The Nobel Prize laureate, economist Harry Markowitz, is reported to have said, “Diversification is the only free lunch.” While we don’t think diversification will not necessarily protect investors from losses, we do think it is an important risk management tool.
Concentration is the opposite of diversification and Australia’s equity market is among the most concentrated in the world. That is why it is prudent to take the right approach when investing in Australian equities. Here we provide some insightful analysis for our popular Equal Weight ETF (MVW) versus the S&P/ASX 200.
As at the end of March, BHP represented over 11% of the S&P/ASX 200 index. This means when you invest in the S&P/ASX 200, more than a tenth of your investment in 200 companies is being invested in only one company. This is because the S&P/ASX 200 is a market capitalisation index. A company’s representation in a market capitalisation index is in proportion to its size, the bigger the company, the larger its representation in the index. Most of the indices quoted in the media, such as the S&P 500 and FTSE 100 are market capitalision indices. These indices were designed to be barometers of the market’s health and were not designed to be the basis of an investment. However, as investing evolved, passive fund managers started to track these indices, giving their investors benchmark-like returns.
Not everyone is happy with benchmark-like returns. Active fund managers try to outperform market capitalisation benchmarks. They think they can outperform these benchmarks because of some of the shortcoming of these benchmarks. This includes:
- Weighting a fund according to market capitalisation can have a negative impact on performance. This is because when the market overvalues a stock its market capitalisation goes up. A fund tracking a traditional market capitalisation index buys more and more of the overpriced stock and loses money when the market corrects. Conversely, when the market undervalues a stock, the fund sells more and more of the underpriced stock, missing profit when the market corrects.
- An investor seeking to maximise returns want to allocate more to those companies with the greatest growth potential. By allocating to a market capitalisation index, the assumption investors are making is that those companies with the greatest growth potential are the largest, because they get more of an investment. This issue is more problematic in concentrated markets. The S&P/ASX 200 exposes investors to excessive concentration risk. The top 10 companies represent over 50% of the index. Four of the top six companies are banks. Financials make up over nearly a third of the index. Investors buying a fund that ostensibly contains 200 stocks would likely assume such a broad-based fund to be better diversified.
It has been observed that not all active funds outperform market capitalisation indices. Hence the popularity of passive funds such as ETFs. Index innovations have given rise to different index methodologies, such as equal weight, to be created. Funds that track these indices aim to give investors the best of low-cost passive investing combined with the targeted outcomes of active management. The term for indices constructed differently to market capitalisation indices is ‘smart beta’. Large institutional investors have been using them for many years.
The equal weight Index that MVW tracks is a smart beta index. Equal weighting Australian equities allocates exposure away from mega-cap stocks. MVW therefore will have greater exposure to companies outside the top 10, and is more diversified than the market capitalisation index.
We recently released a white paper on equal weight investing here.
Since its launch, MVW has outperformed the S&P/ASX 200. Noting as always, past performance is by no means indicative of future performance.
Let’s walk through the difference between MVW and the S&P/ASX 200.
MVW vs S&P/ASX 200 - Diversification
A way to measure diversification of a portfolio is to calculate its Herfindahl Index. This index is a broadly used technique to quantify concentration. When used inversely, this index measures diversification. As at the last rebalance in March 2023, the Herfindahl Index for the S&P/ASX 200 was 340. The equivalent measure for the index MVW tracks was 120. The MVW Index is therefore around a third as concentrated as the S&P/ASX 200. In other words, the MVW Index is almost three times more diversified than the S&P/ASX 200.
MVW vs S&P/ASX 200 - Performance
Equal weight investing has served Australian investors. To Anzac Day 2023, since its inception on ASX in 2014, MVW has outperformed the S&P/ASX 200 by 1.66% p.a.
Chart 1: Cumulative performance since MVW inception date to 25 April 2023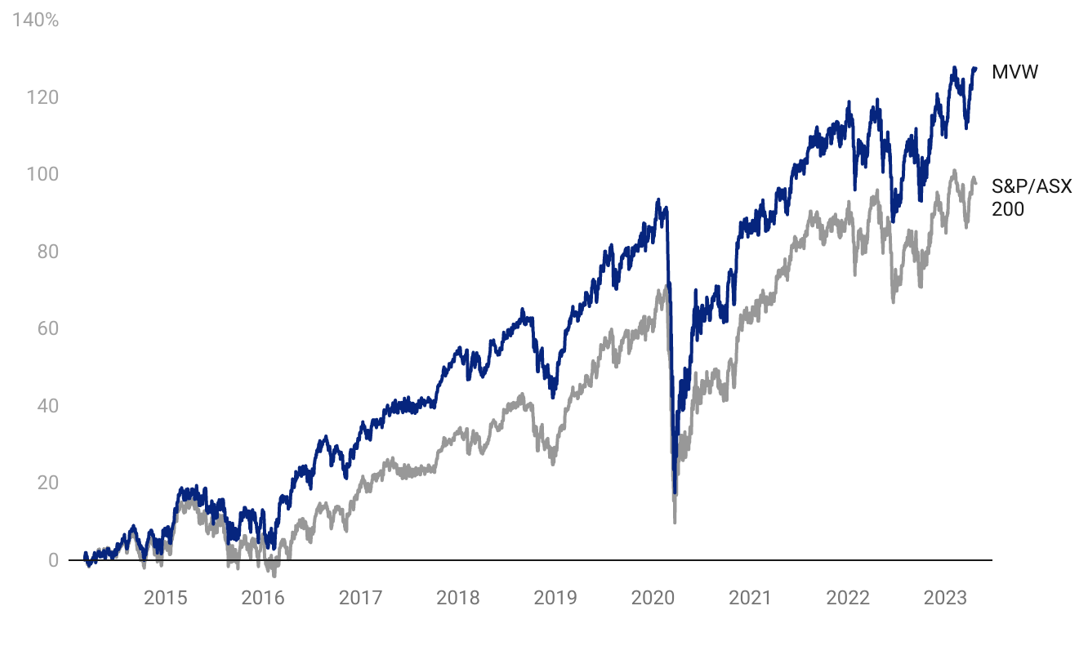
Table 1: Trailing performance to 25 April 2023
|
MTD |
1 Month (%) |
3 Months (%) |
YTD |
6 Months (%) |
1 yr (%) |
3 yrs (% p.a.) |
5 yrs (% p.a.) |
7 yrs (% p.a.) |
Since Inception* (% p.a.) |
|
|
MVW |
3.70 |
6.50 |
1.23 |
7.18 |
12.23 |
5.01 |
17.77 |
8.58 |
9.60 |
9.40 |
|
S&P/ASX 200 |
2.03 |
5.32 |
-0.51 |
5.56 |
9.95 |
2.48 |
16.06 |
8.53 |
9.24 |
7.74 |
|
Difference |
+1.67 |
+1.18 |
+1.74 |
+1.62 |
+2.28 |
+2.53 |
+1.71 |
+0.05 |
+0.36 |
+1.66 |
* MVW Inception date is 4 March 2014 a copy of the factsheet is here.
Chart 1 and Table 1 source: Morningstar Direct, VanEck as at 25 April 2023. The chart and table above show past performance of MVW and of the S&P/ASX 200. You cannot invest directly in an index. Results are calculated to the last business day of the month and assume immediate reinvestment of distributions. MVW results are net of management fees and other costs incurred in the fund, but before brokerage fees and bid/ask spreads incurred when investors buy/sell on the ASX. Returns for periods longer than one year are annualised. Past performance is not a reliable indicator of future performance. The S&P/ASX 200 Index is shown for comparison purposes as it is the widely recognised benchmark used to measure the performance of the broad Australian equities market. It includes the 200 largest ASX-listed companies, weighted by market capitalisation. MVW’s index measures the performance of the largest and most liquid ASX-listed companies, weighted equally at rebalance. MVW’s index has fewer companies and different industry allocations than the S&P/ASX 200. Click here for more details.
MVW vs S&P/ASX 200 Index - Top 10 holdings
Below you can see the top 10 companies. The differences are stark – to see all the holdings in MVW and their weightings click here.
Table 2: Top 10 holdings MVW Table 3: Top 10 S&P/ASX 200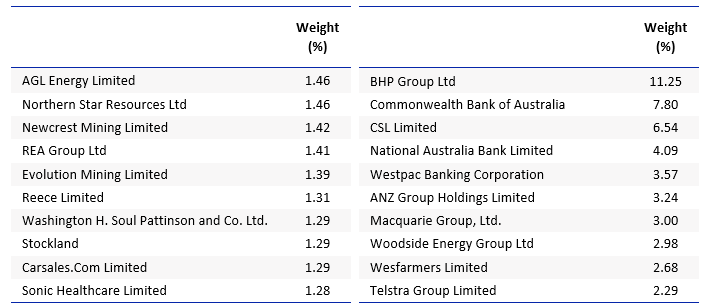
Source: Factset, VanEck, MVIS, as at 31 March 2023 Source: Factset, VanEck, S&P, as at 31 March 2023
The reason MVW’s holdings are not equal above is that it only rebalances back to equal weight each quarter.
MVW vs S&P/ASX 200 Index - Sectors
MVW is currently underweight the financials’ sector by 8.72% compared to the S&P/ASX 200 and underweight materials (-6.17%). Conversely, it is overweight industrials by 6.64% and real estate by 4.62%.
Chart 2: S&P/ASX 200 and MVW sector weightings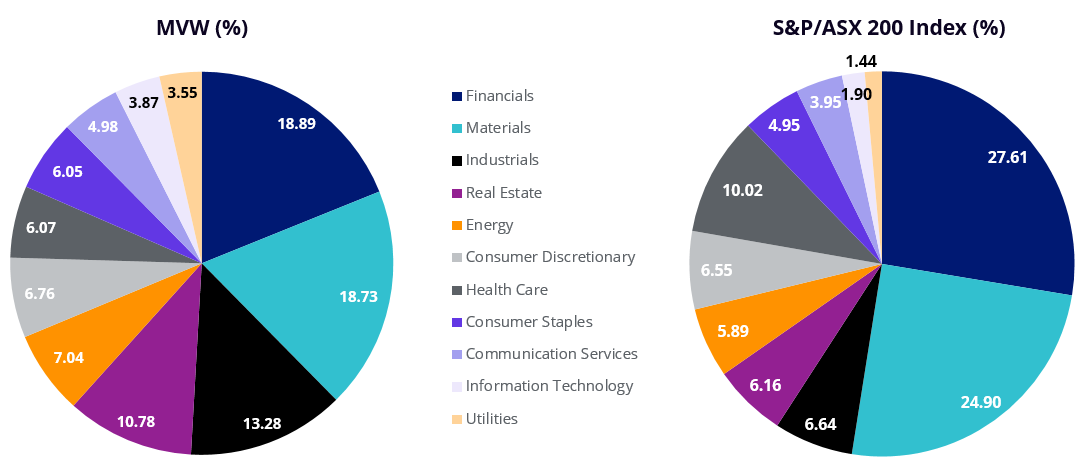
Source: Factset, 31 March 2023
What this means is that if there is another systematic banking issue, or pressure on commodities, the impact on the S&P/ASX 200 is greater than on MVW.
MVW vs S&P/ASX 200 Index - Style
When looking at portfolios it is important to determine what style e.g. value or growth and what size bias a portfolio holds e.g. giant, large, mid or small. Below we can see MVW’s. Importantly MVW holds large companies with a similar value-core orientation relative to the S&P/ASX 200, which skews larger (giant) and more toward value.
Chart 3: MVW holdings based style map Chart 4: S&P/ASX 200 holdings based style map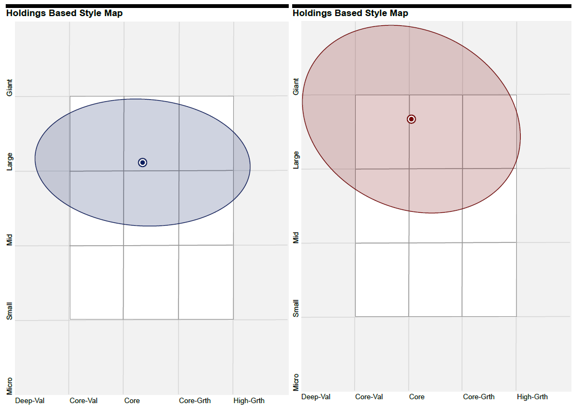
Source: Morningstar Direct, as at 31 March 2023 Source: Morningstar Direct, as at 31 March 2023
While each Australian equity ETF has its merit for portfolio inclusion, you should assess all the risks and consider your investment objectives.
Past performance is no guarantee of future performance. The above is not a recommendation. Please speak to your financial adviser or stock broker.
For further information you can email us or call on us on +61 2 8038 3300.
Key risks
An investment MVW carries risks associated with: ASX trading time differences, financial markets generally, individual company management, industry sectors, country or sector concentration, political, regulatory and tax risks, fund operations and tracking an index. See the PDS for details.


Published: 26 April 2023