Carbon markets hit record highs
The European Union’s carbon price hit a record 100 euros per metric tonne for the first-time in late February. It has been described as a landmark moment, driving the cost for companies of polluting to an all-time high.
For investors a rising carbon price is an opportunity.
The European Union’s carbon price hit a record 100 euros per metric tonne for the first-time in late February. It has been described as a landmark moment, driving the cost for companies of polluting to an all-time high.
The Financial Times reports the €100 threshold has been seen as psychologically important, and a price at which companies may start looking more seriously at investing in emerging technologies such as carbon capture and storage.
The price of carbon permits or EUAs are the main currency in the European Union's Emissions Trading System (ETS) that forces manufacturers, power companies and airlines to pay for each tonne of carbon dioxide they emit as part of the bloc's efforts to meet its climate targets.
Chart 1: The benchmark EU Allowance (EUA) contract rose to a high of €105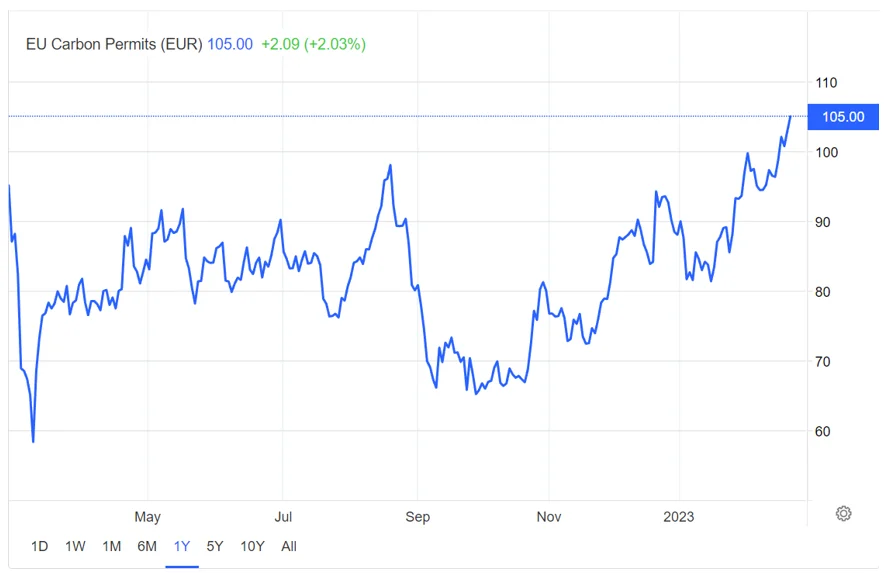
Source: Trading Economics, 22 February 2023.
Global carbon market hits new record in 2022
The new high comes on the back of a record 2022 for compliance ETSs around the world. For companies regulated by the major ETS schemes in 2022, the cost of emitting greenhouse gases soared. EU allowances averaged over €80/t, up 50 percent from the previous year. UK allowances fetched an even higher price, and those in both North American markets (WCI and RGGI) averaged higher than any previous year as well.1
According to Refinitiv; “Despite the number of transactions falling more than 20 percent year-on-year, global carbon transactions were worth €865 billion, representing a 14 percent increase from 2021 and reaching a new record for the sixth consecutive year.”
The research house says the sustained high prices are partly because of the war in Ukraine affecting the European energy market, which is home to the EU ETS that accounts for most of the carbon market transactions globally. While more ambitious climate targets are also contributing to the record high prices, as countries/regions tighten their carbon caps to help achieve those targets.
Chart 2: World Carbon markets total value by segment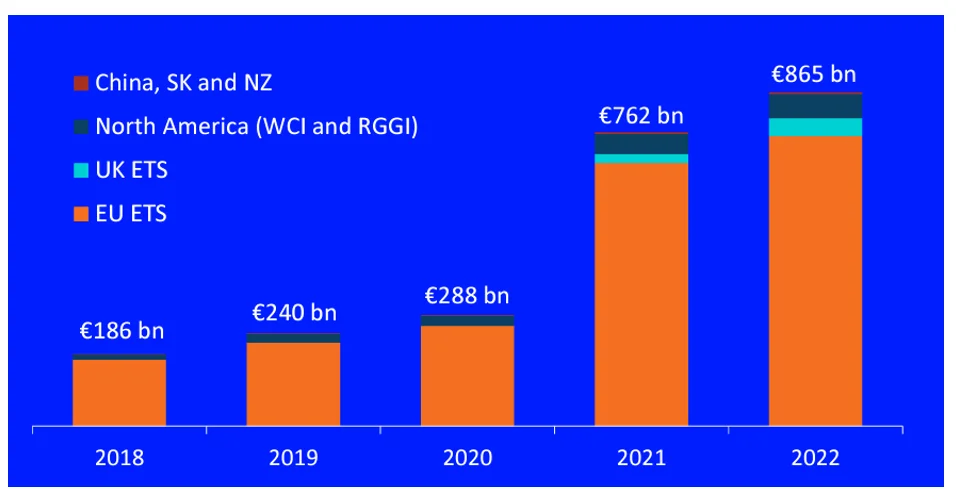
Source: Refinitiv. Figures at calendar year end.
Outlook for the price of carbon credits
The recent surge in carbon prices comes as policy makers have tightened the European Union’s cap-and-trade system to help the bloc deliver on a goal to slash emissions 55% by the end of the decade from 1990 levels. “New rules agreed in December and in the process of being ratified, which will effectively see emissions allowed under the scheme falling to zero by 2039, are the “long-term structural bullish driver of this market”, said Mark Lewis, head of climate research at hedge fund Andurand Capital Management.
Additionally, the total number of allowances in the system will fall over time, and the number given out to polluting companies for free will also fall. “The fundamental point about this market is the EU has cleared the way for higher prices as that is what is ultimately needed to meet their aims of cutting emissions.” Lewis added.
Another reason behind the higher prices, increased coal use during the energy crisis has prompted buying of EUA’s, as coal emits roughly as much carbon as gas when burnt.
Adolfo Aiello, Deputy Director General at steel industry group Eurofer recently told Reuters “an EU carbon price of 100 euros adds 30-40 euros to the cost of a tonne of primary steel production,” thereby incentivizing companies to find cleaner ways to manufacture and produce their products.
Moreover, Jan Ahrens, head of research at SparkChange says, “since most polluters are still scared of high carbon prices in the future, any major dip will recover reasonably fast as corporates will take these as opportunities to hedge their future positions.”
Analysts have increased their average price forecasts for EU carbon permits for the next three years on expectations that Europe's economies could start to improve as energy prices fall from record highs.
Meanwhile Reuters reports traders said cooler temperatures combined with lower wind speeds means there is likely to be more demand for power from Europe’s fossil fuel-powered plants which need to buy carbon permits to cover their emissions.
“Temperatures in Northern Europe are actually now forecasted to go below seasonal averages next week, which might instigate utilities to increase their hedging activities,” said Gregory Idil, a senior carbon emissions trader at Vertis.
EU Allowances (EUAs) are expected to average 81.40 euros a tonne in 2023 and 94.14 euros in 2024, a Reuters survey of six analysts showed. That is up 4.2% and 1.9% respectively from forecasts made in October 2022. But as we enter the third month of 2023 EUA’s have already pushed much higher, breaking through the 100 euro mark in late February.
Beyond the EU market, policies in all four major markets has been simplified, carbon permit supplies have been tightened, or there are pending supply tightening actions which should increase the price of carbon permits in the near term.
Carbon markets have a low correlation from other asset classes, and in terms of portfolio construction holding assets with a low correlation with each other can help reduce the risk of a portfolio,
Carbon futures may also provide a hedge against the investment risk resulting from the global economy’s transition away from fossil fuels.
While most everyday investors can’t invest directly in carbon credits, exchange traded funds (ETFs) enable people to invest in this emerging asset class. In Australia, the VanEck Global Carbon Credits ETF (Synthetic) (XCO2) was the first carbon credits ETF to list on ASX. It tracks the ICE Global Carbon Futures Index which covers which covers the four most actively traded carbon futures markets in the world being the European Union ETS, Regional Greenhouse Gas Initiative, California, UK ETS.
It is important to note there are risks, the carbon market can be swayed by economic cycles, the weather and changes in energy prices, which makes it volatile at times.
Carbon permits as an investment opportunity
Carbon permits are not only a way of incentivizing reduced greenhouse emissions they present an investment opportunity in an emerging asset class, “a wider financial community embracing everyone from hedge funds and fintech players to crypto enthusiasts is jumping into the carbon markets, financialising transactions as they have with other commodity-based markets.”
“Investors betting on the rise of carbon permits have done very well so far, both for themselves and for the planet. This niche group include utilities and industrial companies, who acquire more than their annual permit requirements, and financial investors that have spotted a juicy opportunity,” Financial Times
Chart 3: XCO2 Index hypothetical growth of $10 000 since inception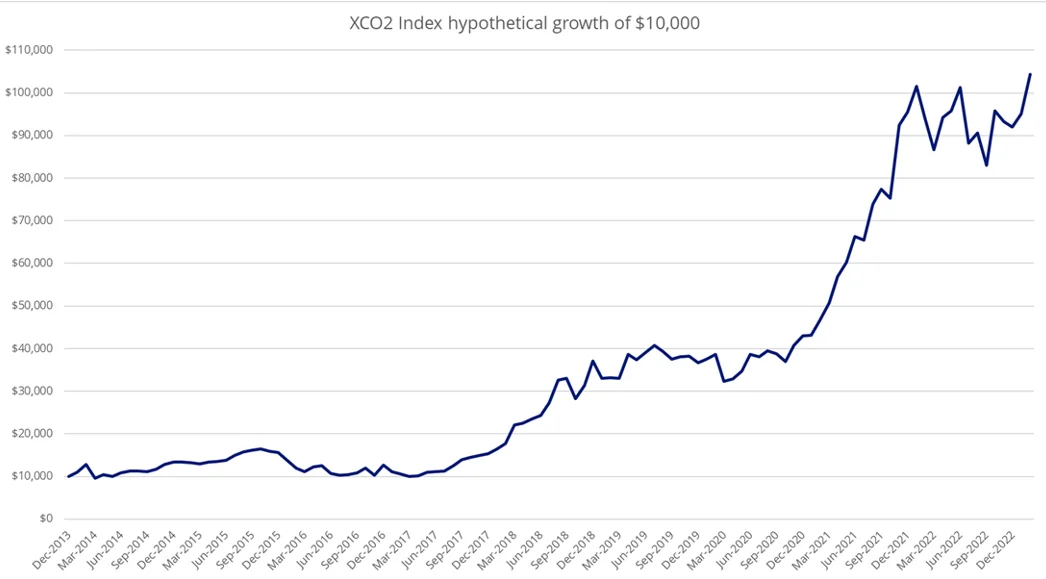
Source: VanEck, Bloomberg, as at 31 January 2023. The above performance graph shows the performance of the XCO2 Index based to $10,000. Results are calculated to the last business day of the month and exclude costs associated with investing in XCO2. You cannot invest directly in an index. The above performance information is not a reliable indicator of current or future performance of the index or XCO2, which may be lower or higher. XCO2 Index base date is 31 December 2013.


Published: 03 March 2023
1“Carbon Market Year in Review 2022” Refinitiv, 6 February 2023 p. 1
An investment in the ETF carries risks associated with: ASX trading time differences, market risk, concentration risk, futures strategy risk, cap and trade risk, currency risk, political, regulatory and tax risks, fund operations and tracking an index. See the PDS for details.
VanEck Investments Limited (ACN 146 596 116 AFSL 416755) (VanEck) is the issuer and responsible entity of all VanEck exchange trades funds (Funds) listed on the ASX. This is general advice only and does not take into account any person’s financial objectives, situation or needs. The product disclosure statement (PDS) and the target market determination (TMD) for all Funds are available at. You should consider whether or not an investment in any Fund is appropriate for you. Investments in a Fund involve risks associated with financial markets. These risks vary depending on a Fund’s investment objective. Refer to the applicable PDS and TMD for more details on risks. Investment returns and capital are not guaranteed.
ICE is a registered trademark of ICE Data Indices, LLC or its affiliates. This trademark has been licensed, along with the ICE Global Carbon Futures Index (“Index”) for use by VanEck in connection with XCO2 (the “Product”). Neither VanEck nor the Product(s), as applicable, is sponsored, endorsed, sold or promoted by ICE Data Indices, LLC, its affiliates or its third party suppliers (“ICE Data and its Suppliers”). ICE DATA AND ITS SUPPLIERS MAKE NO REPRESENTATIONS OR WARRANTIES REGARDING THE ADVISABILITY OF INVESTING IN SECURITIES GENERALLY, IN THE PRODUCT(S) PARTICULARLY, OR THE ABILITY OF THE INDEX TO TRACK GENERAL MARKET PERFORMANCE. ICE DATA AND ITS THIRD PARTY SUPPLIERS ACCEPT NO LIABILITY IN CONNECTION WITH THE USE OF THE INDEX, INDEX DATA OR MARKS. See PDS for a full copy of the disclaimer.