Heatwaves, carbon pricing and what’s in it for investors
The Rugby World Cup has kicked off in France and one of the big stories about the event is the extreme heat games are being played in.
France is not alone, recent heat waves across the globe thrust the changing climate back into the spotlight. Additionally, after three consecutive years of La Niñas, the El Niño has returned.
Scientists believe the weather patterns seen during El Niño are likely to send global temperatures soaring to record levels in the next few years. While La Niñas and El Niños are not new, their strength and frequency have been increasing and this has been linked to human activity, primarily, increased levels of carbon dioxide.
Putting any conjecture aside, two facts remain:
- There is an increased CO2 concentration in the atmosphere; and
- Carbon pricing markets are garnering increased attention as they have a critical role to play in supporting the transition away from the biggest human contributor to CO2 levels - the burning of fossil fuels.
In terms of carbon pricing, Australia is trailing the rest of the world, where there are 73 carbon pricing instruments in operation.
To meet the 2-degree temperature goal of the Paris Agreement the carbon price needs to be US$61 to US$122/tCO2e, but less than 5% of global emissions in 2023 are covered by a direct carbon price at or above the estimated range required by 2030.1This would mean that higher carbon prices will be needed over the next decade to achieve carbon goals.
Earlier this year, driven by demand, the price of the permits on the EU’s carbon markets went beyond €100 for the first time ever.
We believe there is still an asymmetric upside for the price of carbon, which remains at levels too low for carbon emissions reduction targets.
The heat wave is on
July was supposedly the world’s hottest month on record, as scorching temperatures ravaged all corners of the globe.
This shift in weather conditions is being attributed to climate change. Notably, global temperature has been the hottest in the last 9 years (Chart 1).
Chart 1: Increasing global temperatures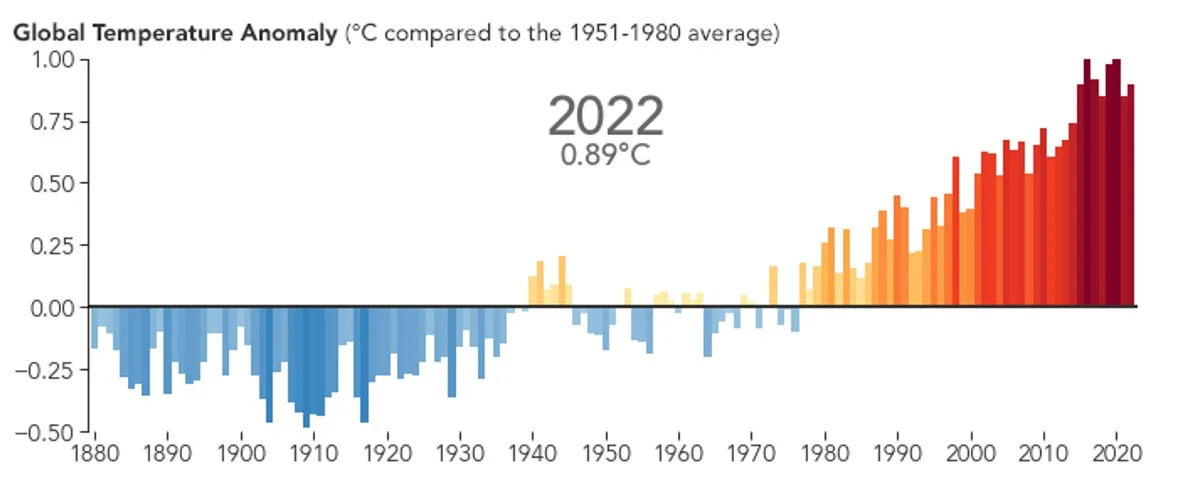
Source: NASA, data from 1880 to 2022
Carbon markets in focus
This has put a focus on government policy. As governments and businesses around the world aim to achieve ambitious emissions goals by 2050 or earlier, carbon pricing markets are garnering increased attention as they have been identified as a mechanism to help realise these goals. Economists widely agree that introducing a carbon price is the single most effective way for countries to reduce CO2 emissions.
Carbon pricing threads climate change costs into economic decision-making, incentivising changes in production and consumption patterns toward decarbonisation.
The price of carbon explained
Carbon pricing requires polluters to pay for the CO2 they release into the atmosphere. There are two main forms of carbon pricing:
- Carbon taxes; and
- Cap-and-trade programs.
A carbon tax is simply a levy on carbon. The price is set by the government.
For investors, it is the cap-and-trade programs (also known as an Emissions Trading Scheme or ETS) that create opportunities.
ETSs allows market participants to buy and sell permits for emissions or credits for reductions in emissions. In these schemes the supply of carbon credits is transparent, and the schemes are also designed to limit the supply of pollution-permits over time.
Carbon credits are either:
- auctioned by the government and then traded, or
- given for free to regulated firms who can then trade them.
These primary and secondary market sales and purchases result in a market price for carbon. In other words, there is a market setting the carbon price.
And it is ETSs that are growing in popularity among governments as the preferred carbon pricing mechanism.
Chart 2: Share of global GHG emissions covered by ETSs and carbon taxes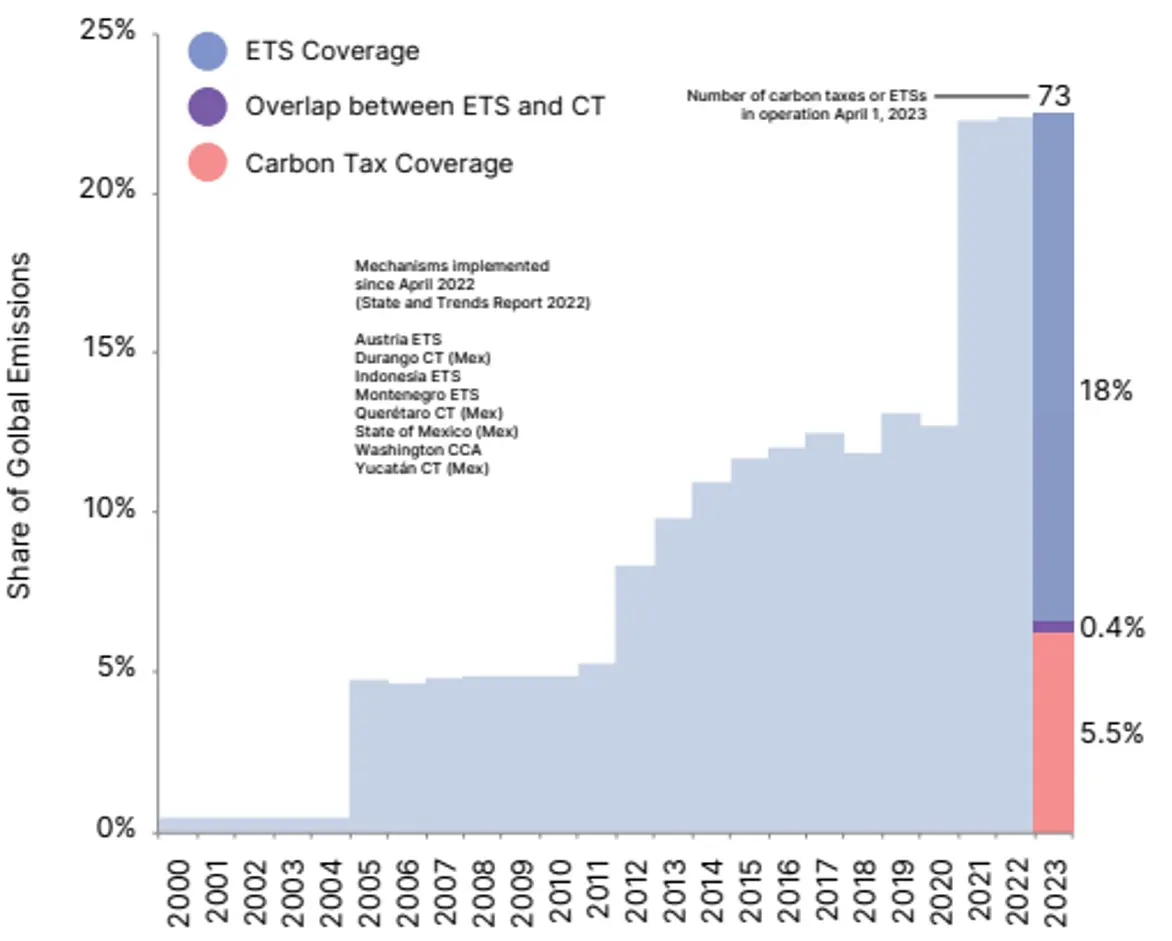
Source: World Bank, May 2023
Chart 3: Evolution of global revenues from carbon taxes and ETSs over time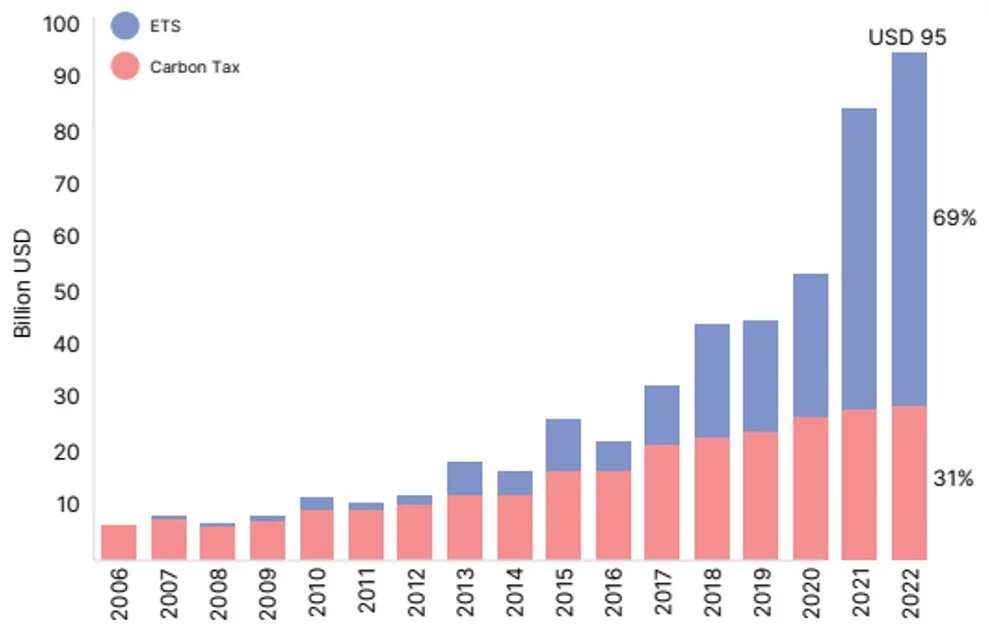
Source: World Bank, May 2023. Nominal. Includes revenues from carbon taxes and ETSs (e.g., from auctioning) collected by governments. It does not account for foregone revenue, for example from freely allocated units or tax exemption.
According to the World Bank’s State and Trends of Carbon Pricing 2023, to meet the 2-degree temperature goal of the Paris Agreement the carbon price needs to be US$61 to US$122/tCO2e, but less than 5% of global emissions in 2023 are covered by a direct carbon price at or above the estimated range required by 2030.1
Chart 4: Map of carbon price levels and coverage of implemented carbon taxes and ETSs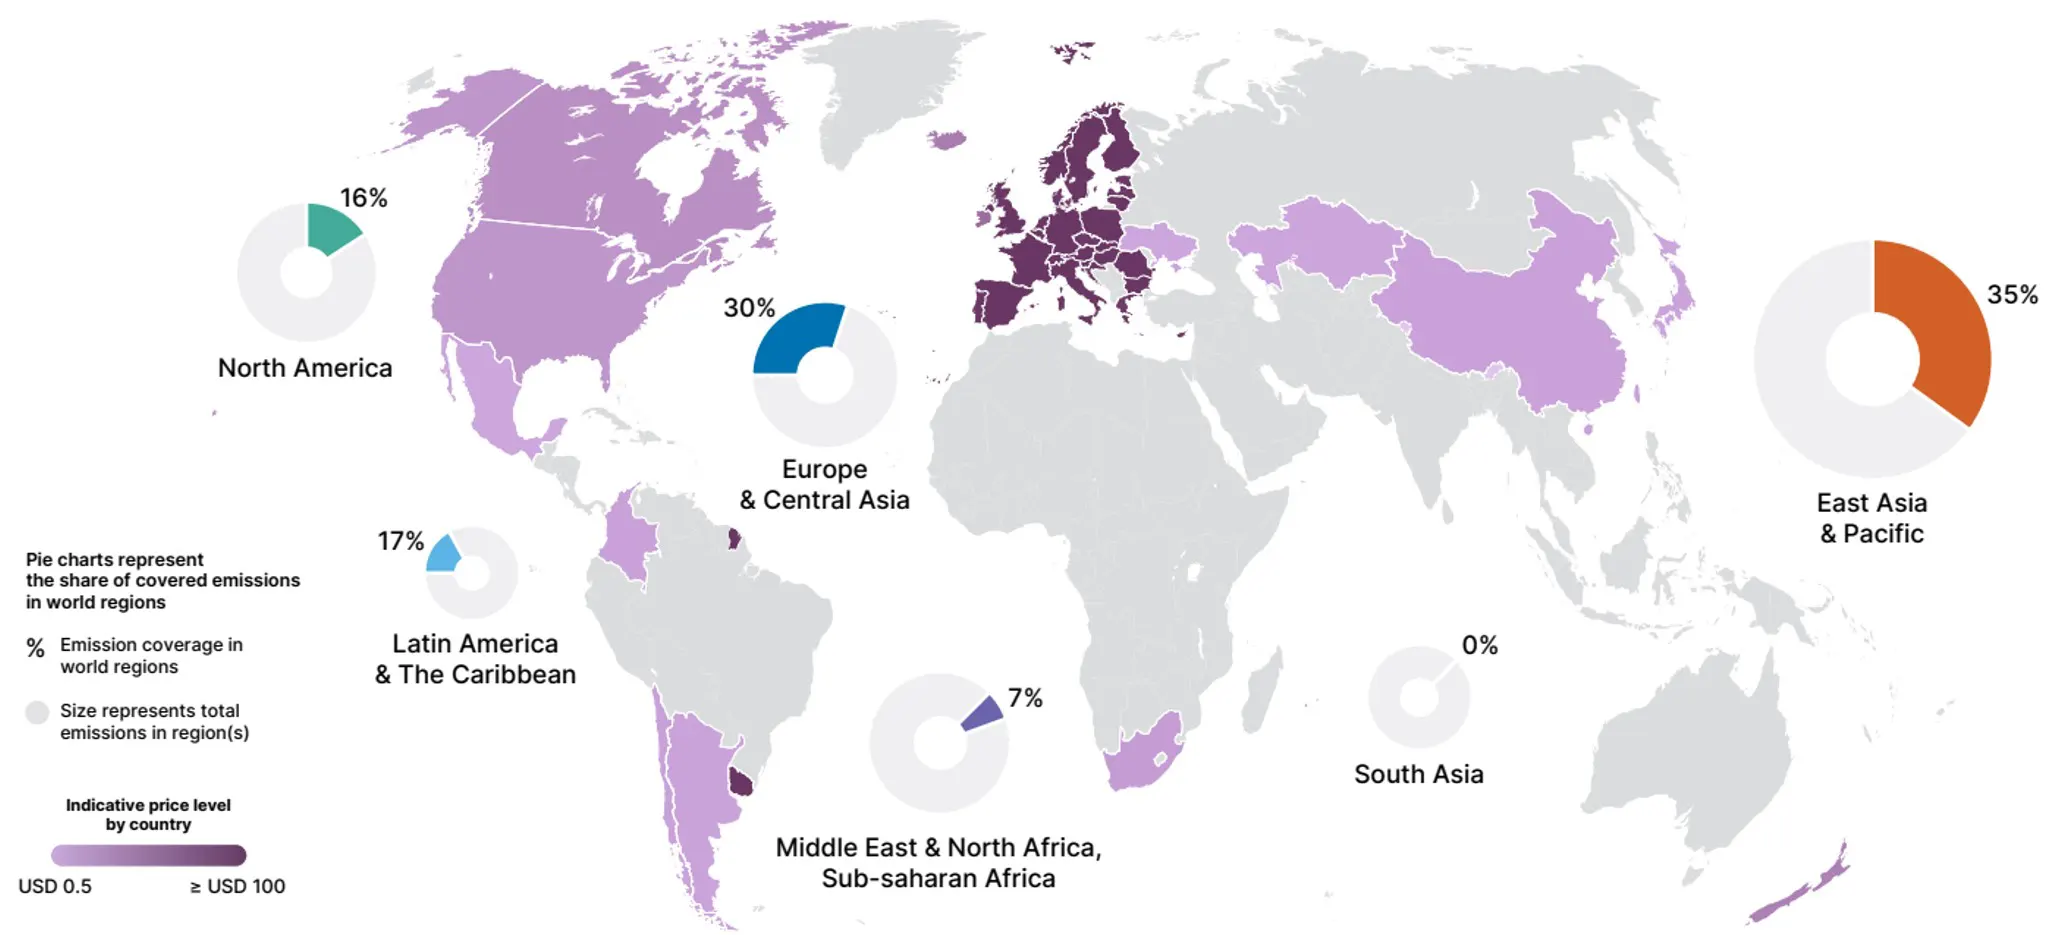
Source: World Bank, May 2023. The size of each regional chart represents the total emissions in the corresponding region, whereas the coloured section is the share of emissions in the region covered by ETSs and carbon taxes. The price for each country reflects the main rate that applies to the greatest portion of GHG emissions.
Earlier this year the carbon price hit €100 in February but is now back at €95 following a steep climb earlier this quarter. According to the Financial Times, “analysts predict the price will rise well beyond its present levels in the coming years. By 2030, they expect it will hit €144 on average”.
This positive return could be attributed to weather uncertainty and geopolitical risk premiums, with the El Niño returning after three back-to-back years of La Niñas. Scientists believe the weather patterns seen during El Niño are likely to send global temperatures soaring to record levels in the next few years.
Last year, La Niñas returned for the third time in a row, making it a rare triple-dip event. There are only three other triple-dip La Niñas recorded since 1950, spanning the years 1954-1956, 1973-1976 and 1998-2001. La Niña conditions are typically associated with extreme weather conditions across the world, causing droughts in some parts, an increased number of Atlantic hurricanes and more wildfires in the western US.
Another compelling long-term trend underpinning carbon prices is the political push to continue to fight climate change, even in the face of recent inflation. According to the World Bank, in 2022, only a few countries responded to the political pressures from high energy prices by deliberately lowering carbon tax rates or postponing scheduled increases. By contrast, most jurisdictions did not tone down the ambition of their carbon taxes or ETSs. What is more, several jurisdictions made decisions to further strengthen existing carbon taxes or ETSs in the coming years.
Gaining exposure to carbon markets
The investment case for considering carbon credits is that the price of carbon is expected to go up as demand and supply mismatch. The EU ETS is a good example of why we think carbon prices will continue to rise. The EU plans to release fewer emission allowances in the coming years with the intention of raising the price to the point where it affects capital expenditure decisions by power companies and other polluters and cutting the number of free allowances it has handed out to placate other industries. It also plans to extend the scheme to cover more sectors.
Additionally, from a portfolio perspective, carbon markets maintain low correlation and diversification benefits from other asset classes.
Table 1: ICE Global Carbon Futures Index correlation to other major asset classes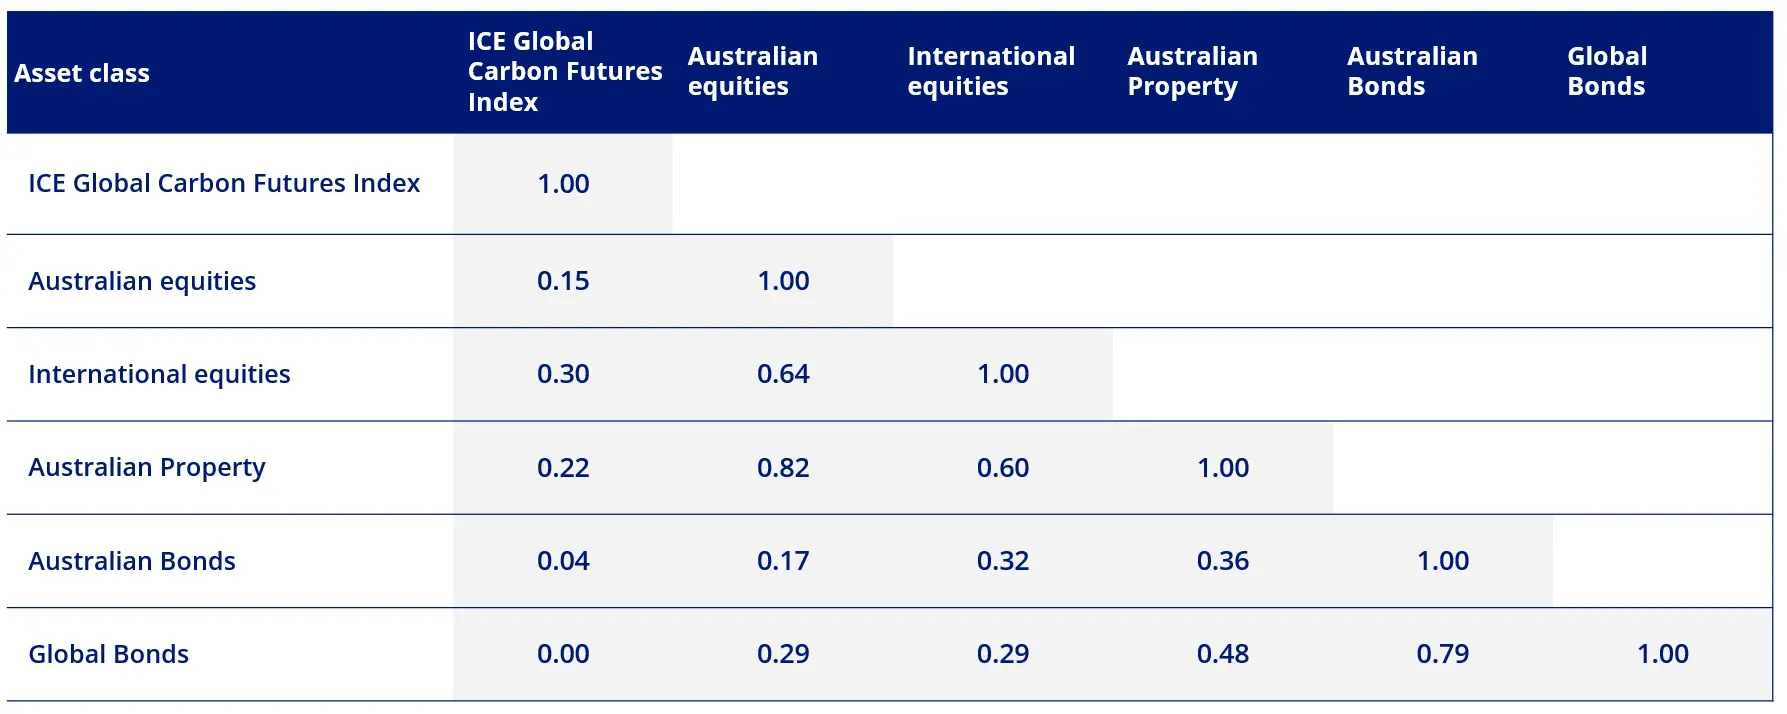
Source Morningstar Direct, 1 January 2014 to 31 August 2023. ICE Global Carbon Futures Index base date is 1 January 2014. Results are calculated monthly and assume immediate reinvestment of all dividends. You cannot invest in an index. Past performance is not a reliable indicator of future performance. Comparison indices used: Australian Equities – S&P/ASX 200 Accumulation Index, International Equities – MSCI World ex Australia Index, Australian Property – S&P/ASX 200 A-REITs Index, Australian Bonds – Bloomberg AusBond Composite 0+ years, Global Bonds – Barclays Global Aggregate Bond Index A$ Hedged.
To position for the long-term structural trend and potentially hedge the impact of increasing carbon prices on investor’s portfolios, investors are able to gain exposure to carbon markets via the VanEck Global Carbon Credits ETF (Synthetic) (ASX: XCO2).
XCO2, which launched in 2022, was an Australian first and is an innovative way for Australian investors to potentially benefit from changes to the price of carbon.
XCO2 tracks the ICE Global Carbon Futures Index (XCO2 Index), which is made up of a basket of the four most actively traded carbon markets/ETSs in the world:
-
- European Union Emissions Trading Scheme (EU ETS)
- Western Climate Initiative (California Cap and Trade Program)
- Regional Greenhouse Gas Initiative (RGGI)
- UK Emissions Trading Scheme (UK ETS)
Together these markets represent some of the largest regional economies in the world, and the secondary futures market for those programs predominantly trade on ICE’s futures markets.
Key risks: An investment in the ETF carries risks associated with: ASX trading time differences, market risk, concentration risk, futures strategy risk, cap and trade risk, currency risk, political, regulatory and tax risks, fund operations and tracking an index. See the PDS for details.

Published: 19 September 2023
1State and Trends of Carbon Pricing 2023, World Bank.
VanEck Investments Limited (ACN 146 596 116 AFSL 416755) (VanEck) is the issuer and responsible entity of all VanEck exchange traded funds (Funds) listed on the ASX. This is general advice only and does not take into account any person’s financial objectives, situation or needs. The product disclosure statement (PDS) and the target market determination (TMD) for all Funds are available at vaneck.com.au. You should consider whether or not any Fund is appropriate for you. Investments in a Fund involve risks associated with financial markets. These risks vary depending on a Fund’s investment objective. Refer to the applicable PDS and TMD for more details on risks. Investment returns and capital are not guaranteed.
ICE is a registered trademark of ICE Data Indices, LLC or its affiliates. This trademark has been licensed, along with the ICE Global Carbon Futures Index (“Index”) for use by VanEck in connection with XCO2 (the “Product”). Neither VanEck nor the Product(s), as applicable, is sponsored, endorsed, sold or promoted by ICE Data Indices, LLC, its affiliates or its third party suppliers (“ICE Data and its Suppliers”). ICE DATA AND ITS SUPPLIERS MAKE NO REPRESENTATIONS OR WARRANTIES REGARDING THE ADVISABILITY OF INVESTING IN SECURITIES GENERALLY, IN THE PRODUCT(S) PARTICULARLY, OR THE ABILITY OF THE INDEX TO TRACK GENERAL MARKET PERFORMANCE. ICE DATA AND ITS THIRD PARTY SUPPLIERS ACCEPT NO LIABILITY IN CONNECTION WITH THE USE OF THE INDEX, INDEX DATA OR MARKS. See PDS for a full copy of the disclaimer.