Divergence in the compliance carbon market
California’s carbon price (CCAs)
California’s carbon price (CCAs) continued its upward trajectory since the start of the year, reflected in both the auctions, as well as the futures market. The latest quarterly joint auction held together with Quebec in November witnessed a full clearance of both current and advance auction allowances again. In the meantime, the current and advance auction settlement prices rose further to US$38.73 and US$37.40 respectively, up over 10% compared to the previous batch of auction in August this year.
Chart 1: California Cap-and-trade Program Auction Prices
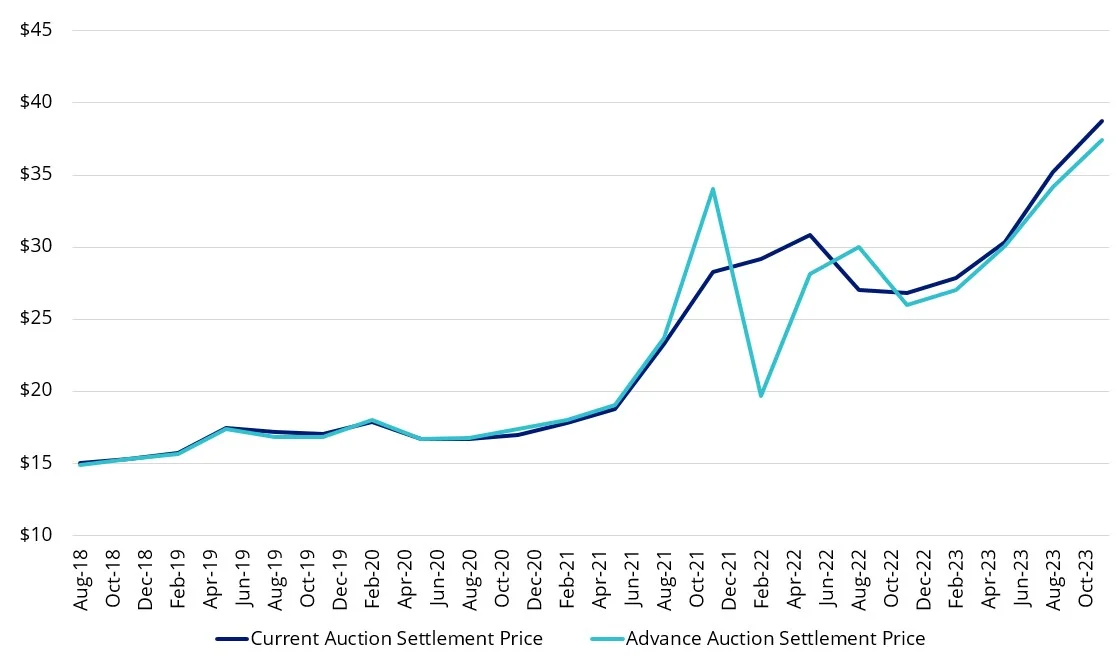
Source: California Air Resources Board (CARB), November 2023.
The tightness of the market can be evidenced by the rising cover ratio, i.e. total qualified bids divided by total allowances available for sale. For current auctions it edged up from 1.59 in August to 1.65 in November, whereas for advance 2026 vintage it also jumped from 2.02 to 2.27. This reflects the market expectation for future supply scarcity. The demand for carbon allowances could be further boosted by gas-fired power stations this year, as the power generation has been 4% higher across January to October compared to last year according to BloombergNEF.
The Joint Cap-and-Trade Program Workshop held by California Air Resources Board (CARB) in November shows the modeling of mean allowance prices of US$95 (2023 dollars) through 2040 in the business-as-usual scenario.
European carbon prices (EUAs)
While CCA prices have been rising, European carbon prices (EUAs), fell the most among the four mandatory carbon markets over November as the downside pressure remains in the short term from the front-loading allowance supply, in order to raise money for the REPowerEU plan to shift away from Russian fossil fuels. The EU ETS regulators released the preliminary auction volumes for general allowances in 2024 during the past month, with a total of 244 million compliance carbon permits to be auctioned for the Member States during the period from January to August next year. Throughout next year, close to 87 million permits will be auctioned for the Recovery and Resilience Facility; 35 million for the Innovation Fund (the EU fund for climate policy with a focus on energy and industry); and 97 million for the Modernisation fund (the beneficiary Member States are Bulgaria, Croatia, Czechia, Estonia, Hungary, Latvia, Lithuania, Poland, Romania and Slovakia). According to the announcement, the auction allowance considers the reduction of the cap and the linear reduction factor, the addition of maritime transport in the scope of the ETS, and changes to the share of free allocation for aviation.
The other hot topic in the EU bloc is regarding the implementation of the Carbon Border Adjustment Mechanism (CBAM). Since the beginning of October this year until 2026, foreign companies will need to gradually pay more for emissions by purchasing and surrendering a corresponding number of ‘CBAM certificates’ that will match the price of carbon allowances in the EU ETS. This scheme is likely to promote the convergence of carbon prices towards the EU level, which is currently around €80/Mt.
UK Emissions Trading Scheme (UKAs)
The UK Emissions Trading Scheme (UKAs) have experienced volatile movement over the past few months. Since inception, the correlation with the EUAs has been trending down, driven by the reduced demand from the UK power sector which generated less emissions, and the rising renewables output. Energy UK recently released a publication advocating that re-linking the UKAs and EUAs will be required, in order to achieve higher revenues for the UK exchequer, and to ensure that British companies won’t be stung by substantial new taxes, imposed by CBAM, for simply trading with their largest export partner.
Chart 2: Correlation between UKAs and EUAs
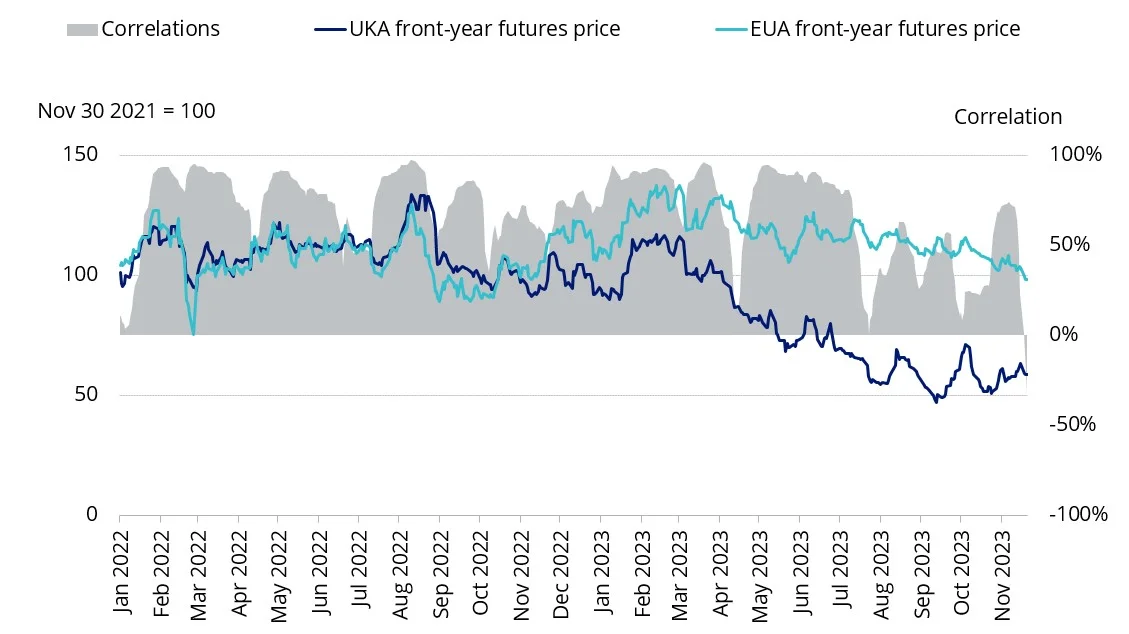
Source: BloombergNEF, November 2023.


Published: 07 December 2023
Any views expressed are opinions of the author at the time of writing and is not a recommendation to act.
VanEck Investments Limited (ACN 146 596 116 AFSL 416755) (VanEck) is the issuer and responsible entity of all VanEck exchange traded funds (Funds) trading on the ASX. This is general advice only and does not take into account any person’s financial objectives, situation or needs. The product disclosure statement (PDS) and the target market determination (TMD) for all Funds are available at vaneck.com.au. You should consider whether or not an investment in any Fund is appropriate for you. Investments in a Fund involve risks associated with financial markets. These risks vary depending on a Fund’s investment objective. Refer to the applicable PDS and TMD for more details on risks. Investment returns and capital are not guaranteed.