European carbon market outlook
The price of carbon permits in the EU was relatively stable for the first 15 years of the EU ETS, oscillating between €5 and €25 a ton. But since the start of 2020, this number has risen to unprecedented levels. By August 2022, it had peaked at almost €100 a ton, having propelled by more than 200% since the beginning of 2021. But where will the price go in 2023?
The price of carbon permits in the EU was relatively stable for the first 15 years of the EU ETS, oscillating between €5 and €25 a ton. But since the start of 2020, this number has risen to unprecedented levels. By August 2022, it had peaked at almost €100 a ton, having propelled by more than 200% since the beginning of 2021.
Chart 1: EU carbon permit prices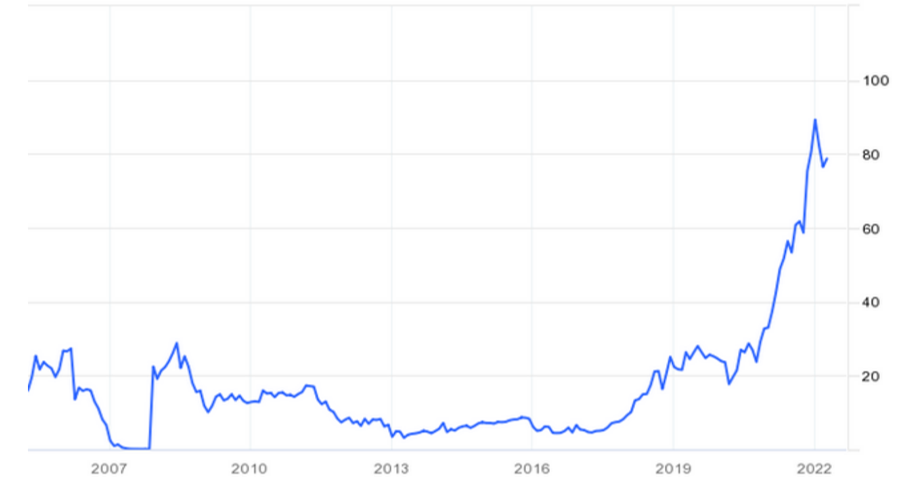
Source: tradingeconomics.com
What is interesting about carbon permits’ meteoric rise over the past 24 months is that it has not been driven by the increasing global impetus for decarbonisation but rather the rise has been almost entirely driven by the market. The soaring cost of gas has led many power generators to switch from low-carbon gas to high-carbon coal, this has resulted in an increased demand for EUAs or carbon credits by companies to comply with regulation
After beating expectations for most of 1H 2022, European carbon prices have seen a significant move lower in the past few months, with European Union Allowance (EUA) (the emissions allowance also tradable within the UK Emissions Trading System) dropping from their August highs to a low of 65 euros in September, before recovering to around 80 euros on the 29thof November.
Notwithstanding some short-term volatility, analysts expect the rise in the carbon price to continue, with some predicting increases of up to 150 euros a tonne by 2030 according to Climate Trade.
Short-term Citi Bank see price support for EUA’s (an even some more upside) from the return of coal-fired power generation (after a slump in October).
Mid-term outlook
Over the mid-term however, there are some headwinds for EUAs, an increase in nuclear and hydro power generation, combined with an industrial recession may lower EUA demand in 2023. Citi expects EU ETS emissions to decline YoY against a backdrop of falling demand.
However, emissions on the whole should continue to exceed the amount of EUAs released to the market in 2023 which means the market will remain short, albeit a lot less short than in 2021 and 2022 pointing to a range bound trading year for EUA futures with Citi forecasting prices to average around 75 euros in 2023.
Chart 2: EU ETS annual balance and price forecast
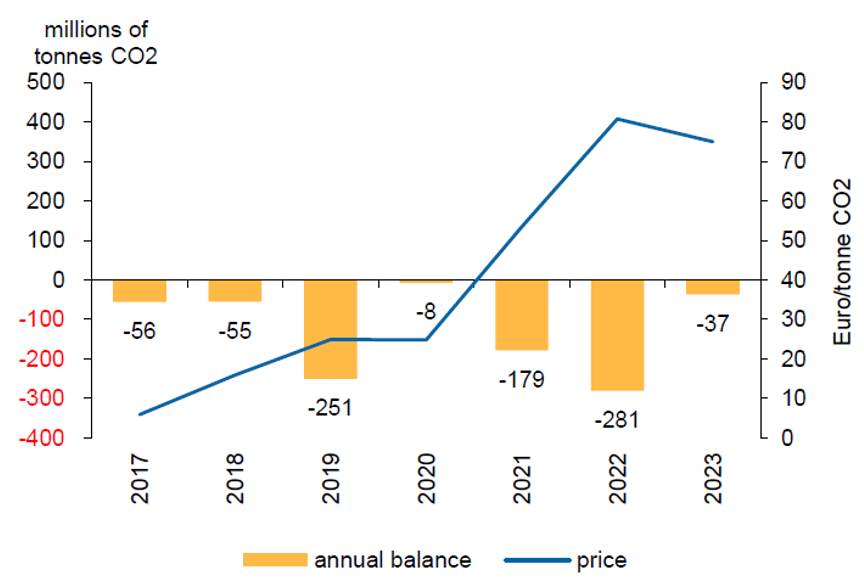
Source: Citi
Long term outlook
We are bullish on the long-term outlook for European carbon prices as they remain the policy tool of choice for incentivising abatement. Morgan Stanley takes a similar view “We continue to see the case for structurally higher EUA carbon prices ahead to support the decarbonisation of industry. We consider this objective to be synonymous with energy security as much as climate action.”
Citi Bank estimates that by the end of 2023 total ETS emissions will still be 500 metric tonnes higher than the 2030 annual cap, highlighting the need to large scale decarbonisation in the second half of the decade. Of note is Citi’s recent comment, “despite a steepening contango of rising costs of carry, we continue to believe the market is underestimating the long-term EUA price.”
Furthermore, over the past year and a half several major commodity houses and corporates in the oil and mining space have expanded their carbon trading desks. Exchanges offering futures contracts offerings are expanding rapidly, supporting a new breed of carbon financial products. In turn this is creating enhanced liquidity and enabling different participants to enter the market.
Explore our dedicated carbon credits blog to learn more about developments in global carbon markets, the price of carbon, carbon credits and gaining exposure to this new asset class via ETFs.
More active involvement of investors should act as a key catalyst for more efficient price discovery, a greater easing of Europe’s energy crunch and therefore a reduced risk of another intervention by policymaker’s onto the bloc’s carbon market.
Chart 3: EU carbon market balance (Mt)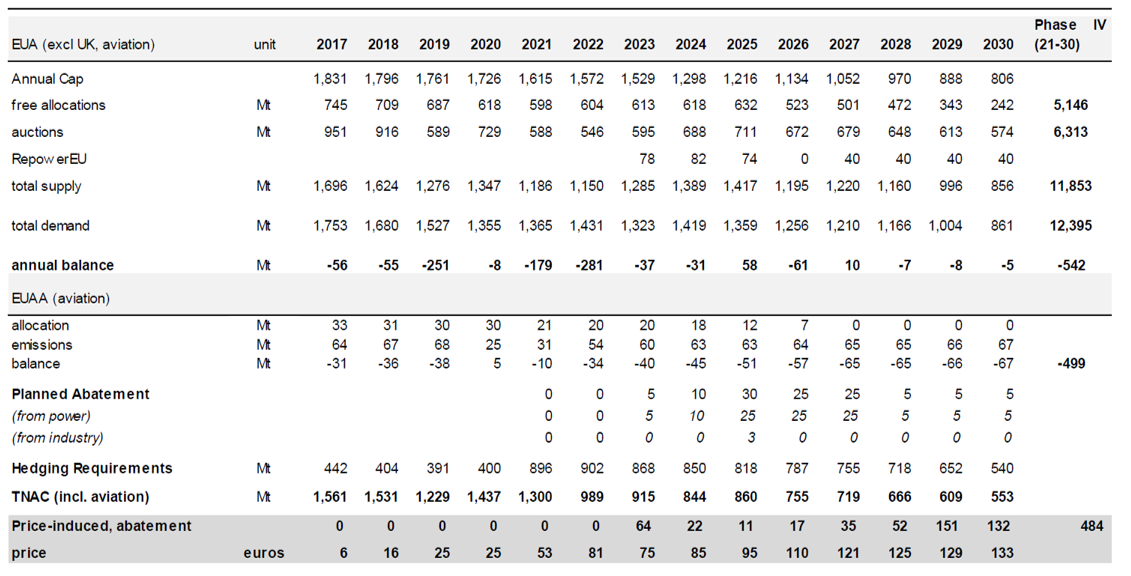
Source: BNEF, Energy Aspects, Macquarie commodity strategy, November 2022
UK ETS
Citi sees even greater upside potential in the UK ETS scheme as structurally the UK ETS remains a very tight market with the annual cap to shrink from 147 Mt in 2023 to 50Mt in 2030. Displacement of gas-fired power generation and an increase in power imports may be needed to meet the climate target alongside industrial emission reduction. Citi says “estimated planned renewable expansions in the UK will cut power from 44Mt to 26Mt by 2030 but this is not sufficient to meet the climate target (cumulative surplus goes negative meaning there would be a shortage of UKAs leaving compliance entities unable to meet their obligations) a further 10Mt of market-driven abatement is required according to our modelling.”
Chart 4: Planned abatement from renewable capacity is not enough to balance the UK ETS
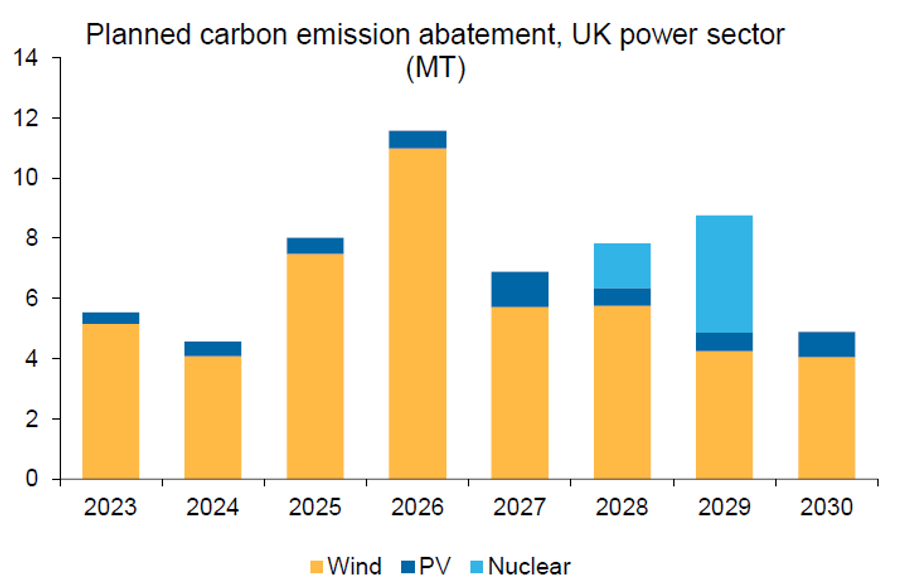
Source: Citi
Chart 5: UK carbon market balance (Mt)
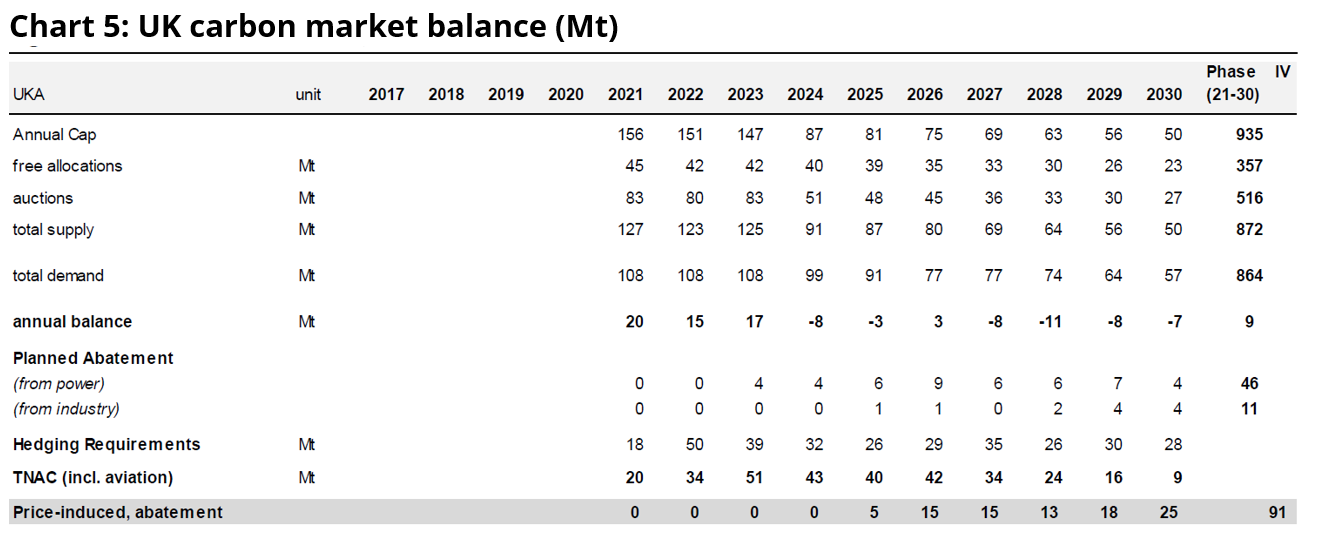
Source: BNEF, Energy Aspects, Macquarie commodity strategy, November 2022


Published: 12 December 2022
Any views expressed are opinions of the author at the time of writing and is not a recommendation to act.
VanEck Investments Limited (ACN 146 596 116 AFSL 416755) (VanEck) is the issuer and responsible entity of all VanEck exchange trades funds (Funds) listed on the ASX. This is general advice only and does not take into account any person’s financial objectives, situation or needs. The product disclosure statement (PDS) and the target market determination (TMD) for all Funds are available at vaneck.com.au. You should consider whether or not an investment in any Fund is appropriate for you. Investments in a Fund involve risks associated with financial markets. These risks vary depending on a Fund’s investment objective. Refer to the applicable PDS and TMD for more details on risks. Investment returns and capital are not guaranteed.