Expert analysis: Accessing China’s growth
As the world emerges from COVID induced lockdowns, economies around the world are recovering at different speeds. As the first into the COVID-19 crisis, China is among the first out. Despite geopolitical issues, smart investors, like Charlie Munger, remain bullish on the country and the opportunity.
Noting the well-reported crackdowns in China earlier in the year, Mr Munger made a number of observations similar to what we noted earlier in the year. We said some of these regulatory moves are sensible:
- Tightening up on the (mis)use of personal and potentially sensitive data
- Providing decent, affordable, quality education
- Providing occupational insurance for “gig” workers
- Preventing monopolistic behaviour and enhancing competition
- Opening up the financial system to wider foreign participation.
The reality is China is an economy still undergoing profound transformation in which consumer-oriented sectors are gradually replacing heavy industry and low cost manufacturing as the country’s economic engines.
China’s new economic growth is being driven by:
- Rapid urbanisation and growth of the middle class;
- Rising income in this flourishing new middle class;
- The largest millennial generation population in the world;
- A burgeoning domestic technology sector; and
- Rising living standards for all Chinese.
The ‘new economy’ sectors especially benefiting from this transformation are:
-
- Technology;
- Healthcare;
- Consumer staples; and
- Consumer discretionary.
ETFs have been at the forefront of innovation allowing investors to access this opportunity. However, some products are restricted by the investment manager’s licencing, so they must design products with these limitations in mind. This is often at the expense of opportunities that they cannot access.
Many ‘new economy’ companies are listed on mainland China's two major stock exchanges, the Shanghai and Shenzhen exchanges. Combined, those exchanges form the second largest share market in the world after the US. The difficulty for Australian investors wanting to invest in this growth opportunity is gaining access to mainland A-shares. VanEck gives investors unequivocal access to China A-Shares via its RQFII licence that allows for deeper and broader access and generally better risk management. Only a handful of Australian fund managers are able to offer this access, without it your China exposure may be limited.
The China equities alphabet soup
A-shares are companies incorporated and listed in China. Foreigners can only access all these stocks with a QFII or RQFII licence – of which there is only a handful in Australia and VanEck has one of them. There are nearly 4,000 A-shares and it is by far the largest China equity category. Some but not all A-shares can be also be accessed by the Stock Connect platform in Hong Kong.
H-Shares are the next most common, there are around 300 of these and they are available through the Hong Kong exchange.
P-Chips are privately controlled companies that are also available on the Hong Kong exchange.
Red Chips are state controlled companies listed in Hong Kong.
N-Shares are listed on the New York exchange
ADRs are American Depository Receipts and are a popular way for investors to invest in foreign (ex-US) companies, including China, on the US exchange.
Due to accessibility, funds with the alphabet of China equities, excluding A-Shares, became the norm. For investors wanting to access ‘China growth’, this exposure is not optimal because you are overlooking the biggest category of China equities.
Enter VanEck and its China New Economy ETF (CNEW). CNEW includes 120 China A-shares, equally weighted, from the Healthcare, Consumer Staples, Consumer Discretionary and Technology sectors, all with the best Growth at a Reasonable Price (GARP) attributes. Companies are selected on the basis of the strength of 24 fundamental indicators across four factor categories:
- Growth;
- Value;
- Profitability; and
- Cash flow.
Let’s walk through the differences between CNEW, the FTSE China 50 Index, and a niche Asia tech index which is being used by investors to access the ‘China growth story’, because recent performance highlights the importance of understanding your exposure.
The below shows CNEW provides A-Share exposure with greater exposure to the China consumer and therefore better exposure to the ‘China growth story’. The FTSE China 50 Index includes only large Chinese companies listed in Hong Kong so has no A-Shares1. The Asia tech index2does not include any A-shares either, getting its China exposure via H-shares and red-chips and it also includes companies that capture the broader Asian market including Taiwan, South Korea and India. Some of these markets are expensive and this is reflected in its valuations.
We believe CNEW prices the regulatory risks associated with Chinese investments better than other options.
CNEW vs FTSE China 50 Index vs Asia Tech Index
Table 1: Statistics and fundamentals|
|
CNEW |
FTSE China 50 Index |
Asia Tech index |
|
Index strategy |
Smart beta – Equal weight/GARP |
Market capitalisation |
Market capitalisation weight subject to 10% max |
|
Number of countries |
1 |
1 |
6 |
|
A-Share exposure |
100% |
0% |
0% |
|
Number of holdings |
120 |
50 |
50 |
|
Return on equity (ROE) (%) |
21.75 |
20.90 |
12.63 |
|
Financial leverage (Long term debt to capital) (x) |
5.01 |
17.47 |
14.46 |
|
Historic 3 year earnings per share (EPS) growth (%) |
47.80 |
21.10 |
12.70 |
|
Price to earnings (P/E) |
21.40 |
13.90 |
19.40 |
|
Price to book (P/B) |
3.45 |
2.00 |
3.17 |
|
Price to sales (P/S) |
2.55 |
2.03 |
2.70 |
In terms of growth metrics, CNEW has higher ROE, lower debt to equity and a higher EPS growth rate. The FTSE China 50 Index is cheaper on P/E, P/B and P/S metrics.
There were many reasons Chinese companies listed outside of China in the past. Among these was access to growth in global markets and capital. This is changing, and we expect less and less Chinese companies to list offshore. It is worth noting a recent China Securities Regulatory Commission (CSRC) statement made on 1 August, prompted by the recent moves by the US’s Securities and Exchange Commission to require more disclosure from Chinese companies seeking to list in America. The CSRC stated, “China is unswervingly committed to its basic state policy of reform and opening up. The financial services sector of China will open wider to the outside world and more opening-up measures will be rolled out to serve the high-quality development of China’s capital markets … We see great certainty in the prospects of sustainable and healthy development of China’s capital markets”.
China worked hard to have A-Shares included in MSCI and FTSE indices so is not antagonistic toward foreign money. It wants to strengthen its domestic economy and encourage capital to go to industries it wants to develop and stay away from areas it deems a threat to the common good. These will be A-Shares.
As you would expect the A-Shares in CNEW and H-Shares in the FTSE China 50 Index have greater income derived from China and thus greater exposure to the China growth story.
|
|
CNEW (%) |
FTSE China 50 Index (%) |
Asia Tech index (%) |
|
Asia including China |
81.9 |
89.6 |
71.1 |
|
North America |
7.3 |
4.5 |
16.7 |
|
Eurozone |
3.6 |
2.4 |
4.2 |
|
Japan |
1.7 |
1.0 |
2.5 |
|
Latin America |
1.0 |
0.4 |
1.8 |
|
Unclassified |
0.9 |
- |
- |
|
UK |
0.9 |
0.7 |
1.0 |
|
Europe - Emerging |
0.8 |
0.6 |
0.9 |
|
Middle East |
0.7 |
0.3 |
0.7 |
CNEW vs FTSE China 50 Index vs Asia Tech Index - Recent China government interventions
No investor likes to lose money, and there is no question that recent Chinese government intervention has had an impact on markets. Investors have always appreciated regulatory risk in Chinese equities. Emerging markets equities, including China A-shares, have historically traded at a discount to developed markets. It would seem that some parts of the market were not fully pricing that risk in.
A measure called ‘drawdown’ shows the distance of an investment’s highest peak to its deepest valley. Investment professionals use it to show how they mitigate losses, that is, they lose less when markets fall. The chart below shows the drawdown of CNEW versus the FTSE China 50 Index and the Asia tech index since its inception. You can see that in the most recent period of drawdown, CNEW’s fall was not as far as the other two indices and it has recovered its 2021 losses. CNEW lost less, and recovered faster, in other words, the regulatory risk in China was priced-in better for CNEW over this period.
Chart 1: Drawdown performance since CNEW inception date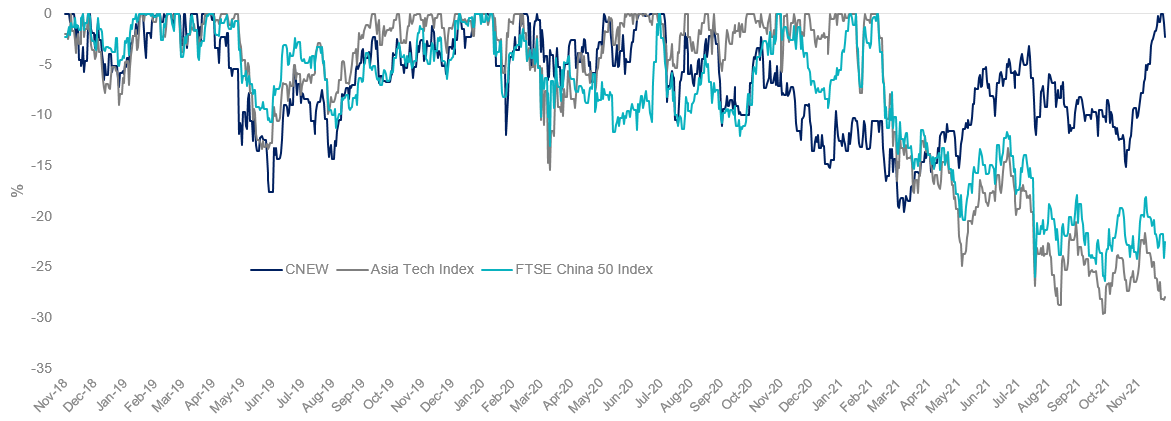
*Inception date of CNEW is 8 November 2018
Source: Morningstar Direct, VanEck as at 7 December 2021. The chart and table above show past performance of CNEW, the Solactive Asia Ex-Japan Technology & Internet Tigers Index and the FTSE China 50 Index. You cannot invest directly in an index. Results are calculated to the last business day of the month and assume immediate reinvestment of distributions. CNEW results are net of management fees and other costs incurred in the fund, but before brokerage fees and bid/ask spreads incurred when investors buy/sell on the ASX. Returns for periods longer than one year are annualised. Past performance is not a reliable indicator of future performance. The FTSE China 50 Index is designed to measure the performance of 50 of the largest and most liquid Chinese companies which trade on the Hong Kong Stock Exchange. The Solactive Asia Ex-Japan Technology & Internet Tigers Index (“Asia tech index”) is shown for comparison purposes, comprising the 50 largest technology and online retail stocks in Asia (ex Japan), weighted by market capitalisation with a maximum capping at 10%. The CNEW Index measures the performance of 120 China A-shares with the best growth at a reasonable price (GARP) attributes at rebalance. The CNEW Index has more companies and sectors and different allocations to the Asia Tech Index and the FTSE China Index. Click here for more details
And this has been reflected in the recent performance. In November, CNEW returned 15.29%.
|
As at 30 November 2021 |
|||||||
|
1 |
3 |
6 |
CYTD |
1 Year |
3 Year |
Since |
|
|
CNEW |
15.29 |
13.08 |
6.56 |
16.60 |
14.07 |
27.51 |
27.05 |
|
Asia Tech Index |
0.21 |
-6.13 |
-10.95 |
-10.47 |
-6.28 |
24.68 |
24.32 |
|
FTSE China 50 Index |
-0.42 |
-3.77 |
-10.20 |
-10.34 |
-13.19 |
1.23 |
1.27 |
Source: Morningstar Direct, VanEck. The chart and table above show past performance of CNEW, the Solactive Asia Ex-Japan Technology & Internet Tigers Index and the FTSE China 50 Index. You cannot invest directly in an index. Results are calculated to the last business day of the month and assume immediate reinvestment of distributions. CNEW results are net of management fees and other costs incurred in the fund, but before brokerage fees and bid/ask spreads incurred when investors buy/sell on the ASX. Returns for periods longer than one year are annualised. Past performance is not a reliable indicator of future performance. The FTSE China 50 Index is designed to measure the performance of 50 of the largest and most liquid Chinese companies which trade on the Hong Kong Stock Exchange. The Solactive Asia Ex-Japan Technology & Internet Tigers Index (“Asia tech index”) is shown for comparison purposes, comprising the 50 largest technology and online retail stocks in Asia (ex Japan), weighted by market capitalisation with a maximum capping at 10%. The CNEW Index measures the performance of 120 China A-shares with the best growth at a reasonable price (GARP) attributes at rebalance. The CNEW Index has more companies and sectors and different allocations to the Asia Tech Index and the FTSE China Index. Click here for more details
While each strategy has its merit for portfolio inclusion, for those investors seeking the ‘China Growth Story’ we think CNEW provides a better exposure to mainland China. It offers A-Share exposure to the four sectors of China’s New Economy.
Past performance is no guarantee of future performance. The above is not a recommendation. Please speak to your financial adviser or stock broker.
For further information, contact us via email or call us on +61 2 8038 3300.
1 - FTSE China 50 Index includes 50 of the largest and most liquid Chinese companies which trade on the Hong Kong Stock Exchange that is H-Shares.
2 - Solactive Asia Ex-Japan Technology & Internet Tigers Index
Key risks
An investment in CNEW carries risks associated with: China; financial markets generally, individual company management, industry sectors, ASX trading time differences, foreign currency, sector concentration, political, regulatory and tax risks, fund operations, liquidity and tracking an index. See the PDS for details. No member of the VanEck group of companies guarantees the repayment of capital, the payment of income, performance, or any particular rate of return from any fund.


Published: 10 December 2021