Navigating China's post-pandemic economy: A closer look for investors
China's post-pandemic economy isn't as straightforward as it seems. Looking beyond the bearishness, there may still be opportunities for discerning investors.
Pessimism is looming in the Chinese financial market as post pandemic recovery fizzles out. Notwithstanding that there are headwinds from the real estate sector and the local government debt build-up, we think the situation is multi-faceted and might be less pessimistic than most mainstream headlines portray.
Over the past two decades, China’s growth engine has relied on three pillars – investments (in infrastructure, manufacturing and real estate), exports and consumption. In particular, the property sector has done some heavy lifting through continuous borrowing from banks and selling off-the-plan units, whilst infrastructure like transport network and urbanisation initiatives have been funded via local government financing vehicles (LGFVs) and State-owned enterprises (SOEs). The charts below show that both private and government debt have been ratcheting up to 194% and 21% of the nominal GDP respectively.
Chart 1: China's Private Debt - % of Nominal GDP from Dec 2013 to Jun 2023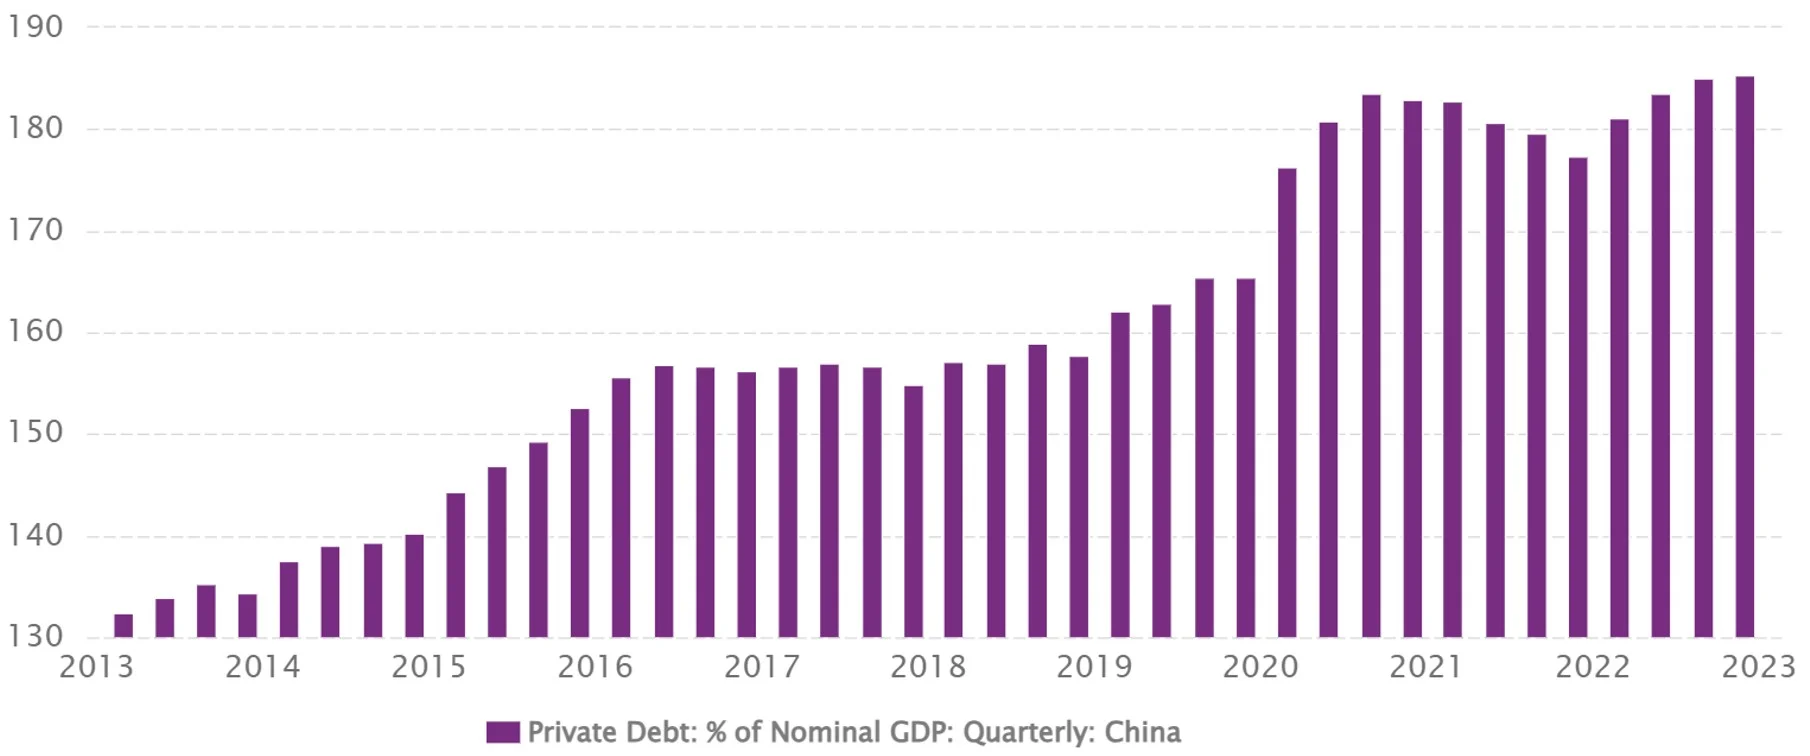
Source: CEIC Data
Chart 2: China's Government Debt: % of GDP from Mar 2014 to Mar 2023
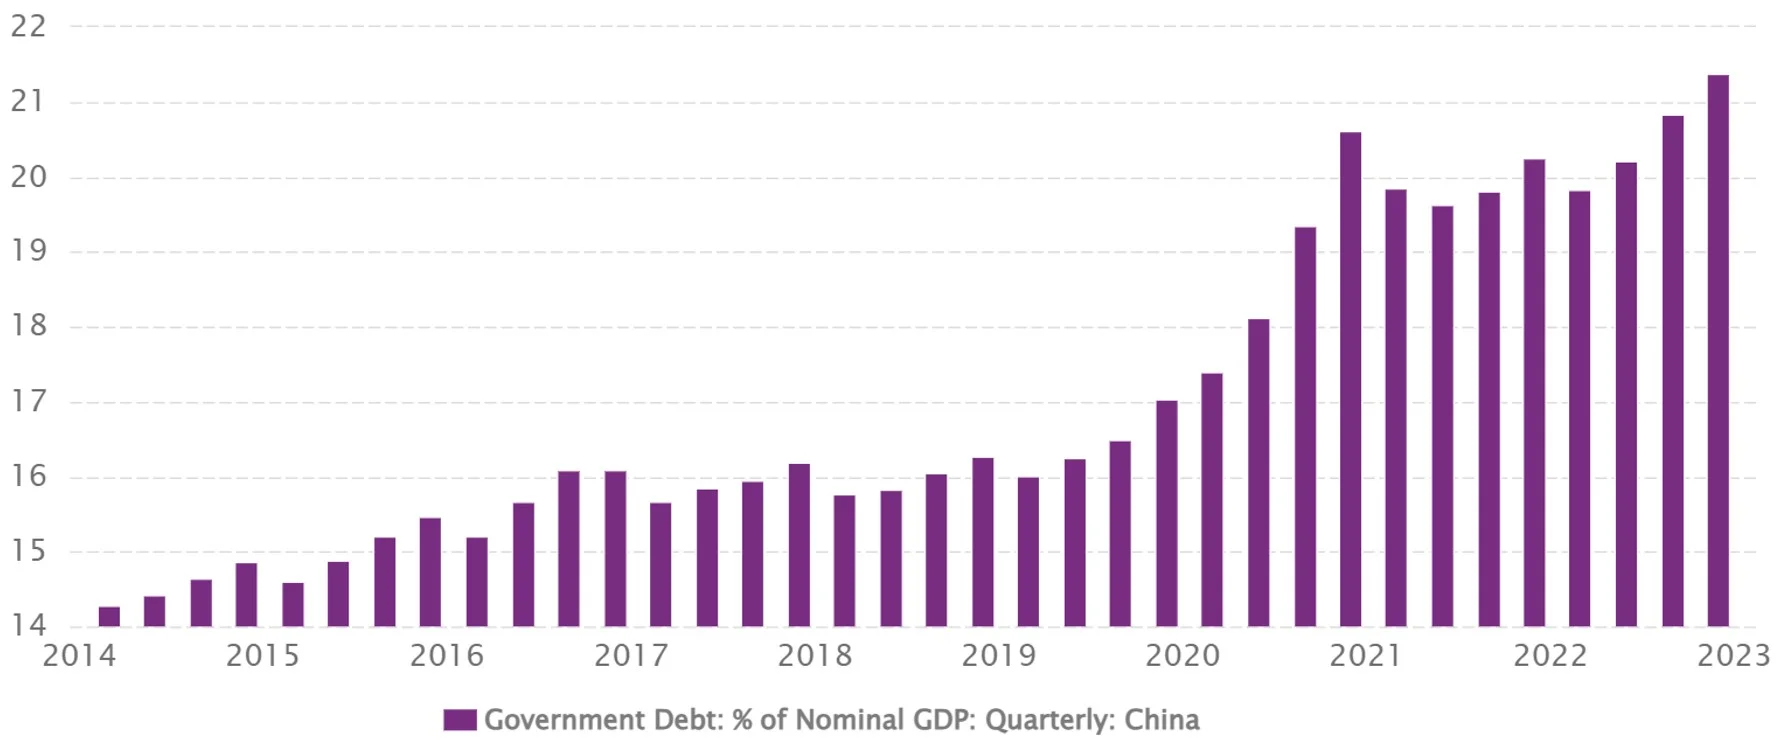
Source: CEIC Data
Historically speaking, in 2007 the US households and corporates experienced massive default and debt write-off, followed by aggressive government stimulus and economy recovery from 2012. Whereas Japan in the 1990s did not write off debt in the housing bubble, instead letting the economy have the slow-burn. In one of their recent notes, Morgan Stanley talked about the 3D problem China is facing – debt, deflation and demographics, and it was an issue that was first discussed back in 2013.
It drew similarities and differences between China and Japan in the ‘90s. We would argue that Chinese asset price corrections and the ripple effect through the banking system will likely be more moderate than Japan’s given preemptive de-leveraging/supply side reforms. Some of the considerations that differentiate China from Japan in the past:
- Property asset prices did not inflate as drastically as Japan did. The equity market echoed the same trend – it’s estimated that the Chinese equity market cap has fallen to 67% of the GDP from a recent peak of 80% vs a peak of 142% in Japan.
Chart 3: Japan’s asset prices rose more significantly relative to its GDP
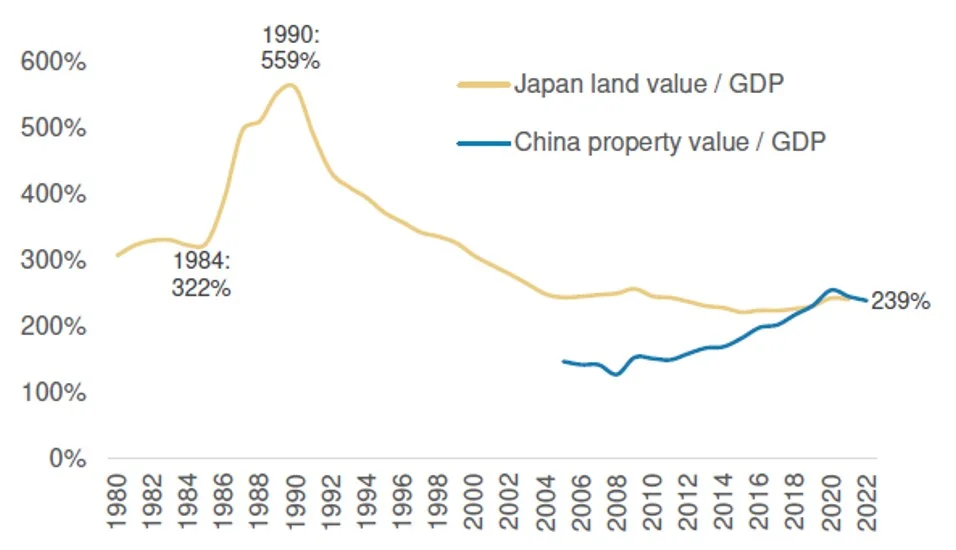
Source: NBS, MOHURD, Japan Cabinet Office, CEIC, Morgan Stanley
- Japan had the mistake of keeping the real rates too high during the deleveraging process and caused the economy in the deflationary territory for decades. China, on the other hand, still enjoys higher real GDP growth relative to the real rates.
- Uncertainties lie in the geopolitical risks with the US, which may create noises for recovery in China.
One of the reasons there is a lot of bearishness on China is the doubt of resilience of the Chinese financial system. The following chart shows the relative-strength (R/S) of China’s financial sector versus China’s broad stock market and the equivalent US measures. The R/S indicator helps identify stocks that have performed well relative to a relevant benchmark. As shown in the chart, the R/S measure for China has been trending upward since Q3 2021 above 1 and is up 3.4% in 2023. On the other hand, the complacency towards the U.S. economy thus far appears to have left the worsening financial conditions behind - the R/S of U.S. financials versus the S&P 500 plunged since the early 2023 highs and is down 16.9% in 2023.
Chart 4: Relative-strength of financial sectors in China and the US
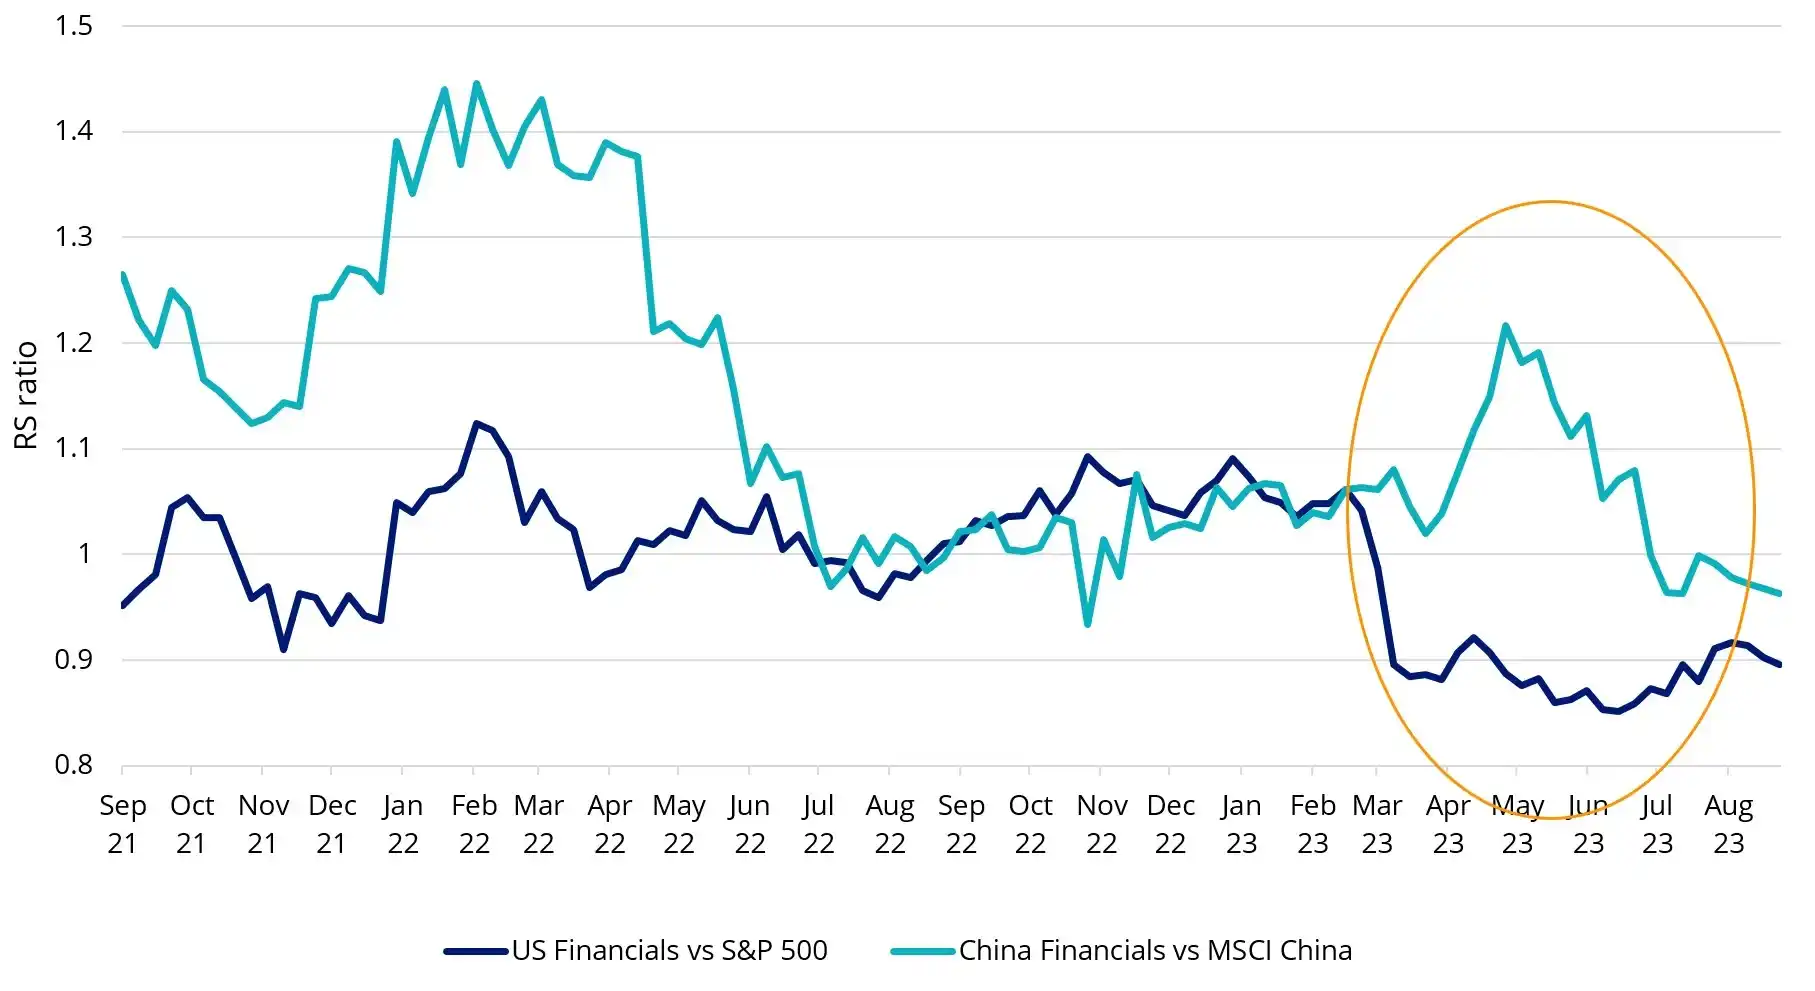
Source: Bloomberg as at 1 September 2023. US Financials represented by S&P 500 Financials Sector GICS Level 1 Index. China Financials represented by MSCI China Financials Index.
While the western economies have demonstrated a level of resilience in a high-inflation backdrop, either soft or hard landing cannot be ruled out yet in 2024. China, on the other hand, has yet to get inflation back up. The equity market also has gone back to square one from the April high, with FTSE China A50 Index returning -1.41% and MarketGrader China New Economy Index -2.73% year to date1. The correlation between the country’s benchmark index CSI 300 and the US, as well as with MSCI World, has gone negative since over a year ago. We think a tactical allocation in China could provide a buffer should developed markets’ economic conditions worsen.
Chart 5: 36 month rolling correlations
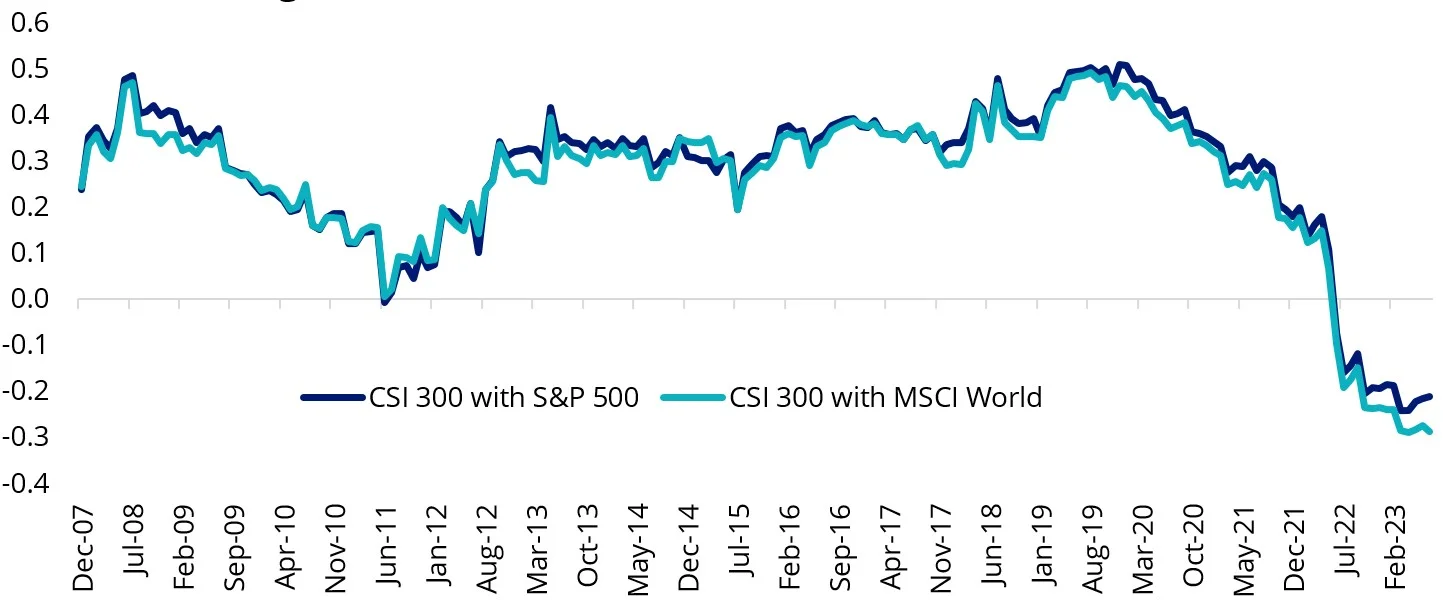
Source: MarketGrader, as at 31 July 2023
With respect to exports – one of the growth pillars – experienced notable slowdown in the recent months. Naturally China is not immune from trade recession risks amid demand slowdown from the developed markets, but the country could still be an outperformer in the APAC region due to its wide range of trading partners as well as product offerings including mechanical & electrical, high-tech and labour-intensive products.
One emerging trend is that China is expanding its trading partner lineup. Financial Times reported that for the first time ever, China exported more in the early part of this year to the developing world — as represented by the countries that make up the Belt and Road Initiative — than it exported to the US, EU and Japan combined2.This could rise further following the announcement that BRICS invited Argentina, Egypt, Ethiopia, Iran, Saudi Arabia and the United Arab Emirates as new members. This expansion marks a historical milestone in strengthening areas like trade and investment, energy and resources, as well as food security and cross-border payment. These developing nations are going to be the fastest-growing economies with young demographics and rising living standards, and to continuously contribute more to the global GDP growth.
Chart 6: % of Total Chinese Exports
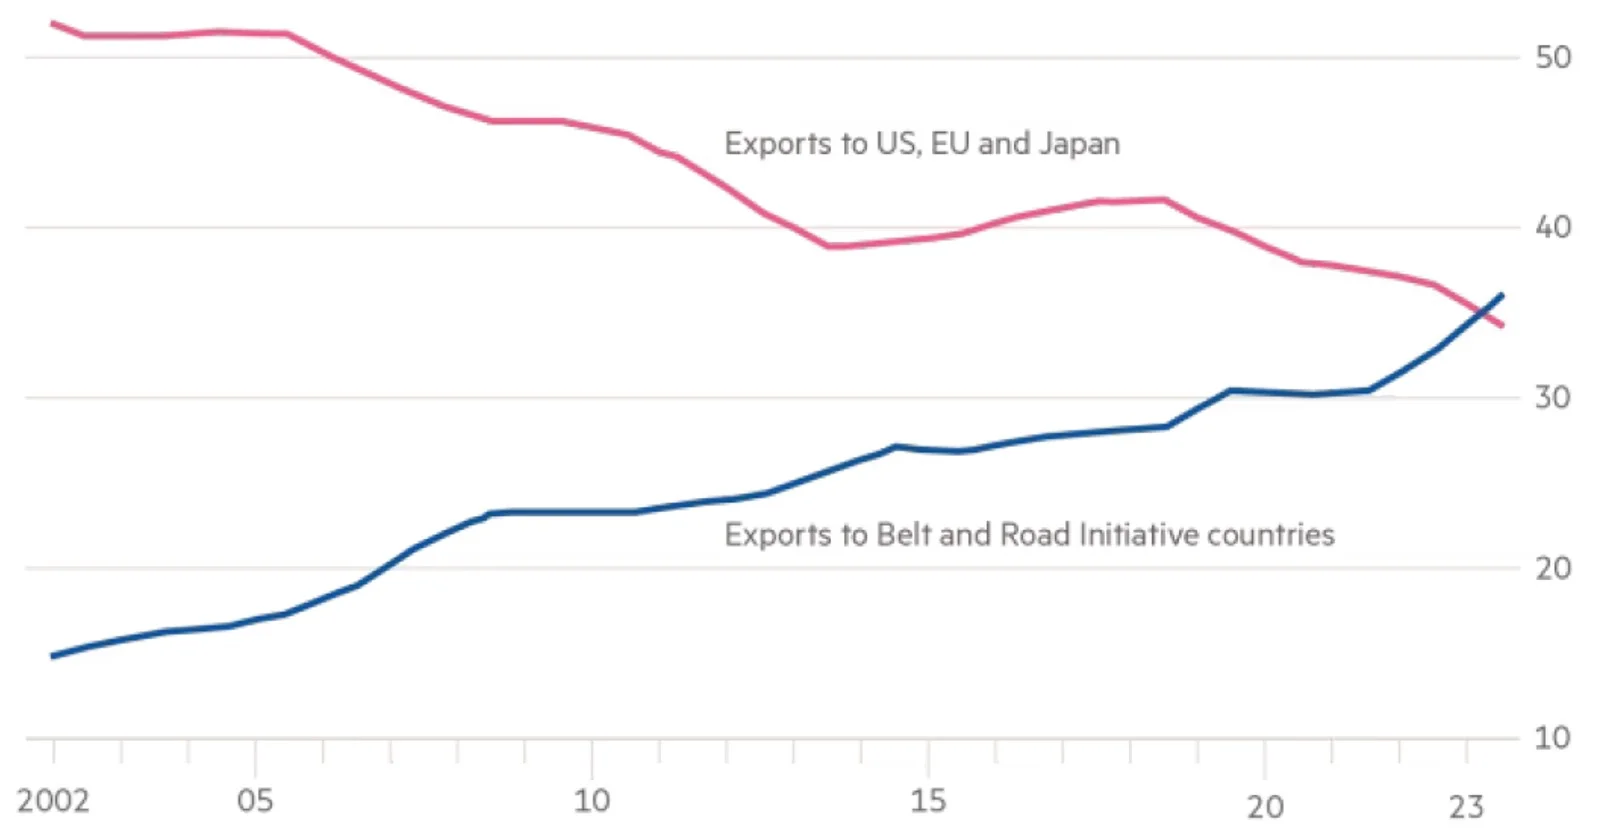
Source: Wind; Dongwu Securities; FT. 2023 is through April
Related to exports is the country’s currency weakness against the greenback since the start of year, primarily driven by the widening interest rate differential between China and the US, shown in the chart below. A weaker currency makes exports more attractive for foreign buyers, but makes imports more expensive.
Chart 7: Yield Differential and Exchange Rates – China vs the US
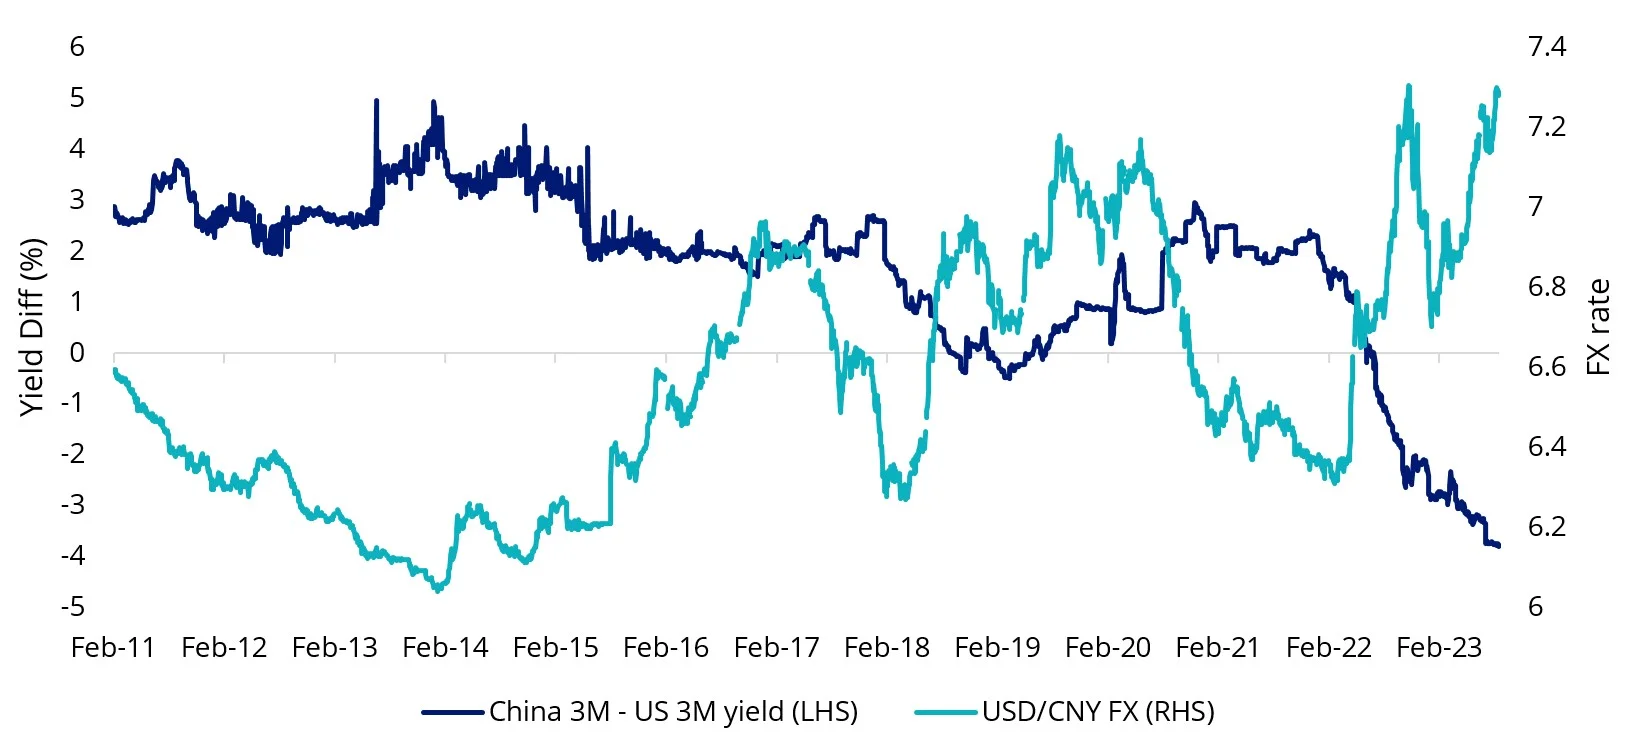
Source: Bloomberg as at 25 August 2023
Timeline of RMB fixings over the last two decades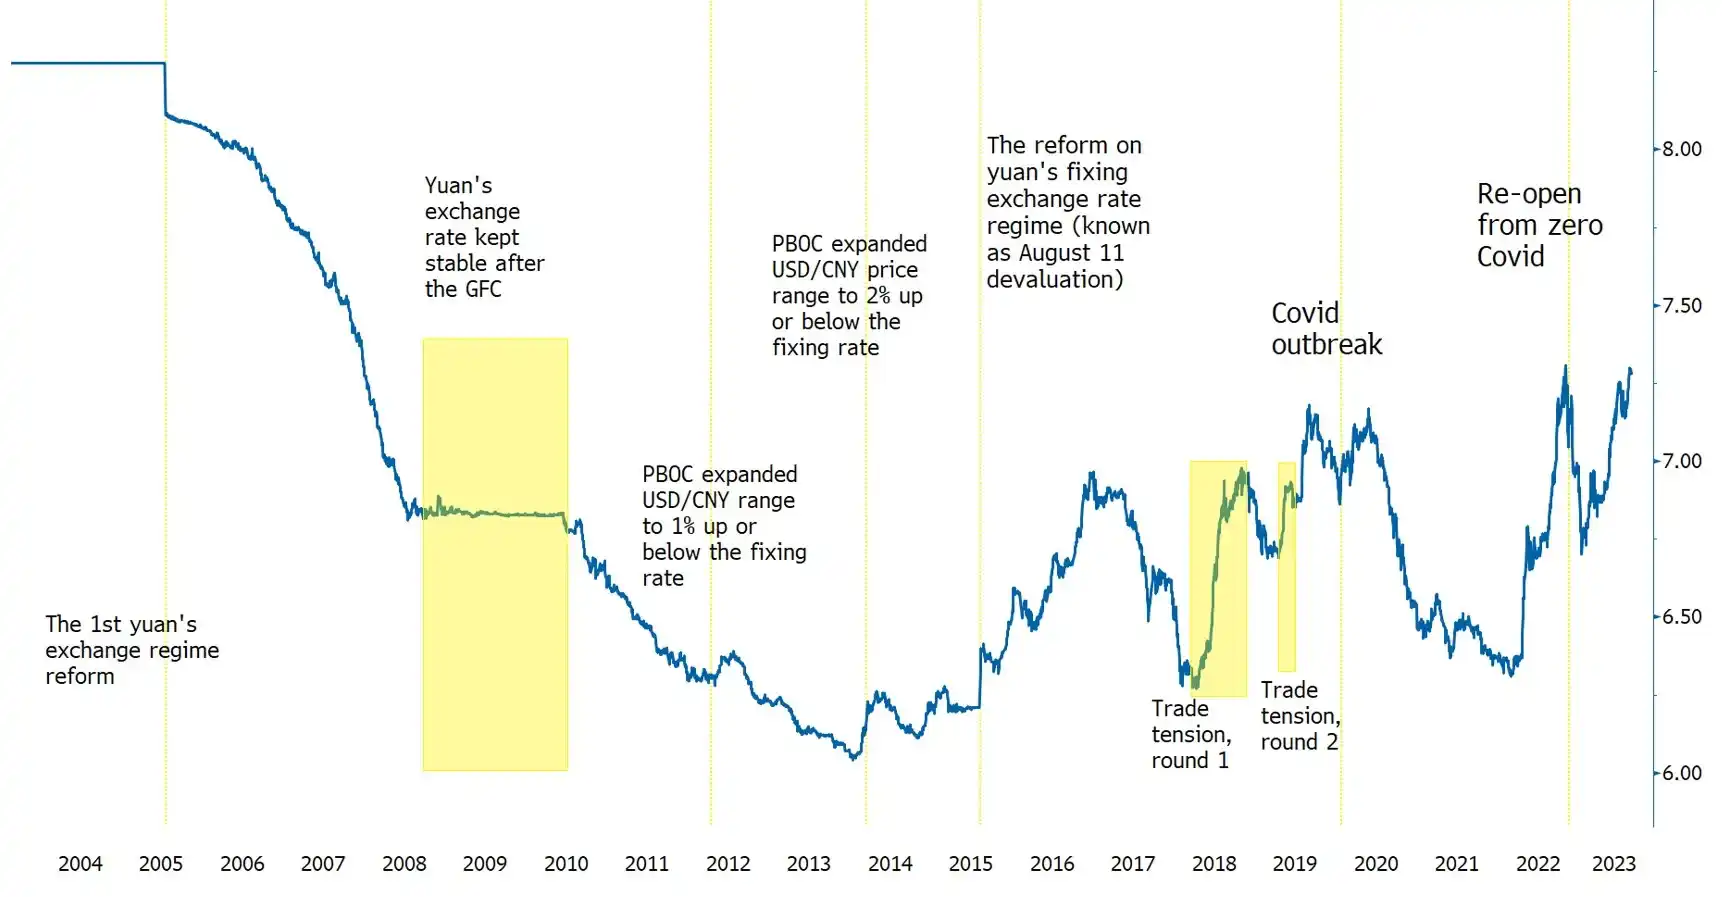
Source: Bloomberg, data as at 25 August.
The Politburo meeting in July called for RMB stability on a reasonable equilibrium level, and the PBoC echoed in its Monetary Policy Report in August. The officials certainly have the tools to maintain a stable FX market with ample FX reserves of US$3.2tn, and have vowed to correct pro-cyclical and one-sided market behaviours to prevent RMB overshooting.
Post the Politburo meeting, a slew of policies was announced to prop up the economy:
| Month | Monetary | Fiscal | Property | Industry |
| July |
|
|
|
|
| August |
|
|
|
|
What investors need to see is supportive pro-growth measures following through at this juncture. We hold the contrarian view that China may still offer some opportunities with selectivity in mind. Some sectors are better positioned for recovery. In our view, the consumer sector may be one of the bright spots, in particular travel and leisure. The upcoming National Day holiday in October could be a moment for Chinese consumers to unleash the spending power, given the resumption of travel group tours to overseas destinations to the US and Australia. Polices are now being delivered to promote stock market trading, from exchange fee cost reduction (from 0.00487% to 0.00341%) for the Shanghai Stock Exchange (SSE) and the Shenzhen Stock Exchange (SZSE), to pledging for more stock investments by the country’s pension fund and some large-scale banks and insurers.
All in all, Beijing is on a mission to keep the promise of 5% GDP growth this year. We see Q3 and Q4 this year as a period of intensive policy actions to revive confidence. China has been decisive in the past to tackle economic challenges in the GFC era, as well as the 2015-2016 deleveraging period. Should sentiment turn around, this could favour investors who stay invested in China.


Published: 05 September 2023
Sources:
1As at 24 August 2023.
2Financial Times. https://www.ft.com/content/8ac52fe7-e9db-48a8-b2f0-7305ab53f4c3
Any views expressed are opinions of the author at the time of writing and is not a recommendation to act.
VanEck Investments Limited (ACN 146 596 116 AFSL 416755) (VanEck) is the issuer and responsible entity of all VanEck exchange traded funds (Funds) listed on the ASX. This is general advice only and does not take into account any person’s financial objectives, situation or needs. The product disclosure statement (PDS) and the target market determination (TMD) for all Funds are available at vaneck.com.au. You should consider whether or not an investment in any Fund is appropriate for you. Investments in a Fund involve risks associated with financial markets. These risks vary depending on a Fund’s investment objective. Refer to the applicable PDS and TMD for more details on risks. Investment returns and capital are not guaranteed.