Emerging in China: A look at liquidity, A-shares and sector trends
Liquidity improvements and broad sector themes should come into focus for China in 2018.
China's economic growth in 2017 accelerated for the first time in seven years. As we look at what this could mean for 2018, several key themes are already coming into focus as areas to watch.
Signs of improving liquidity
According to analysts, the implementation of targeted reserve requirement ratio (RRR) cuts in 2018 will likely lead to notable improvement in market liquidity. Market rates are expected to drop and the Contingent Reserve Allowance—the regular reverse repurchases and the medium-term lending facilities (MLF) established by the People's Bank of China—indicates that banks may be able to meet the significant liquidity needs brought about by maturing instruments in January.
The beginning of allocation
China's economy grew 6.9% year-on-year in 2017. Its fourth quarter gross domestic product (GDP) grew 6.8% year-on-year, slightly beating expectations and signalling that growth is stabilising. 2018 looks to be a year of full allocation to China A-shares.
In Hong Kong, the short-term stock market correction that started at the end of November drew to a close in mid-December, and Hong Kong equities have returned to an uptrend. Southbound Stock Connect trading continued to see a net buying of Hong Kong equities in the latter half of December, with banking, property, and technology (chips and 5G related) stocks seeing the most net inflows. The absence of more stringent property regulations from the Central Economic Work Conference has reversed the market's pessimistic outlook on the real estate market.
The US Dollar Index, which measures the value of the US dollar against a basket of foreign currencies, continued its slide after the US tax reform bill was passed, while the rise in commodities, such as nonferrous metal and crude oil, fuelled a rally in stocks in related sectors.
5 trends to watch in China's sector rotation:
- Demand on service level (hospitality, logistics, and food & beverage) providing increasing contributions to GDP
- Wealthy aging population leading healthcare and pharmaceutical consumption
- Environmental protection receiving more attention from policymakers
- Continuing adoption of technology innovation throughout everyday lives
- Supply side reform strengthening industrial productivity
VanEck Vectors® ChinaAMC CSI 300 ETF (CETF)
Constituent Returns by Sector - 2017
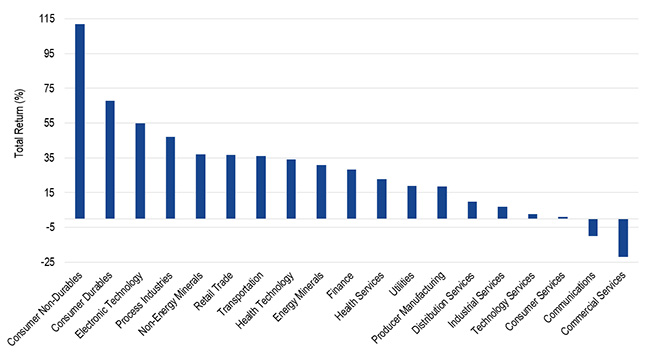
Source: Factset. Data as of 31/12/2017. Returns in US dollars. Performance data quoted represents past performance which is no guarantee of future results and which may be lower or higher than current performance. Investment returns and ETF share values will fluctuate so that investors' shares, when redeemed, may be worth more or less than their original cost. Current performance may be lower or higher than performance data quoted. Australian dollar performance current to the most recent month-end can be obtained at www.vaneck.com.au/funds/cetf/Performance/.
Related Insights


Published: 09 August 2018