China growth – glass half full or half empty?
China’s Q2 growth slowdown was not as sharp as feared. The data flow, financial stability considerations and the level of funding costs will determine if more policy easing is required going forward.
China’s Q2 GDP and June’s domestic activity indicators signal that growth is moderating, but the slowdown is not as sharp as feared. Given the COVID-related distortions, a sequential measure of growth (quarter-on-quarter) might be more appropriate to look at – and it beat expectations at 1.3%. There were some encouraging developments on the growth rebalancing front as well (in the form of stronger than expected June’s retail sales), albeit the consumption recovery is still lagging and growth remains driven by industry and external demand (exports). Anyway, the market looked quite content after the release – China’s major equity indices were up, and the renminbi traded stronger against the US dollar.
So, was China’s recent “blanket” cut in the reserve requirement ratios (RRR) for banks justified and does China need to do more easing? On the one hand, it does not look like the recovery is in danger (it is “steadying” but not “faltering”). Further, the progress in vaccinations should give an extra boost to services closer to year-end. However, the high funding costs for privately owned and smaller companies is a major structural stumbling block, and authorities believe the RRR cut should help to bring them down. The moral hazard weighing corporate defaults over inancial stability considerations, is another important layer. If China continues to fade its fiscal stimulus, we might see more support on the liquidity/monetary side. We will keep an eye on the upcoming Politburo meeting for more policy signals.
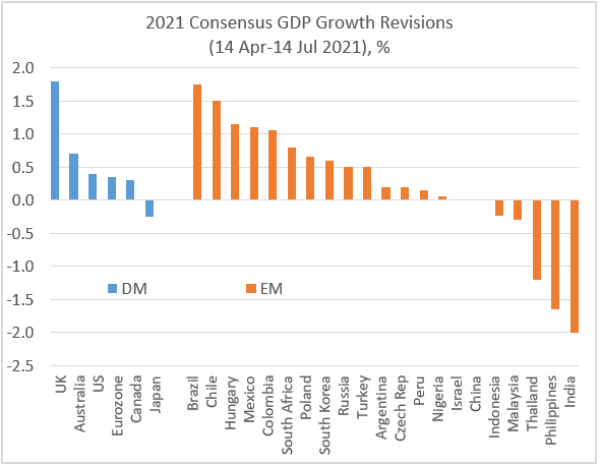
The consensus forecast for China’s 2021 growth had been stable. In regards to the rest of the world, analysts are much more decisive when it comes to changing their growth projections. Among developed markets (DM), the UK had the largest upgrade in the past three months, while Japan’s 2021 GDP forecast was cut alongside regional emerging markets (EM) (see chart below). EMEA’s 2021 GDP is still being lifted up (cautiously), but LATAM is on a roll, with the region’s 2021 growth projection 1.21% higher than just three months ago. Stay tuned!
Charts at a glance: EM growth revisions go both ways
Source: VanEck Research; Bloomberg LP


Published: 15 July 2021