Emerging markets - external buffers – key line of defense
Larger than expected international reserves, current account surpluses and overseas remittances provide strong external buffers for emerging markets in the coming months.
Remarkable resilience of external indicators in many parts of emerging markets (EM) is a logical consequence of orthodox policies, which are now used more widely than during the global financial crisis of 2008-09. These policies create not only much-needed “escape valves” (like FX) but also “safer havens” for investors in times of market pressures and external shocks, and they will remain important lines of defense in the coming months. EM international reserves is probably the best illustration of this new setup. There were only four months since the pandemic’s onset when EM reserves were down and they bounced back very quickly (see chart below). Total reserves are now 6% higher compared to January 2020 (and 10% higher if we exclude outliers like Turkey and China).
Current account adjustments that are becoming increasingly “textbook” is another success story. Emerging markets ended up having a larger than expected current account surplus in 2020 (just over 1% of EM GDP), and the latest projections suggest that the 2021 surplus could be just as big. The 2021 consensus forecast is still being “upgraded,” rising from 0.35% of GDP in December 2020 to 0.94% of GDP as of last week.
Finally, EM overseas remittances continue to exceed expectations, with most countries defying official “gloom-and-doom” scenarios and posting double-digit growth numbers year-to-date (following a very successful 2020). The inflows are often very sizable as a percentage of GDP. In the case of Mexico, remittances equaled 3.4% of GDP in 2020 and are getting close to 4% of GDP so far this year. This is not an insignificant amount as regards support for domestic consumption in the absence of a large-scale fiscal stimulus.
Chart at a glance: EM reserves – going from strength to dtrength
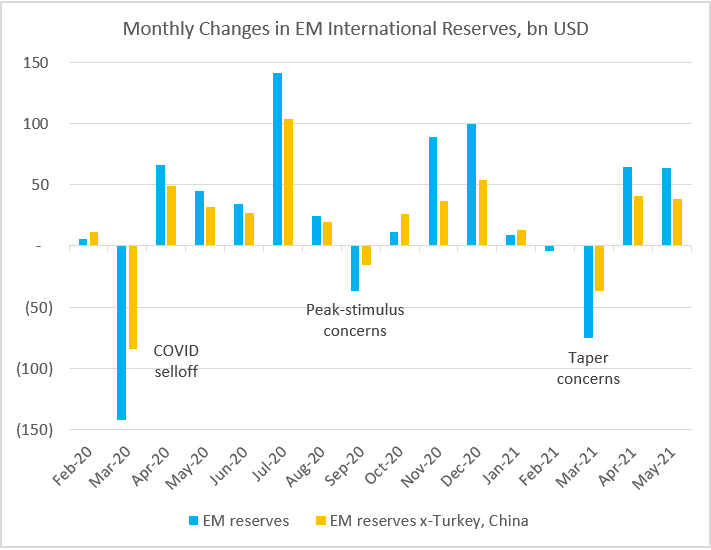
Source: VanEck Research; Bloomberg LP


Published: 29 June 2021