Emerging market equities analysis: EMKT vs the MSCI EM Index
Investing in emerging markets can be risky. That is why it is prudent to take the right approach.
Australian investors have been investing offshore for some time and the rise of ETFs has increased the opportunity set and further expanded the investment landscape. Investing in emerging markets makes sense. Emerging markets have been a key contributor to global growth. According to IMF data, Emerging markets accounted for 50.1% of Global GDP in 2023, and 66% of global GDP growth in the past 10 years (2013-2023). Emerging Markets are home to over 4.3 billion people with an average life expectancy of 75 years and a current median age of 34 years old. Emerging markets also contribute more to the global GDP than developed economies. Additionally, emerging markets are associated with sizable populations that are becoming increasingly affluent. As technology improves, many of these economies are undergoing fundamental shifts.
Despite these favourable demographics and growth potential, many Australian investors do not have exposure to emerging markets. Not all emerging market companies are desirable from an investment standpoint, many are state-owned enterprises and inefficiencies within these markets allow astute investors to take advantage of mispricing. Therefore, being selective in emerging market equities is important.
Importantly, when investing in emerging markets there are other risks to consider such as currency, geopolitical, economic, market and sector risks.
One of the reasons Australian investors may be apprehensive about investing in emerging markets is the high costs. It can be expensive to invest in these markets because brokerage fees are higher than in developed markets and these markets require specialist knowledge, so many investors have been happy to pay higher fees to have a professional active manager to select the best emerging markets opportunities.
As we know with active management, sometimes the returns are good, but often they are not. Many people also find this a poor bargain so seek lower-cost passive funds that track traditional indices. When it comes to emerging market equity investing in a passive fund, the widely used benchmark is the MSCI Emerging Markets Index, for ease of reading let’s call it the MSCI EM Index. But this index has the same problems as broader emerging markets, that is, not all companies in the index are desirable from an investment standpoint, many are state-owned enterprises and inefficiencies within markets mean mispricing could be rife.
Innovations in index design for passive funds have delivered above-market benchmark returns over the long term while retaining low costs. It is this approach VanEck offers in emerging market equities, and it is being used by savvy investors as a substitute for both.
VanEck MSCI Multifactor Emerging Markets Equity ETF (ASX: EMKT) tracks the MSCI Emerging Markets Multi-Factor Select Index (EMKT Index) and it provides investors with diversified access to companies that demonstrate four factors: Value, Momentum, Low Size and Quality. Factors are identifiable, persistent drivers of risk and return.
We recently released a white paper supporting this approach. In addition, taking a diversified approach across factors has been proven to produce outperformance over the long term compared to a benchmark market capitalisation approach in emerging markets.
So, let’s walk through the difference between EMKT and the MSCI EM Index.
EMKT vs MSCI EM Index – Fundamentals
Table 1: Statistics and fundamentals
| EMKT | MSCI EM | |
| Index strategy | Smart beta | Market capitalisation weight |
| Number of countries | 21 | 24 |
| Number of sectors | 11 | 11 |
| Number of holdings | 220 | ~1400 |
| 12mth trailing Dividend Yield (%) | 4.29% | 2.74 |
| Dividend frequency | Annually | - |
| ROE (%) | 17.90 | 15.90 |
| Hist 3Yr EPS Growth | 25.4 | 20.9 |
| Hist 3Yr EPS Sales Growth | 12.6 | 17.4 |
| Price to book (x) | 1.35 | 1.86 |
| Price to earnings (x) | 9.6 | 13.7 |
| Price to sales (x) | 0.75 | 1.25 |
| Price to cash flow (x) | 13.53 | 32.11 |
Source: FactSet as at 29 February 2024. Past performance is not a reliable indicator of future performance. You cannot invest directly in an index.
As you would expect, EMKT has lower price to book, price to earnings and price to cash flow. It also has higher earnings per share (EPS) growth and higher return on equity. While emerging markets are not typically associated with income, EMKT’s dividend yield has been higher than the market index.
EMKT vs MSCI EM Index - Performance
EMKT launched on ASX in April 2018 and has demonstrated strong outperformance since its inception, as highlighted by the table below. As always, it is important to note that past performance is not indicative of future performance.
Table 2: Performance as at 29 February 2024
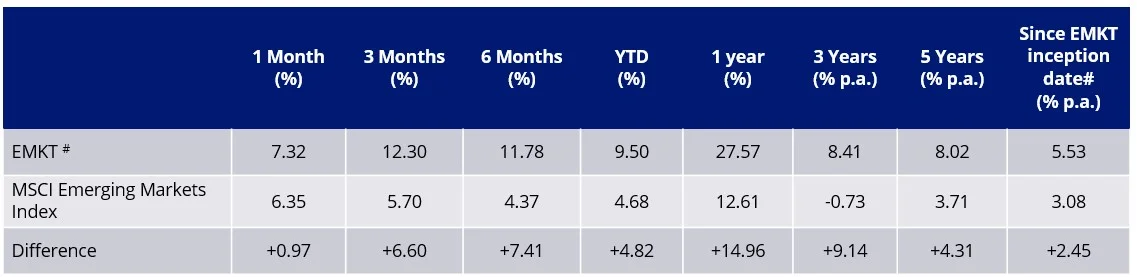
Source: VanEck, Morningstar Direct. #EMKT inception date is 10 April 2018 and a copy of the factsheet is here.
Results are calculated to the last business day of the month and assume immediate reinvestment of distributions. EMKT Performance is calculated net of management fees and costs incurred in the fund, calculated daily but does not include brokerage costs or buy/sell spreads of investing in EMKT. Past performance is not a reliable indicator of future performance. Returns longer than one year are annualised. The MSCI Emerging Markets Index (“MSCI EMI”) is shown for comparison purposes as it is the widely recognised benchmark used to measure the performance of emerging markets large- and mid-cap companies, weighted by market capitalisation. EMKT’s index measures the performance of emerging markets companies selected on the basis of their exposure to value, momentum, low size and quality factors, while maintaining a total risk profile similar to that of the MSCI EMI, at rebalance. EMKT’s index has fewer companies and different country and industry allocations than MSCI EMI. Click here for more details
EMKT vs MSCI EM Index - Top 10 holdings
Below you can see the top 10 companies in both EMKT and the MSCI EM Index. The top 10 holdings are companies that investors can relate to in their day-to-day lives such as Samsung, Taiwan Semiconductor Manufacturing and Kia. Notable differences to the MSCI EM Index top 10 include Indian IT company HCL Technologies and UAE property developer Emaar – to see all the holdings in EMKT and their weightings click here.
Chart 3: Top 10 holdings
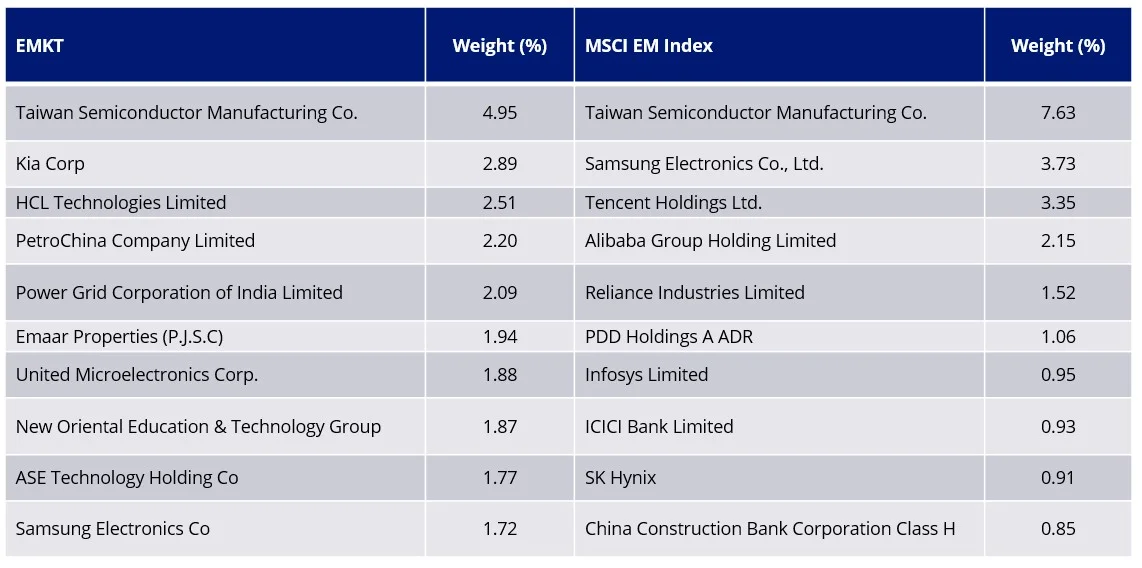
Source for table 3: Factset, VanEck, MSCI, as at 29 February 2024. Not a recommendation to act
EMKT vs MSCI EM Index - Style
When looking at portfolios it is important to determine what style e.g. value or growth and what size bias a portfolio holds e.g. giant, large, mid or small. Below we can see EMKT’s. Importantly EMKT holds large companies with a value-core orientation relative to the MSCI EM Index, which skews larger (giant) and more toward growth.
| Chart 1: EMKT holdings-based style map | Chart 2: MSCI EM holdings-based style map |
|
|
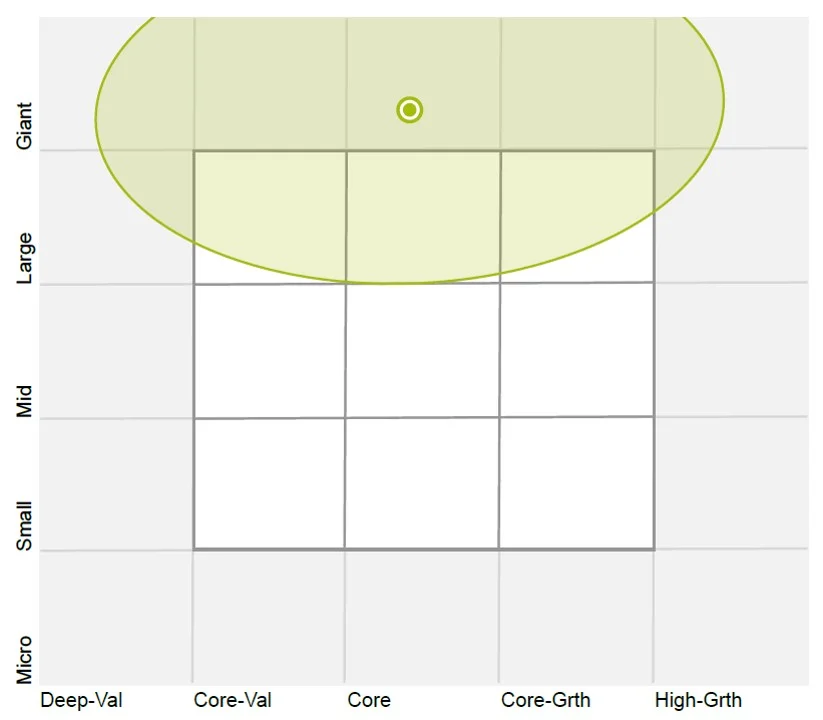 |
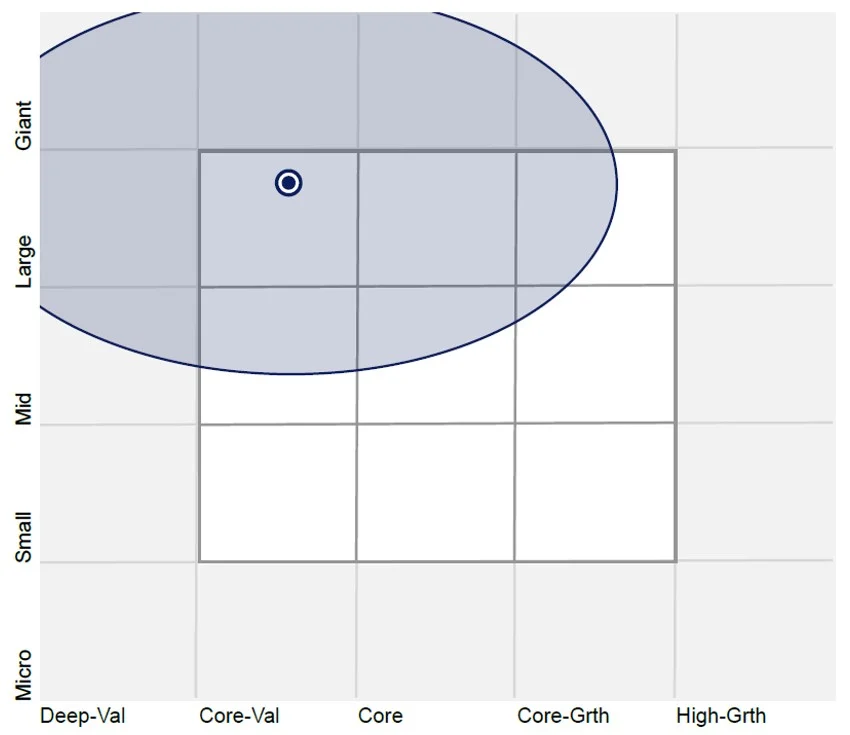
Source: Morningstar Direct, as at 29 February 2024.
While each emerging market approach has its merit for portfolio inclusion, you should assess all the risks and consider your investment objectives.
Past performance is no guarantee of future performance. The above is not a recommendation. Please speak to your financial adviser or stock broker.
For further information you can email us or call on us on +61 2 8038 3300.
Key risks
An investment EMKT carries risks associated with: ASX trading time differences, emerging markets, financial markets generally, individual company management, industry sectors, foreign currency, country or sector concentration, political, regulatory and tax risks, fund operations, liquidity and tracking an index. See the PDS for details.


Last Updated On: 27 March 2024
Any views expressed are opinions of the author at the time of writing and is not a recommendation to act.
VanEck Investments Limited (ACN 146 596 116 AFSL 416755) (‘VanEck’) is the issuer and responsible entity of all VanEck exchange traded funds (Funds) listed on the ASX. This is general advice only and does not take into account any person’s financial objectives, situation or needs. The product disclosure statement (PDS) and the target market determination (TMD) for all Funds are available at vaneck.com.au. You should consider whether or not an investment in any Fund is appropriate for you. Investments in a Fund involve risks associated with financial markets. These risks vary depending on a Fund’s investment objective. Refer to the applicable PDS and TMD for more details on risks. Investment returns and capital are not guaranteed.
EMKT is indexed to a MSCI index. EMKT is not sponsored, endorsed or promoted by MSCI, and MSCI bears no liability with respect to EMKT or the MSCI Index. The PDS contains a more detailed description of the limited relationship MSCI has with VanEck and EMKT.