Emerging markets have the luxury of a policy cushion
Emerging markets are shaping up to be monetary policy champions, with many fiscally stronger than developed markets, presenting an opportunity for investors.
The RBA rate hike on Tuesday caught many off-guard and highlights how precarious the economy is, as the RBA tries to navigate a soft landing. The reality is, like most developed nations, our central bank moved too slowly to begin with. Emerging markets did not and as a result many of their central banks are now happily on hold. In addition to being monetary policy champions, many emerging markets are fiscally stronger than developed markets. Despite this, most global bond portfolios do not have an allocation to emerging market bonds.
While there has been significant improvement in sentiment towards emerging markets today1, which might result in more emerging market allocations within global bond portfolios going forward, demand is also expected to come from other central banks as blocs such as the petroYuan and petroRupee come into effect.
Emerging markets – low debt, orthodox monetary policy
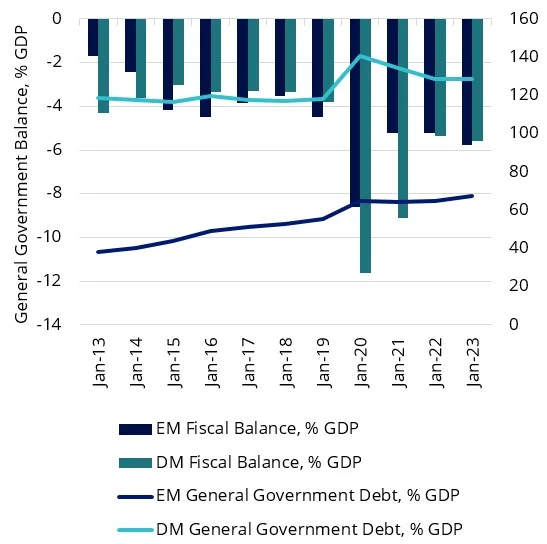
The fiscal prudence, sometimes the result of learning the hard way, of some emerging markets’ authorities and having central banks focused on inflation rather than asset prices, has resulted in a divergence with developed markets. In a good way. Emerging markets unlike developed market peers have policy rate cushions.
| Chart 1: Emerging markets and developed markets - Fiscal Balances and Debt/GDP ratios |
Chart 2: Policy rates in major emerging markets and developed markets (%) |
 |
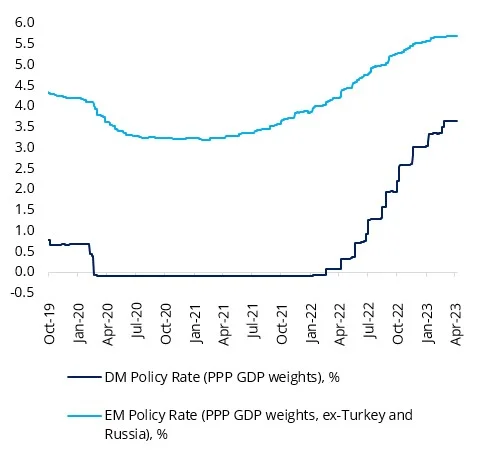 |
Chart 1: Source IMF, Bloomberg, as of December 2022, Chart 2: Source: VanEck, Bloomberg, as of May 2023.
You can see in chart 2 above, the current global tightening cycle was led by emerging markets, which started hiking earlier and larger than the Fed and RBA in order to address rising inflation pressures. As a result, their hikes were not needed to be as fast resulting, for the most part, in a smoother hiking cycle, with many now on hold or cutting.
This has resulted in higher real policy rates in emerging markets and developed markets.
Chart 3: Emerging markets real policy rates are higher compared to developed markets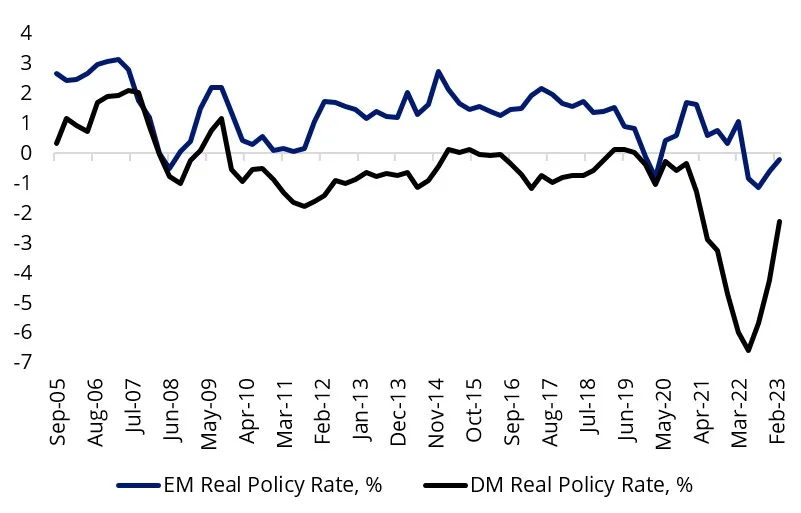
Source: VanEck Research; Bloomberg LP. Data as of April 2023. Past performance is not indicative of future results.
There is also strong structural support for emerging markets. Emerging markets generally exports more than it imports and benefits from high commodity prices and the advent of the petroYuan and petroRupee forces central banks involved to purchase emerging market bonds.
As with anything – it pays to be selective
Despite the sound fundamentals and structural tailwinds, many Australian investors do not have an allocation to emerging market bonds as a tool to enhance their yield. Based on old beliefs, there are a number of reasons why investors may not have an allocation to emerging market bonds.
Stories like Argentina’s gargantuan +1000bps (!) move in late April, highlights that emerging markets bonds are not a monolith. What you may have missed is that several emerging markets outside of China are testing the waters with rate cuts – Uruguay, Costa Rica and Hungary for example. Many remain on hold.
The point is many emerging markets’ central banks have room to move. Therefore, when selecting which emerging market bonds to include in your portfolio it pays to be selective.
We think, to take full advantage of the opportunities within emerging market debt, it is necessary to take an unconstrained active approach, to avoid having the highest weighting to indebted, poorly run nations.
Stellar performance: emerging market bonds have outperformed global bonds
The VanEck Emerging Income Opportunities Active ETF (Managed Fund) (EBND) takes an active, high conviction and benchmark agnostic approach to investing across the emerging market bond spectrum (the benchmark is 50% J.P. Morgan Emerging Market Bond Index Global Diversified Hedged AUD and 50% J.P. Morgan Government Bond-Emerging Market Index Global Diversified).
To illustrate the above, Table 1 below demonstrates that our active approach has not only outperformed the Benchmark, the VanEck Emerging Income Opportunities Active ETF (Managed Fund) (EBND) has also outperformed the Bloomberg AusBond Composite Bond 0+ Yr Index and the Bloomberg Global Aggregate Index Hedged into AUD index.
Table 1: Trailing returns
|
|
1 Month (%) |
3 Months (%) |
6 Months |
1 Year (%) |
3 Years |
Since Inception (% p.a.) |
|
EBND |
1.44 |
2.88 |
16.41 |
9.11 |
6.28 |
-0.23 |
|
Benchmark |
1.33 |
3.55 |
10.84 |
5.61 |
-0.94 |
-4.48 |
|
Difference |
+0.11 |
-0.67 |
+5.57 |
+3.50 |
+7.22 |
+4.25 |
|
Australian Bond Index |
0.19 |
1.99 |
4.23 |
2.06 |
-2.29 |
-1.86 |
|
Global Bond Index |
0.41 |
0.69 |
3.86 |
-2.28 |
-3.17 |
-2.65 |
Source: Bloomberg, VanEck. EBND inception date is 11 February 2020.
Benchmark is 50% J.P. Morgan emerging Market Bond Index Global Diversified Hedged AUD and 50% J.P. Morgan Government Bond emerging Market Index Global Diversified. Australian Bond Index is Bloomberg Aus Bond Composite 0+ Years. Global Bond Index is Bloomberg Global Aggregate Index Hedged into AUD. The table above shows past performance of the Fund from its Inception Date. Results are calculated to the last business day of the month and assume immediate reinvestment of distributions. Fund results are net of management fees and costs, but before brokerage fees or bid/ask spreads incurred when investors buy/sell on the ASX. Returns for periods longer than one year are annualised. Past performance is not a reliable indicator of current or future performance which may be lower or higher.
Diversification benefits: Emerging market bonds are a diversifier within a global bond portfolio
Another reason to consider emerging market bonds is their diversification benefits. The correlation between emerging market bonds and global aggregate bonds is modest (0.51), signifying potential diversification benefits when adding emerging market debt to a global bond portfolio.
Table 2: Modest correlation with global and Australian bonds
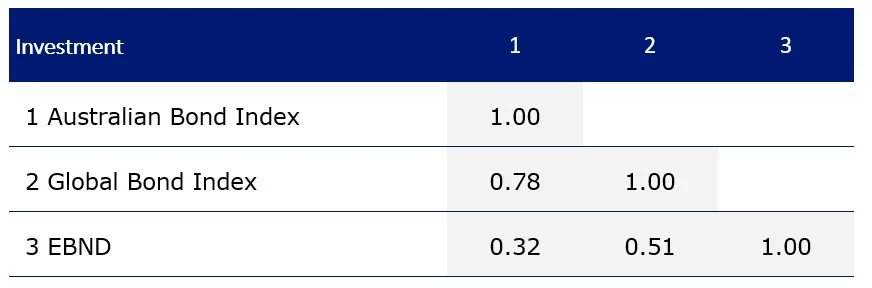
Source: Morningstar Direct, 30 April 2023.
Australian Bond Index is Bloomberg Aus Bond Composite 0+ Years. Global Bond Index is Bloomberg Global Aggregate Index Hedged into AUD. You cannot invest directly in an index. Past performance is not a reliable indicator of current or future performance which may be lower or higher.
Monthly income: 5% p.a. target yield
EBND pays dividends monthly. EBND has a target dividend yield of 5% p.a.* As it is a fully transparent active ETF, EBND will trade close to its fair value because it is supported by an external market maker, which facilitates liquidity.
EBND statistics: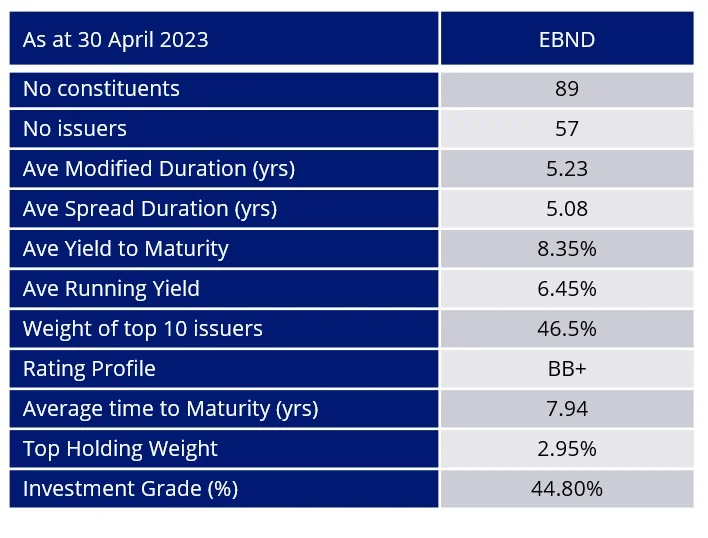
Source: VanEck. Yield measures are not a guarantee of future dividend income from the funds.
VanEck’s EBND advantage
EBND enables investors to access an actively managed and diversified portfolio of emerging market bonds via a single trade on ASX. VanEck manages in excess of US$4 billion in emerging market fixed income assets globally and has been investing in emerging markets since 1993. The depth and breadth of VanEck’s experienced emerging market bond team is unparalleled. The team has an average of over 20 years of investing experience across a variety of market conditions and stages of the economic cycle.
Key risks
An investment in the Fund carries risks associated with: ASX trading time differences, emerging markets bonds and currencies, bond markets generally, interest rate movements, issuer default, currency hedging, credit ratings, country and issuer concentration, liquidity, fund manager and fund operations. See the PDS for details.


Published: 15 May 2023
1Source: HSBC. Data as December 31, 2022.
*VanEck determines the amount of the dividend each month taking into account all relevant factors targeting an annual dividend yield of 5% p.a. of the capital invested at the beginning of the period. VanEck may amend this target from time to time.
Any views expressed are opinions of the author at the time of writing and is not a recommendation to act.
VanEck Investments Limited (ACN 146 596 116 AFSL 416755) (VanEck) is the issuer and responsible entity of all VanEck exchange trades funds (Funds) listed on the ASX. This is general advice only and does not take into account any person’s financial objectives, situation or needs. The product disclosure statement (PDS) and the target market determination (TMD) for all Funds are available at vaneck.com.au. You should consider whether or not an investment in any Fund is appropriate for you. Investments in a Fund involve risks associated with financial markets. These risks vary depending on a Fund’s investment objective. Refer to the applicable PDS and TMD for more details on risks. Investment returns and capital are not guaranteed.