Greed and fear
The Omicron outbreak, inflation and monetary tightening are shaking emerging markets.
Emerging markets investing has always been risky, yet not investing in them is risky too. For investors, avoiding emerging markets means missing potential opportunities and diversification benefits.
The Omicron outbreak, inflation and monetary tightening are shaking emerging markets.
Emerging markets investing has always been risky, yet not investing in them is risky too. For investors, avoiding emerging markets means missing potential opportunities and diversification benefits.
There are a number of long-term structural tailwinds supporting emerging markets such as favourable demographics and increasing wealth. In the near term, the IMF estimate for emerging market GDP growth for 2021 forecast is 5.1%, higher than developed markets.
Astute investors are including exposure to emerging markets to capture this growth opportunity as part of a well-diversified international portfolio strategy.
Right now, emerging markets equities look compelling from a valuation standpoint, however not all emerging markets companies are desirable from an investment perspective and quantifying factors in emerging markets is near impossible for non-institutional investors.Emerging markets wild ride
Investing is fraught with risk. Investors must weigh the potential opportunity costs and the relative risks of one investment choice over another. It is no mean feat and the decision to allocate to emerging markets is one such decision. It can be risky and it can be expensive.
Since 2001, emerging markets have outperformed developed markets, but it’s been a wild ride. Australian investors with global equity portfolios that had exposure to emerging market equities were rewarded in the lead up to the GFC (2001 to 2007 below) benefiting from an emerging markets boom. Emerging markets equities then underperformed, despite growth in emerging market economies such as China helping the global recovery. Emerging markets then had a stellar 2017 with growth buoyed by a synchronised global expansion and still-loose monetary policy in developed nations, particularly the US. Then, in 2018, the US started raising rates and since then emerging markets have underperformed developed markets in the face of a strong US dollar and the COVID crisis and its many waves.
Table 1: Developed and emerging markets equity performance
|
|
Annualised returns |
Cumulative returns |
||
|
|
MSCI Emerging Markets Index |
MSCI World ex Australia Index |
MSCI Emerging Markets Index |
MSCI World ex Australia Index |
|
2001 to 2007 |
15.80% p.a. |
-1.43% p.a. |
179.26% |
-9.56% |
|
2008 to 2016 |
0.48% p.a. |
5.56% p.a. |
4.37% |
62.74% |
|
2017 |
27.09% p.a. |
13.38% p.a. |
27.09% |
13.38% |
|
2018 to 2021 |
5.84% p.a. |
15.50% p.a. |
25.49% |
77.99% |
|
Performance 2001 to 2021 |
7.59% p.a. |
5.32% p.a. |
364.87% |
197.01% |
Source: Morningstar Direct. All data calculated to each year ending 31 December. Cumulative returns are calculated monthly and assume immediate reinvestment of all dividends. Data is in Australian dollars. You cannot invest in an index. Past performance is not a reliable indicator of future performance.
Monetary tightening, while the market has faith in the US Federal Reserve, is currently shaking emerging markets, however the investment case for emerging market equities is still compelling given their significant projected growth prospects. Emerging markets are predicted to grow faster than developed markets, despite the much-publicised expected slowdown in China growth. 2021 was a record year for emerging market equity IPOs, and much of this was driven by China.
Chart 1: World economic outlook growth projections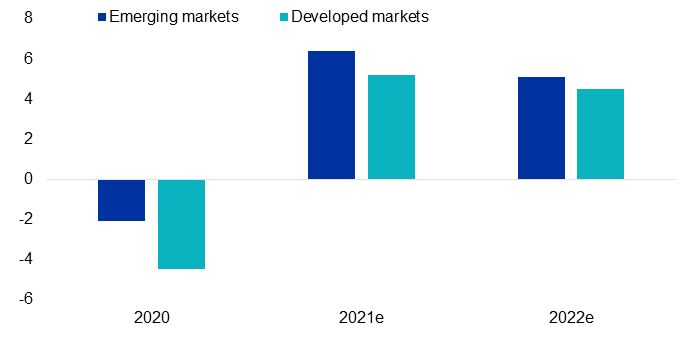
Source: Bloomberg, IMF, October 2021
Chart 2: The value of emerging market IPOs in 2021 reached an all-time high 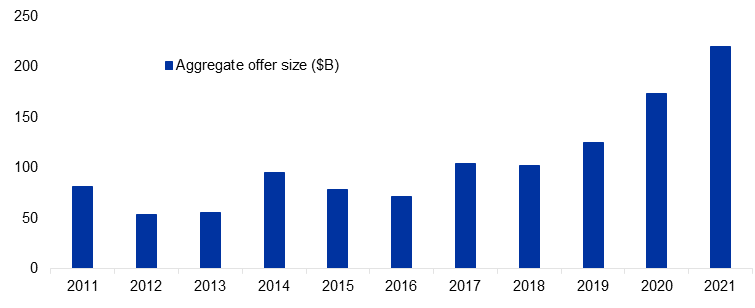
Source: Bloomberg
Investors may be considering risky assets as the global economy opens further. However, taking the right approach is important.
“Be greedy when others are fearful”
Right now, emerging markets look compelling from a valuation standpoint, approaching historical lows relative to developed markets.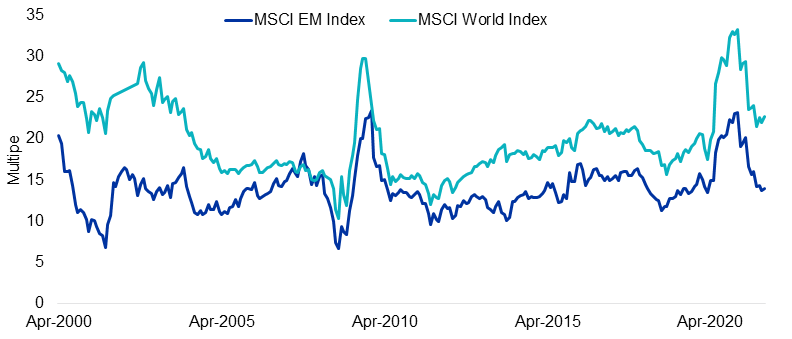
Source: MSCI, November 1999 to December 2021. Past performance is not a reliable indicator of future performance.
Investing in emerging markets is difficult
Investing in emerging markets has traditionally been expensive and returns among active managers vary significantly from year-to-year because it is almost impossible for active managers to time factors in emerging markets.
The VanEck MSCI Multifactor Emerging Markets Equity ETF (ASX: EMKT) tracks the MSCI Emerging Markets Diversified Multiple-Factor Index (EMKT Index) which includes companies on the basis of four factors: Value, Momentum, Low Size and Quality. The four factors combined demonstrate long term outperformance relative to the MSCI Emerging Markets Index, even considering EMKT’s management costs.
EMKT and modelled EMKT Index-after-fees performance as at 31 December 2021
|
|
1 Month |
3 Months |
6 Months |
1 Year |
2 Years |
3 Years |
Since EMKT inception date# |
5 years |
10 years |
15 years |
20 Years |
|
EMKT |
0.94 |
-0.38 |
-0.62 |
13.04 |
6.79 |
10.83 |
4.46 |
||||
|
EMKT Index (net of EMKT management costs)* |
4.68 |
9.77 |
9.97 |
6.48 |
10.23 |
||||||
|
MSCI Emerging Markets Index |
-0.65 |
-1.95 |
-6.34 |
3.44 |
5.58 |
9.76 |
5.52 |
9.79 |
9.17 |
5.01 |
7.69 |
|
Difference |
+1.59 |
+1.57 |
+5.72 |
+9.60 |
+1.21 |
+1.07 |
-1.06 |
-0.02 |
+0.80 |
+1.47 |
+2.54 |
Source: VanEck, Morningstar, Bloomberg
# EMKT inception date is 10 April 2018 and a copy of the factsheet is here. EMKT Index base date is 29 December 2000. *EMKT Index results are net of EMKT’s 0.69% p.a. management costs, calculated daily but do not include brokerage costs or buy/sell spreads of investing in EMKT. You cannot invest in an index. EMKT Index performance prior to its launch on 17 March 2015 is simulated based on the current index methodology. Past performance is not a reliable indicator of future performance.
EMKT’s performance puts it in the top quartile of active peers over one and three years.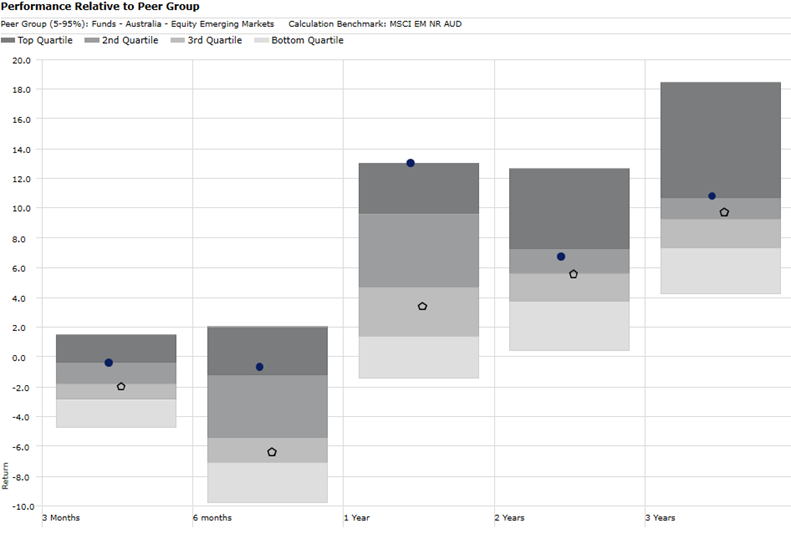
Source: Morningstar, to 31 December 2021. Past performance is not a reliable indicator of future performance. Results are calculated to the last business day of the month and assume immediate reinvestment of distributions. Results are net of management fees and other costs incurred in the fund, but before brokerage fees and bid/ask spreads. Returns for periods longer than one year are annualised. Peer group Equity Region Emerging Markets funds invest in companies listed in emerging markets from around the globe. Emerging market securities typically account for at least 75% of the portfolio.
Learn more about EMKT here.


Published: 14 January 2022
Any views expressed are opinions of the author at the time of writing and is not a recommendation to act.
VanEck Investments Limited (ACN 146 596 116 AFSL 416755) (‘VanEck’) is the issuer and responsible entity of all VanEck exchange trades funds (Funds) listed on the ASX. This is general advice only and does not take into account any person’s financial objectives, situation or needs. The product disclosure statement (PDS) and the target market determination (TMD) for all Funds are available at vaneck.com.au. You should consider whether or not an investment in any Fund is appropriate for you. Investments in a Fund involve risks associated with financial markets. These risks vary depending on a Fund’s investment objective. Refer to the applicable PDS and TMD for more details on risks. Investment returns and capital are not guaranteed.
View Index provider disclaimers. Index providers for VanEck funds do not sponsor, endorse or promote the funds.