India rebounds: accessing a smart exposure to this growth powerhouse
India’s recent equity rally
On 6 June 2025, the Reserve Bank of India (RBI) cut the cash reserve ratio (CRR) by 100 basis points (bps) from 4% to 3%. This followed a 50 basis points cut in December, which was the first rate cut since 2020.
The June cut was bigger than the market had anticipated, and it is expected to unlock 2.5 trillion rupees in banking liquidity by the year-end. It will also reduce the cost of funding for banks, thereby helping and accelerating the monetary policy transmission to the credit market.
The Indian equity market reacted positively. Ongoing tariff negotiations have also buoyed sentiment for local investors.
On the same day that the RBI was loosening monetary policy, Indian government officials confirmed that US-India trade talks would be extended as both sides seek consensus on tariff cuts, aiming to finalise an interim deal before a July 9 deadline.
In February, President Trump and Indian Prime Minister Modi agreed to conclude a bilateral trade pact by the end of 2025 and more than double trade to $500 billion by 2030. While there has been a rally, year-to-date, India has been a laggard within emerging markets.
Chart 1: Year to date performance
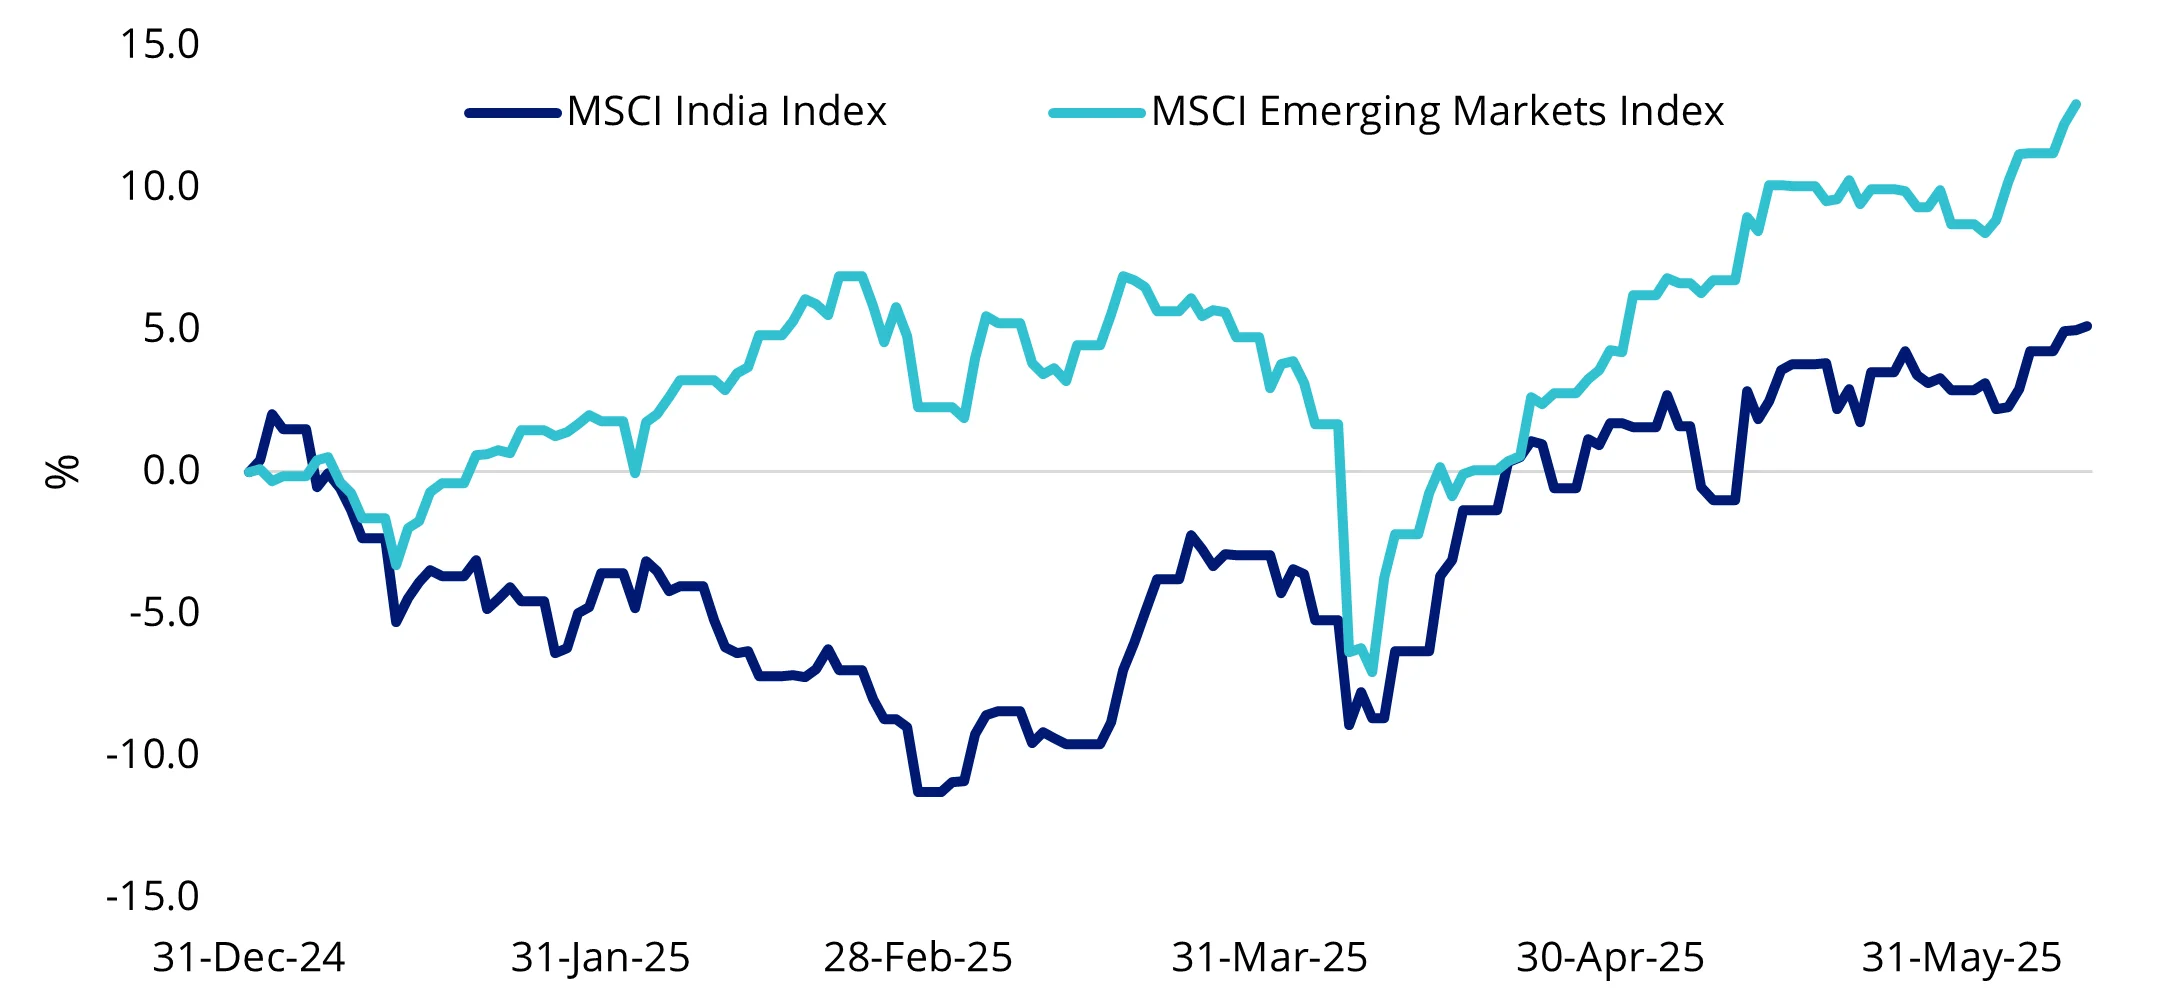
Source: Morningstar Direct. 31 December 2024 to 11 June 2025, all returns in Australian dollars. Past performance is not a reliable indicator of future performance. Index performance is not representative of fund performance. It is not possible to invest directly in an index.
Many analysts believe that the recent rally could be the start of India's outperformance relative to other emerging markets.
Indian equities are undervalued
While it has been noted that the Indian equity market is among the most expensive in the world, earlier in the month, Morgan Stanley released its Indian Equity Strategy Playbook, titled “Equities Appear Inexpensive”.
However, this is not a short-term trade. “It will require patience, given the potential for bad news from outside India, but we believe rewards will come in time,” according to Morgan Stanley. The Indian stock market has shown resilience since September 2024, despite headwinds. The report highlights challenges such as overvaluation in small and mid-cap stocks, the Q4 2024 market correction, volatility from tariffs and geopolitical uncertainty.
Macro stability was among the reasons cited that contribute to a favourable outlook for Indian equities. In the chart below, when the blue line is rising, it indicates that India’s policy uncertainty is higher than the rest of the world. You can see, as uncertainty improves, so too does relative equity performance.
Chart 2: India’s policy certainty supports share price performance
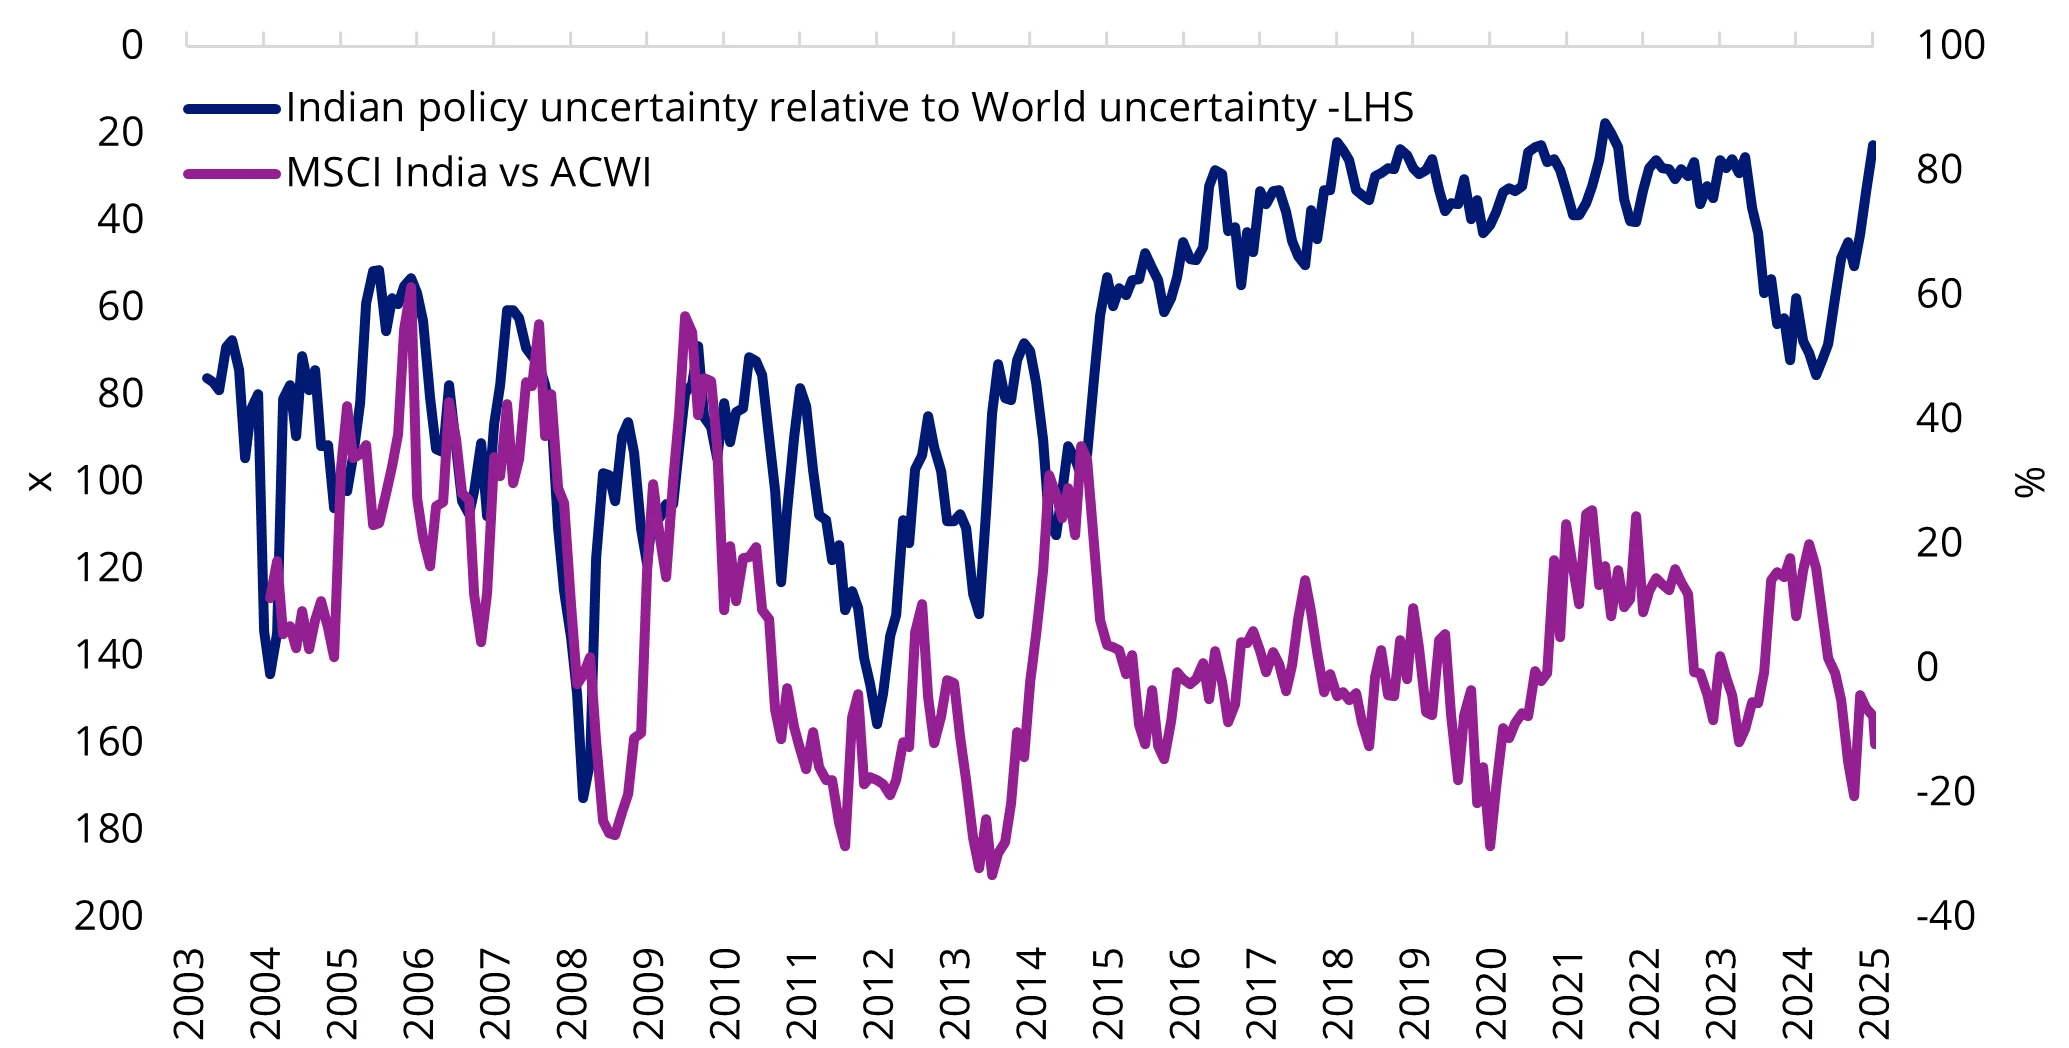
Source: Bloomberg, Data as at 31 May 2025. Past performance is not a reliable indicator of future performance. ACWI is MSCI All Country World Index. You cannot invest in an index.
Morgan Stanley also noted that budding private capital expenditure, deleveraged balance sheets and increases in discretionary spending from a growing middle class could propel mid-to-high teens earnings growth over the next three to five years.
In terms of middle-class growth, based on the most recent figures, over the last decade, the middle-class demographic expanded by over 14%.
Chart 3: India income by segment (% of population)
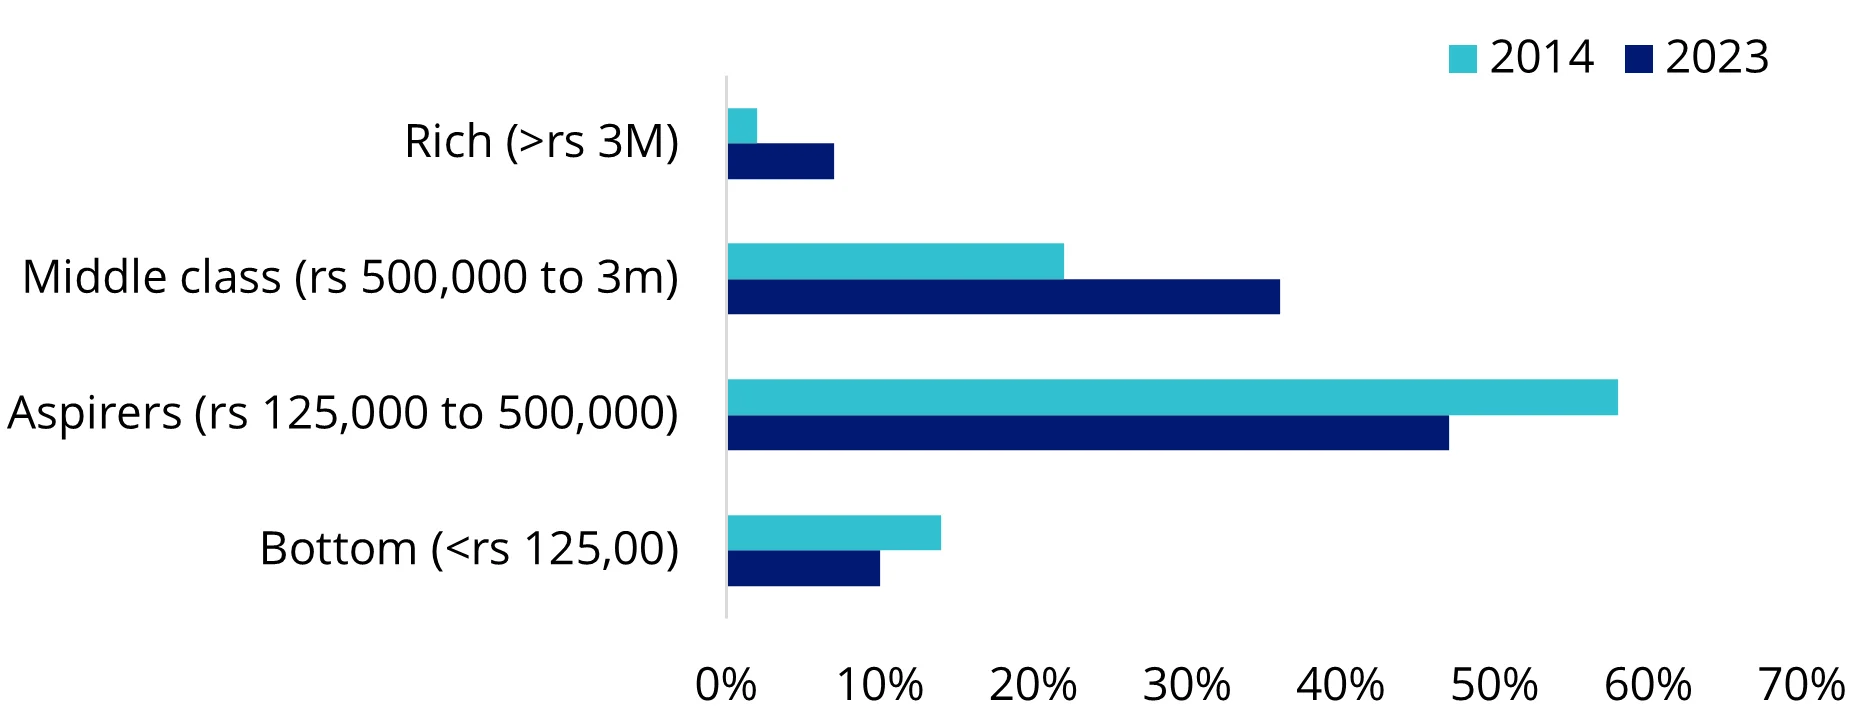
Source: World Development Indicators | DataBank (worldbank.org)
India’s population is dispersed, with a large segment in rural areas. During Prime Minister Modi’s tenure, which began in 2014 when he was elected for the first time, there has been a trend toward urbanisation and rising affluence.
Chart 4: India’s Poverty rate has plummeted
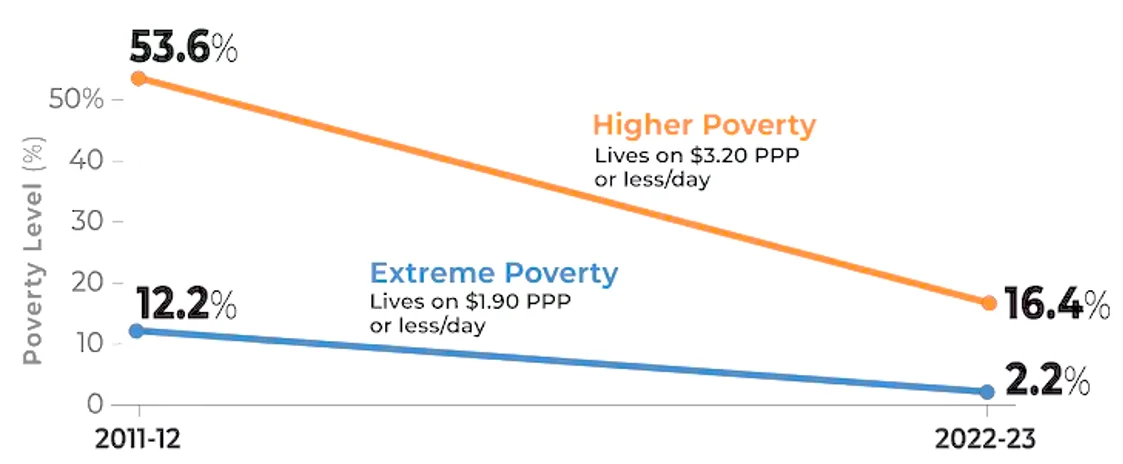
Source: Ministry of Statistics and Programme Implementation, https://www.living-standards.org/data
This is long-term positive for Indian equities. The Morgan Stanley report says “this is likely to be a stock pickers’ market”. Therefore, selectivity is key.
A selective approach for Indian equities
We think a GARP approach, which targets companies that exhibit strong growth metrics yet are reasonably priced, can help investors navigate the market's potential without overexposure to inflated valuations.
The VanEck India Growth Leaders ETF (GRIN) tracks the MarketGrader India Growth Leaders 50 Index.
The index covers a universe of approximately 3,500 companies domiciled in India. It grades all securities based on 24 fundamental indicators across four analytical categories:
- growth;
- value;
- profit; and
- cash flow.
The index includes securities that offer the best potential for GARP.
Securities are graded from 0 to 100. The top 50 ranking securities are then included in the index, which is equally weighted.
GRIN offers exposure to fundamentally sound Indian companies. GRIN aims to capture the essence of India's economic momentum while maintaining a disciplined, selective investment approach.
Since its inception GRIN has outperformed broad-based India indices, demonstrating the robustness of the high-conviction, GARP approach. Noting this is a short period and past performance should not be relied upon for future performance.
Table 1: Performance to 11 June 2025
|
|
1 Month (%) |
Since Inception* (%) |
|
GRIN |
10.94 |
4.99 |
|
Nifty 50 |
3.29 |
1.89 |
|
MSCI India Index |
4.59 |
2.52 |
* GRIN Inception date is 23 April 2025. A copy of the factsheet is here.
Table 1 source: Morningstar Direct. The table above shows past performance of GRIN from 23 April 2025. Results are calculated daily and assume immediate reinvestment of distributions. Past performance is not a reliable indicator of current or future performance which may be lower or higher. GRIN results are net of management fees and other costs incurred in the fund, but before brokerage fees and bid/ask spreads incurred when investors buy/sell on the ASX. The Nifty 50 Index is shown for comparison purposes as it is the widely recognised benchmark used to measure the performance of the broad Indian equities market. It includes the 50 largest Indian-listed companies, weighted by market capitalisation. MSCI India Index is shown for comparison purposes as it is a widely recognised benchmark used to measure the performance of the large and mid-cap segments of the Indian equity market. It covers approximately 85% of the Indian equity universe by market capitalisation. GRIN index measures the performance of 50 Indian companies with the best growth at a reasonable price (GARP) attributes at rebalance. Click here for more details.
Here are the key contributors for GRIN’s performance since its listing.
Table 2: Key contributors of GRIN’s performance
|
Ticker |
Name |
Contribution to total return (%) |
Portfolio average weight (%) |
|
GVTD IN |
GE Vernova T&D India Limited |
0.94 |
2.18 |
|
ZEN IN |
Zen Technologies Limited |
0.80 |
2.48 |
|
VND VN |
Force Motors Limited |
0.74 |
2.54 |
Source: FactSet, 23 April 2025 to 11 June 2025. Not a recommendation to act.
|
|
GE Vernova T&D India Ltd is a building power transmission and distribution infrastructure business. Its share priced surged on May 26 in response to its March quarter results. Operational performance was significantly higher than analyst expectations. The company's Earnings Before Interest, Tax, Depreciation and Amortisation (EBITDA) margin stood at 21.9%, which is the highest among its high-voltage transformer peers. |
|
|
Zen Technologies Limited is involved in the provision of training systems and counter-drone solutions. The company’s share price has risen amid an overall run in defense stocks. Government urgency following the recent conflict with Pakistan and geopolitical tensions has sparked a significant growth in its order pipeline. |
|
|
Force Motors Ltd. is a holding company, which engages in the design, development, and manufacture of automotive components, aggregates, and vehicles. This past week it rolled out its 100,000thengine for BMW India. The company’s share price hit an all time high recently as it reported sales growth in April and May. Earlier the company also posted robust earnings growth during Q4 2024. |


The GRIN opportunity:
Tap Into India’s Economic Acceleration
Gain exposure to a dynamic mix of companies driving one of the world’s fastest-growing economies, powered by a rising middle class, digital transformation and long-term structural reform.
Smart Growth, Sensible Value
Employing a disciplined GARP (Growth at a Reasonable Price) strategy, the ETF targets Indian companies with strong fundamentals and attractive valuations, identified using MarketGrader’s proprietary methodology.
High-Conviction, Quality-Focused Portfolio
Access 50 equally weighted Indian equities selected for their financial health, growth potential and valuation discipline - designed to balance opportunity with resilience.
Key risks: An investment in our India ETF carries risks associated with: ASX trading time differences, India, financial markets generally, individual company management, industry sectors, foreign currency, sector concentration, political, regulatory and tax risks, market access, fund operations, liquidity and tracking an index. See the PDS and TMD for more details.


Published: 17 June 2025
Any views expressed are opinions of the author at the time of writing and is not a recommendation to act.
VanEck Investments Limited (ACN 146 596 116 AFSL 416755) (VanEck) is the issuer and responsible entity of all VanEck exchange traded funds (Funds) trading on the ASX. This information is general in nature and not personal advice, it does not take into account any person’s financial objectives, situation or needs. The product disclosure statement (PDS) and the target market determination (TMD) for all Funds are available at vaneck.com.au. You should consider whether or not an investment in any Fund is appropriate for you. Investments in a Fund involve risks associated with financial markets. These risks vary depending on a Fund’s investment objective. Refer to the applicable PDS and TMD for more details on risks. Investment returns and capital are not guaranteed.
GRIN tracks the MarketGrader India Growth Leaders 50 Index. "MarketGrader" And “MarketGrader India Growth Leaders 50 Index” are trademarks of MarketGrader.com Corporation. MarketGrader does not sponsor, endorse, sell or promote the Fund and makes no representation regarding the advisability of investing in the Fund. The inclusion of a particular security in the Index does not reflect in any way an opinion of MarketGrader or its affiliates with respect to the investment merits of such security."