US weakness underscores emerging hero
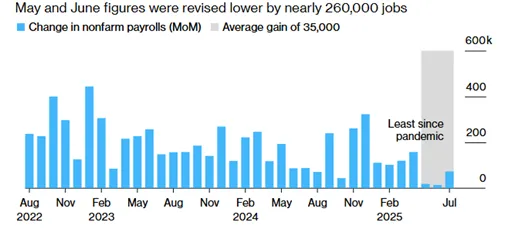
Last week’s release of weaker US economic data indicated risks of a slowing economy. Employment numbers for July came in lower than expected, while May and June figures were revised down from 144,000 to 19,000 and 147,000 to 14,000, respectively. At the same time, inflation-adjusted consumer spending fell in the first half of the year and President Trump’s latest volley of tariffs also contributed to market volatility.
Chart 1: The US labour market slowed over the past three months
Source: Bloomberg, Bureau of Labor Statistics.
Until the release of the US Jobs data, the market had little confidence that the Fed was going to deliver an interest rate cut in September. As a result of the poor data, markets are now pricing in an 87% chance of a September cut. The health of the US economy may not be as strong as the markets thought. Fed Chair Jerome Powell mentioned possible “downside risks” to the jobs market six times in his post-July meeting press conference, so last weekend’s numbers have many analysts rethinking US growth prospects.
It was the July Fed meeting that two members of the board dissented, and with the resignation of FOMC member Adriana Kugler (not one of the dissenting members), President Trump can appoint a board member that could be more dovish and consider his wish of looser monetary policy.
All of this opens the door for a more dovish Fed shift. Lower US rates put pressure on the US dollar. This has implications for emerging markets.
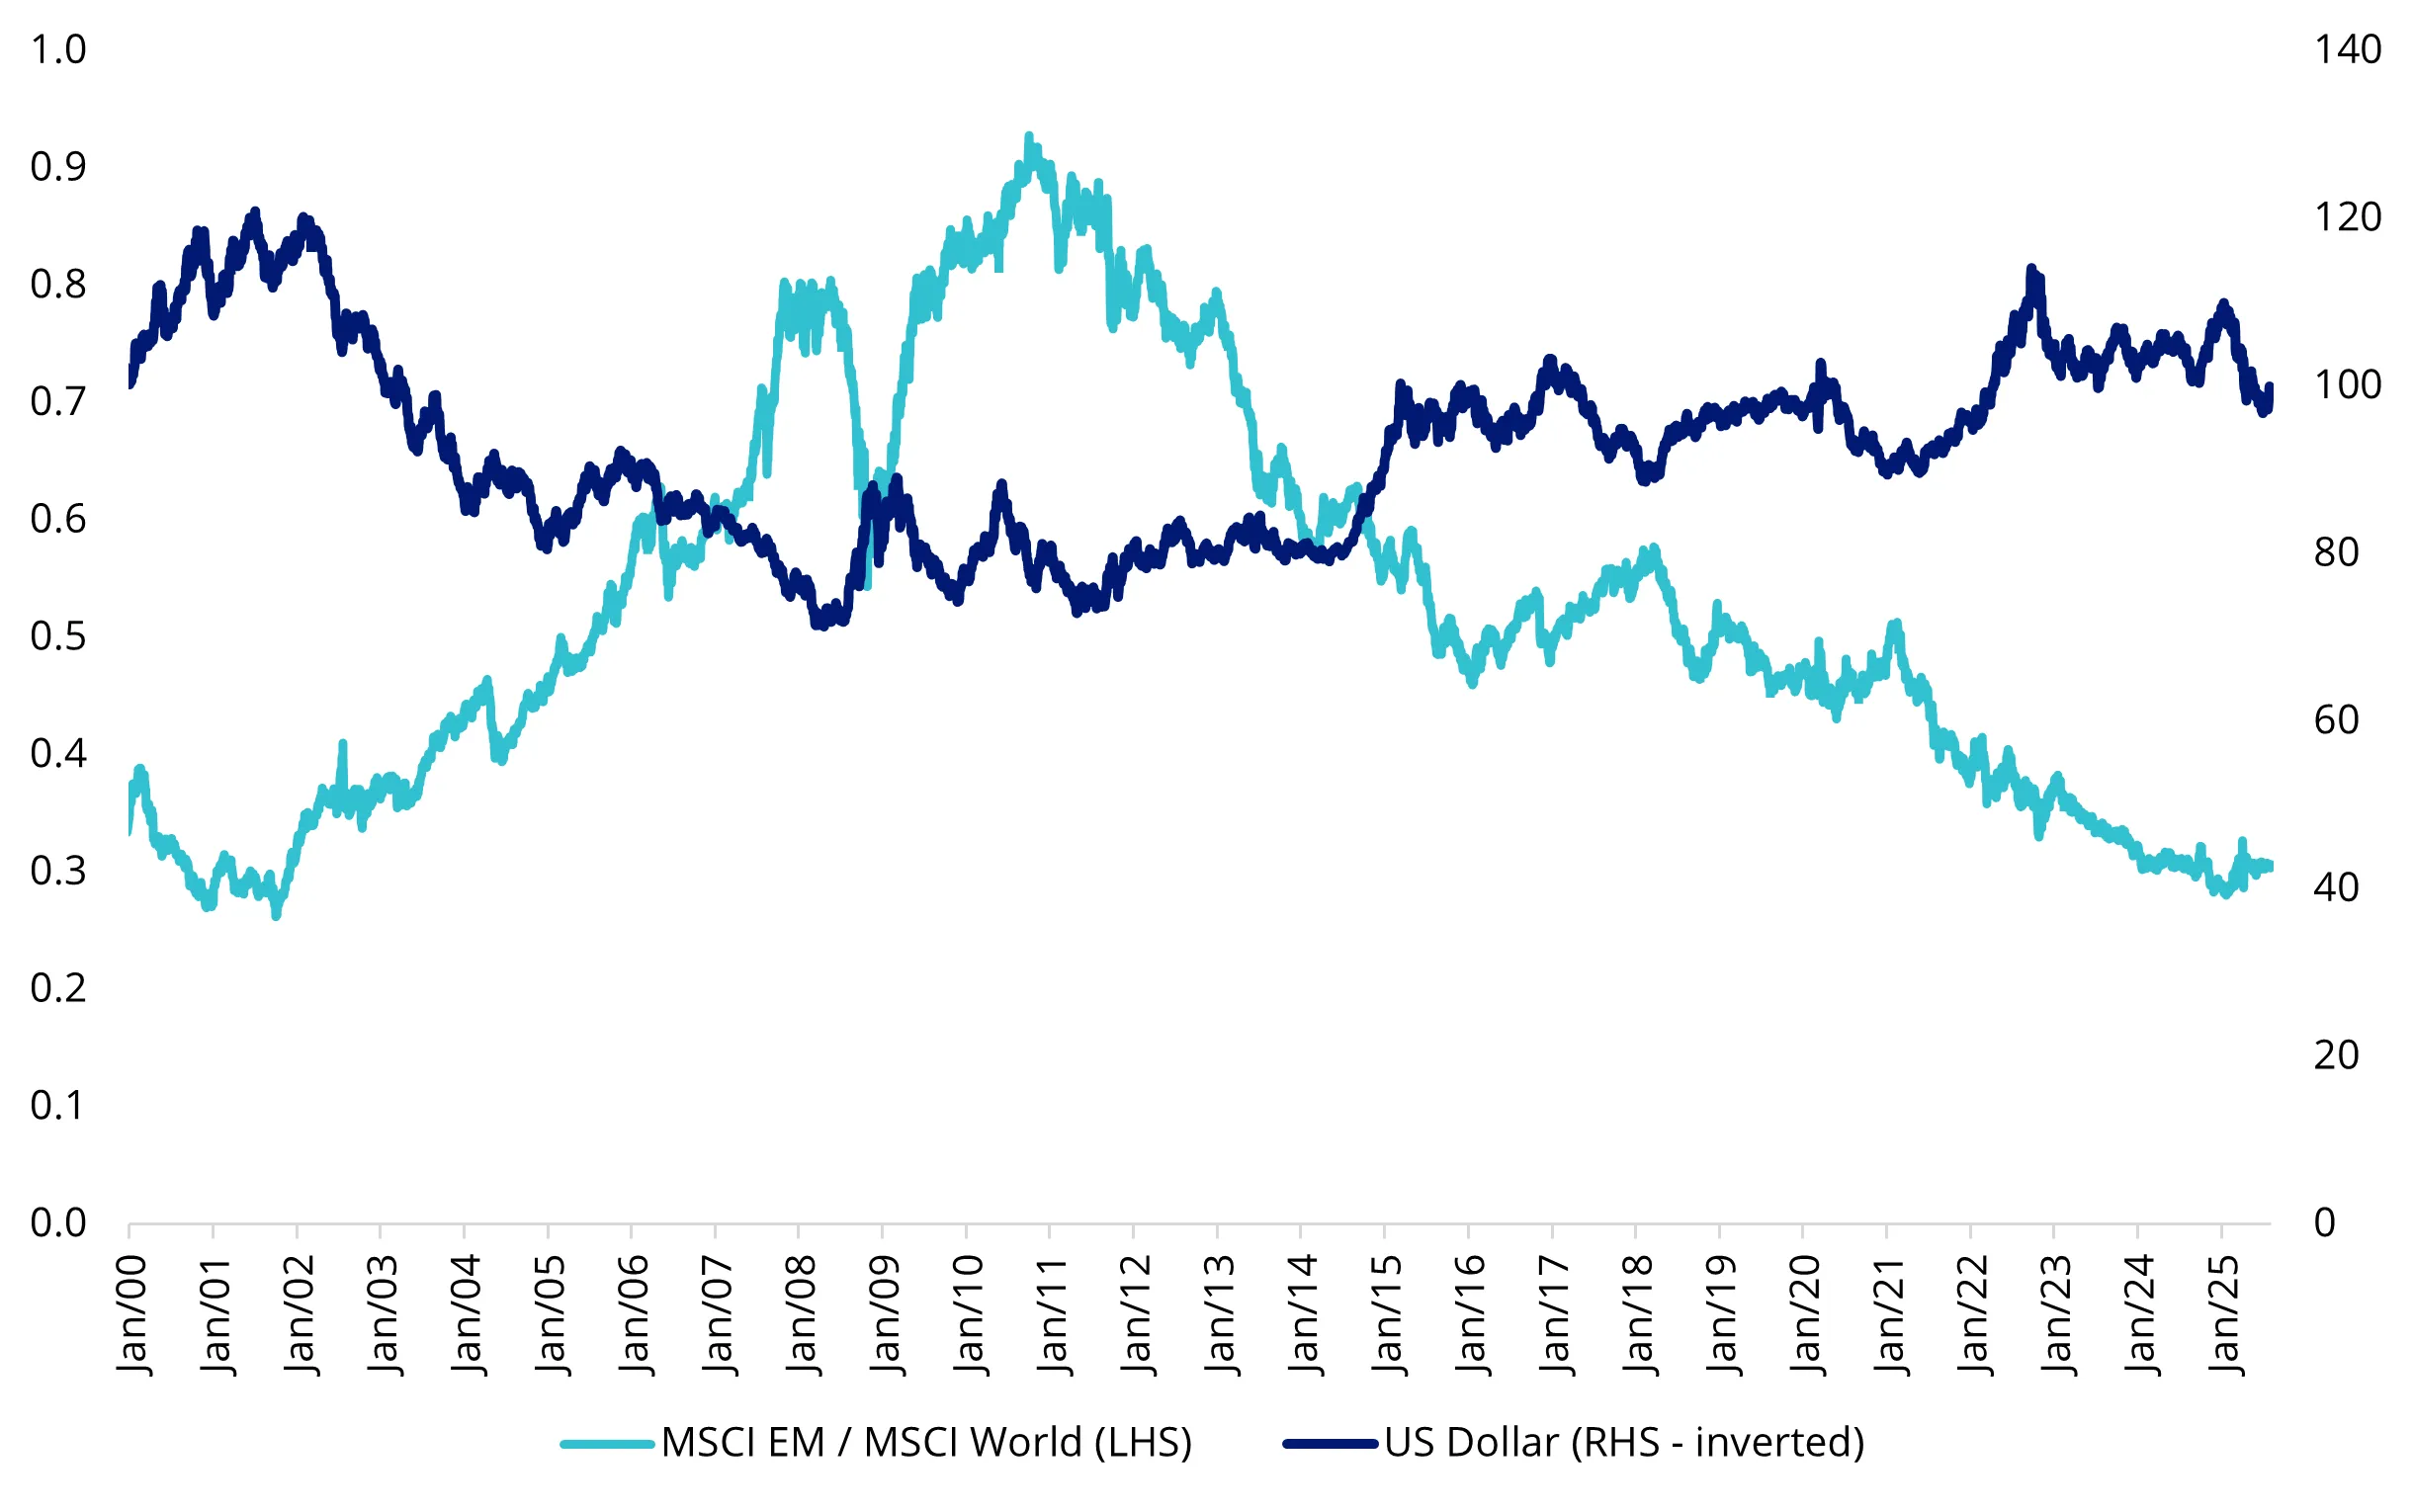
The relative value of the US dollar remains a cornerstone of the emerging markets investment case because of its bias to commodity exporting, which is often traded in US dollars. In the chart below, you can see that since 2010, as the US dollar has risen (the US dollar index is inverted, so as the dollar increases in value, its line goes down), so too have emerging markets underperformed developed markets. Should the US dollar continue to weaken, emerging markets could start to outperform.
Chart 2: The relationship between the US dollar and emerging markets equities
Source: Bloomberg, MSCI, to 6 August 2025. US dollar is the DXY Index. You cannot invest in an index. Past performance is not a reliable indicator of future performance.
Emerging markets are more resilient than in the past
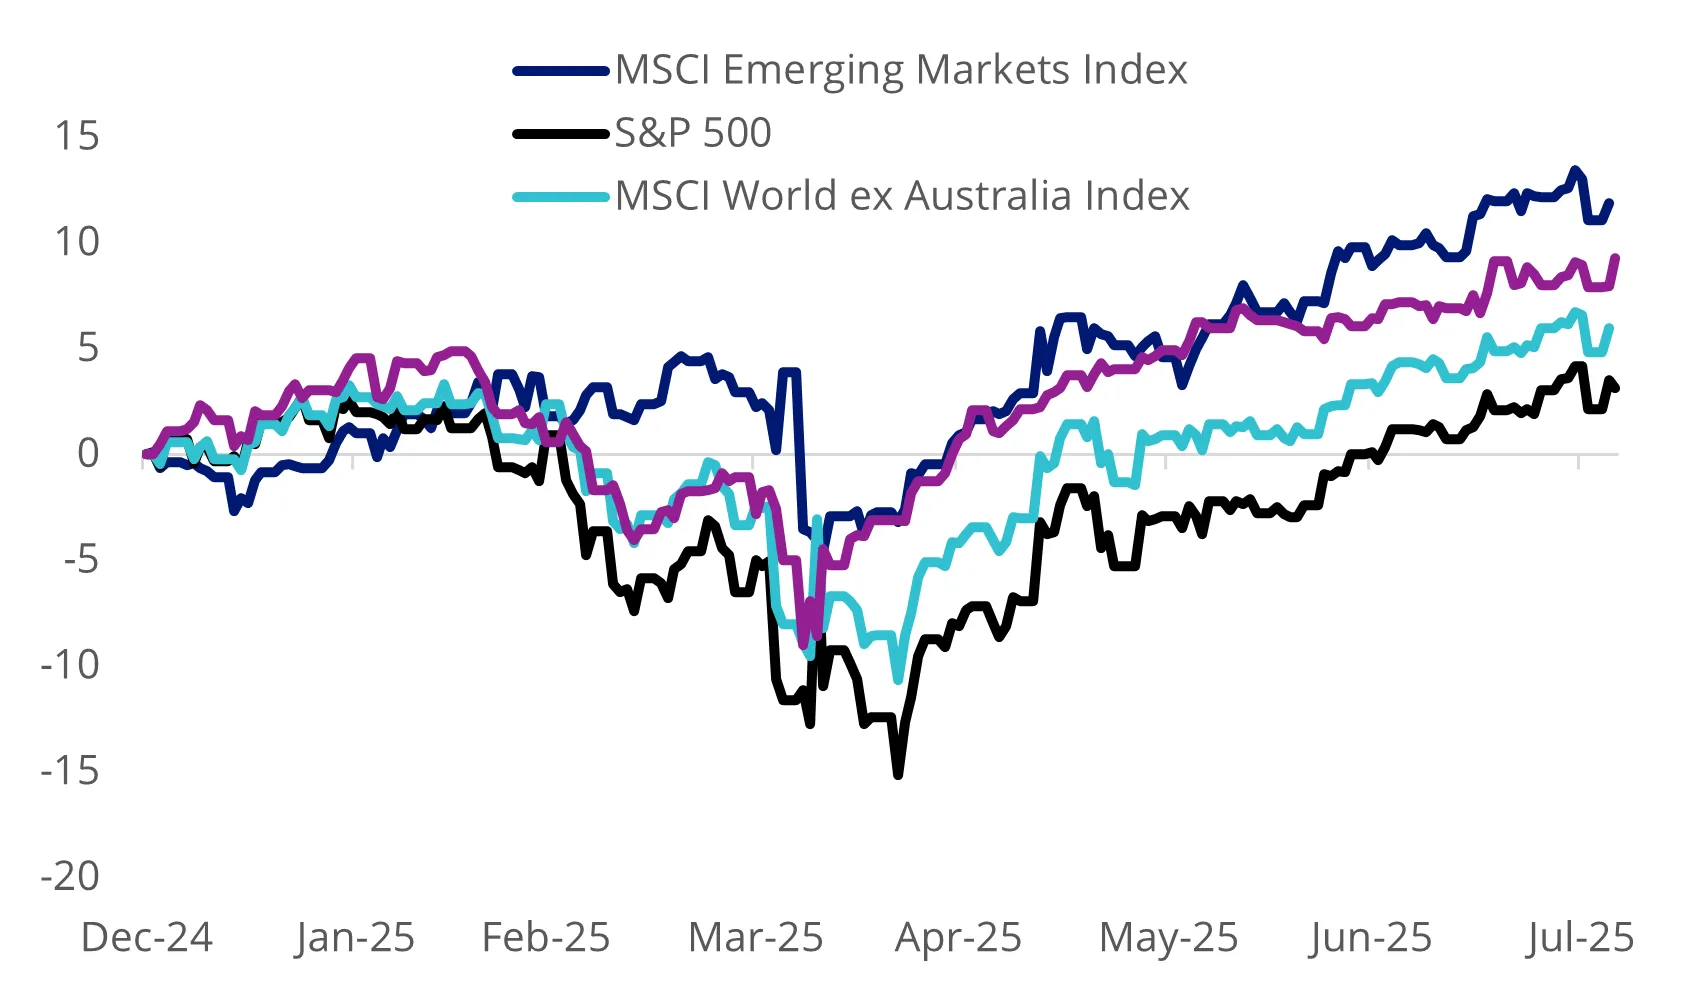
So far in 2025, emerging markets equities have been more resilient to broader equity market drawdowns and the recent steepening in long-end rates. As the market grapples with potential US recession/stagflation risks brought on by inflation from steep tariffs and fiscal issues exacerbated by mounting US debt, emerging markets equities (as represented by the MSCI Emerging Markets Index) have outperformed developed markets equities (as represented by the MSCI World ex Australia Index) in 2025.
Emerging markets equities did not fall as far as developed markets equities in the initial drawdown after President Trump's initial April tariff announcement. They have also been more resilient to the recent moves in long-term yields, which shot up in the second half of May and have stayed high.
Chart 3: Year-to-date performance (%)
Source: Morningstar Direct, 31 December 2024 to 5 August 2025. Past performance is not indicative of future performance. You cannot invest directly in an index.
Valuations are compelling
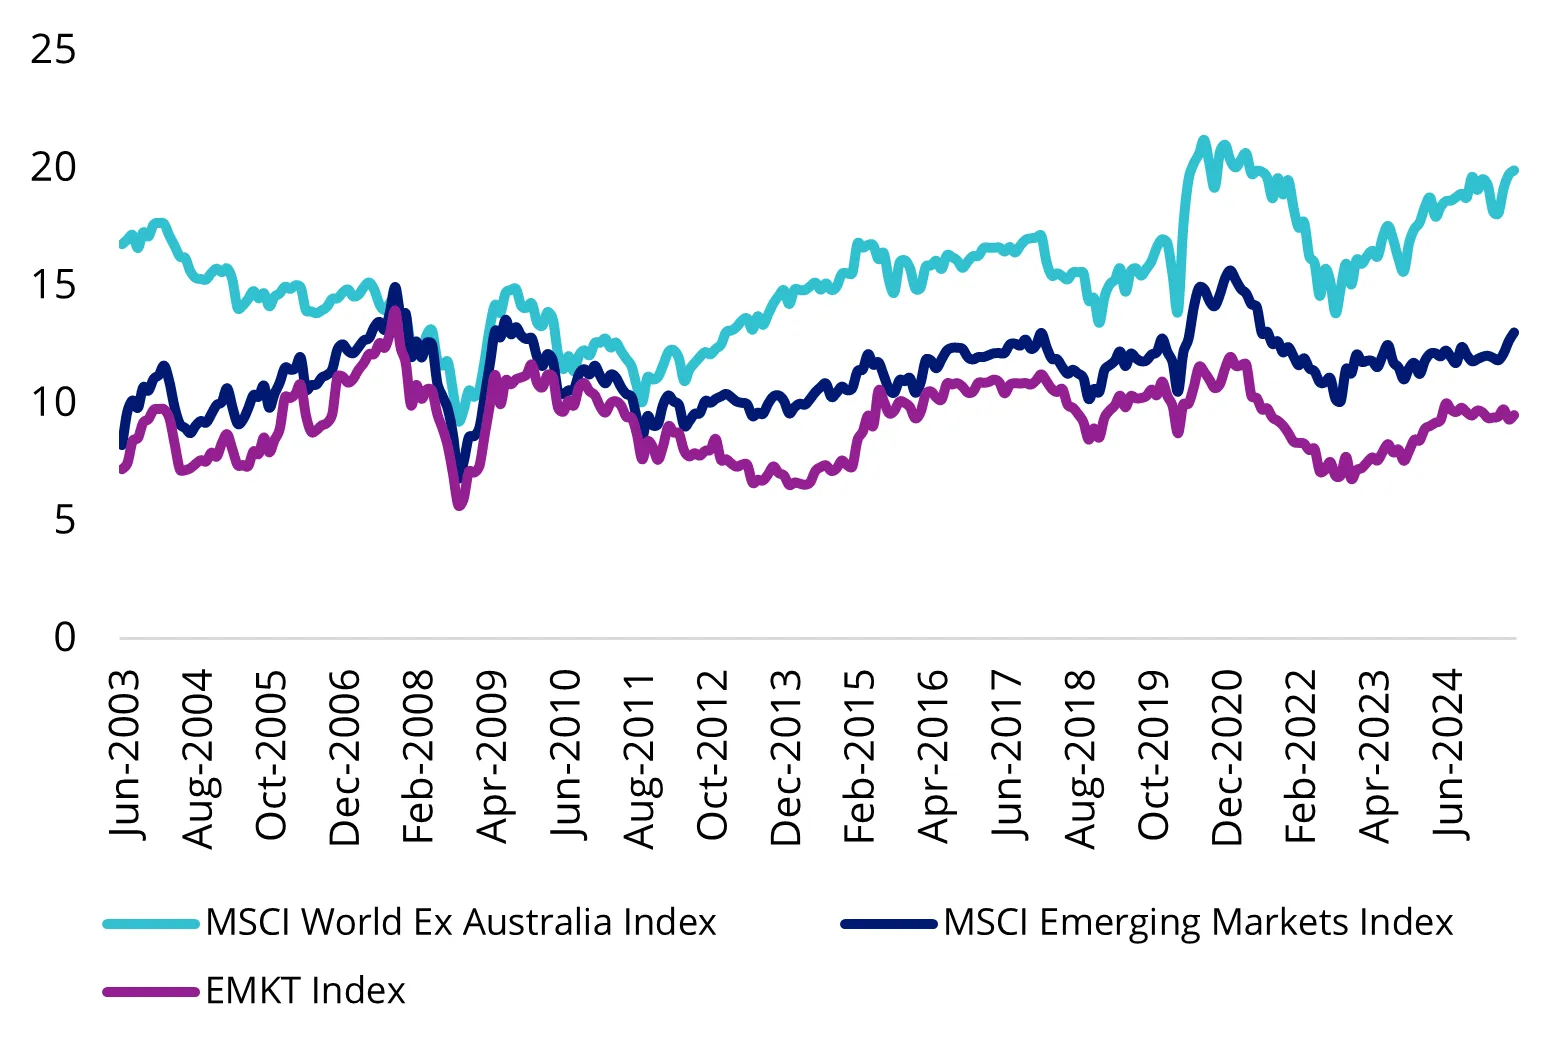
Emerging markets, relative to developed markets equities are relatively cheap. Emerging markets equities, as represented by the MSCI Emerging Markets Index are currently trading at 35% and 48% discount on a price-to-earnings (P/E) and a price-to-book (P/B) basis to developed markets, respectively. Both of these are near historical lows. The MSCI Emerging Markets Multi-Factor Select Index (EMKT Index), offers lower valuation ratios, so it potentially represents value.
Chart 4: P/E of developed markets and emerging markets
Source: MSCI, FactSet, January 2004 to July 2025. You cannot invest in an index.
Chart 5: P/B of developed markets and emerging markets
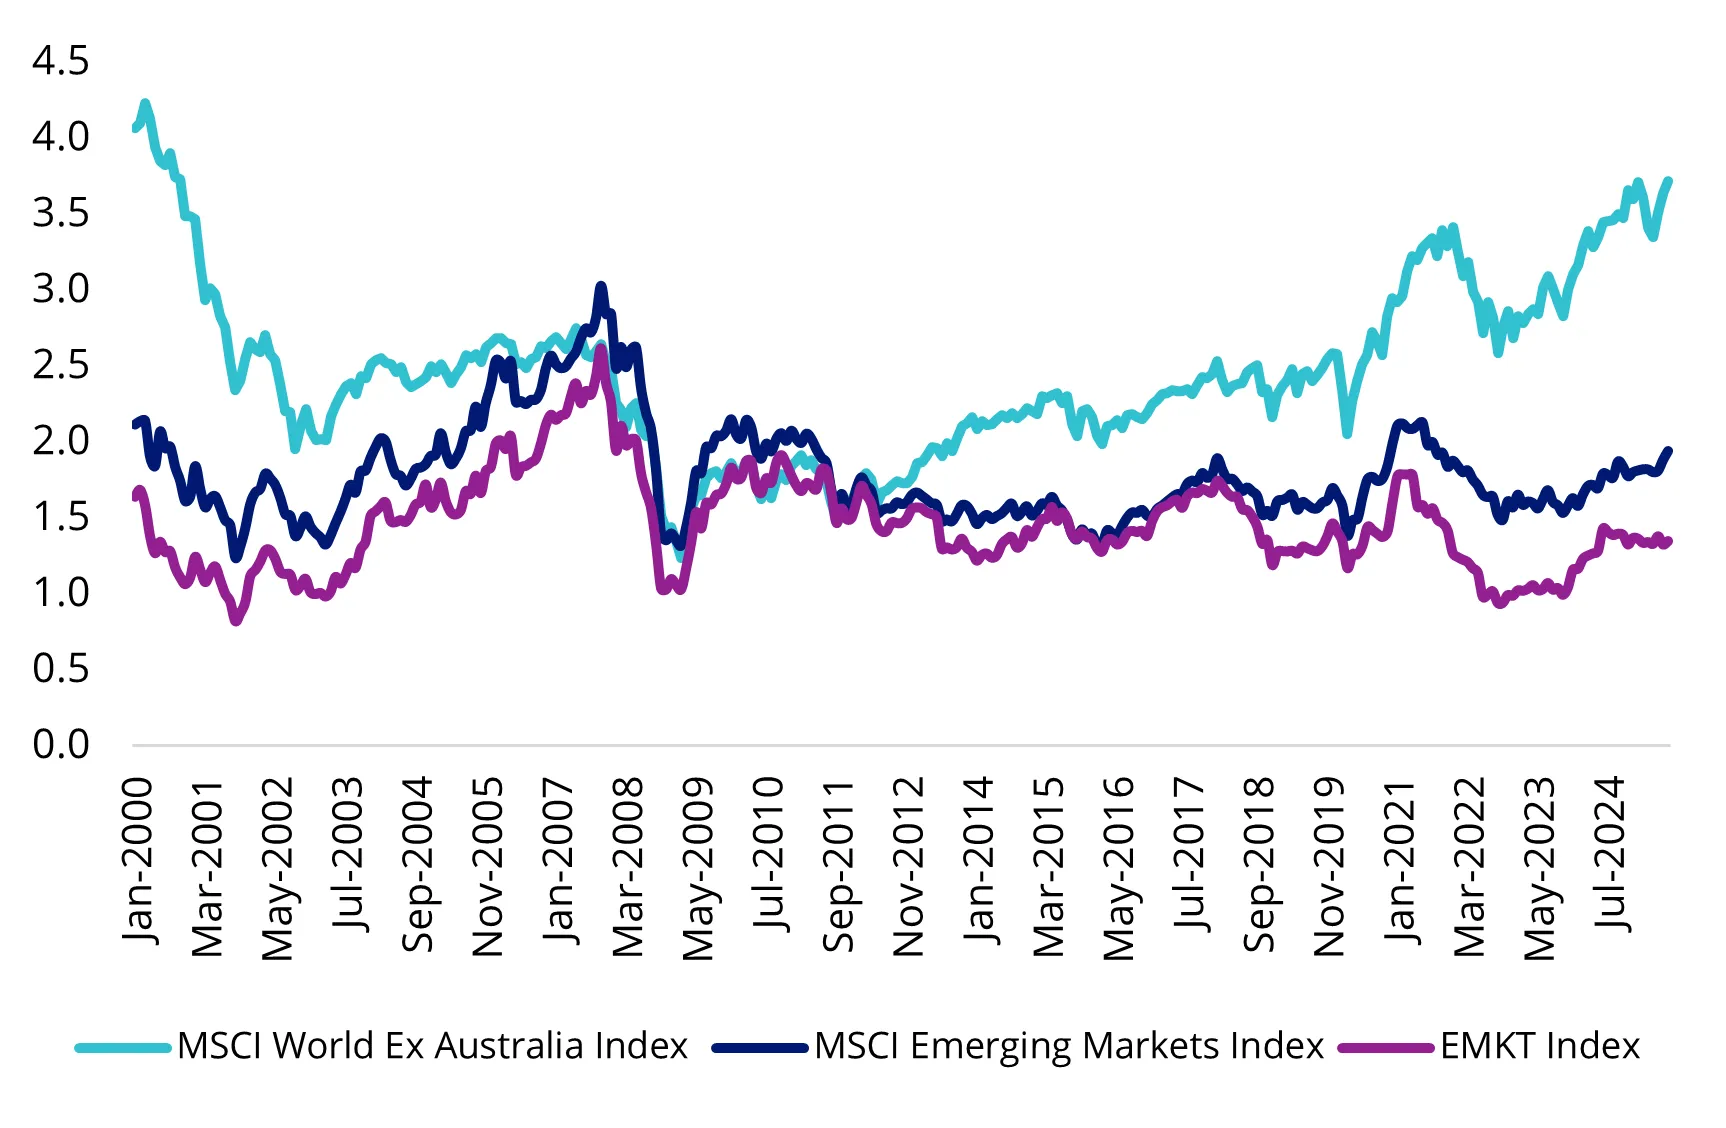
Source: MSCI, FactSet, January 2004 to July 2025. You cannot invest in an index.
Why emerging markets?
For investors, the recent volatility in all markets has them wondering where to find value and long-term opportunity. There are a few reasons we believe emerging markets are one of the most mispriced asset classes:
- The mismatch between the size of emerging markets economies and the size of their capital markets creates a long-term opportunity for investors. In addition, these capital markets are evolving, emerging to become as strong and competitive as developed markets in some instances.
- Emerging markets are responsible for over 50% of the world’s GDP, yet their equity markets only represent less than 15% of the market capitalisation of all international equities.
- Demographic and urbanisation trends should provide supportive tailwinds for long-term growth. 87% of the world’s population is in emerging markets, and these populations are younger than developed markets. Over 75% of the world’s population aged between 15 and 24 are living in developing and emerging markets.
We have said this before, but many emerging markets have matured. Traditionally, the investment returns have been closely correlated to the rise and fall of commodities and global growth expectations. Over the past 20 years, this has been changing. Many of the world’s leading technology, consumer and healthcare companies are listed on emerging markets exchanges.
Emerging markets themselves are not a monolith. Many have learned from the lessons of the past and undertaken economic reforms, as a result, these economies may be able to achieve a more stable and higher level of growth. Many emerging market economies are better able to implement counter-cyclical fiscal expansion to reignite domestic growth because of their growing foreign reserves, strong budgets and robust balance of payments. This helps the companies in these countries. Most central banks in emerging markets are independent of the fiscal arm of government. What this allowed was that many emerging markets central banks hiked rates higher and earlier than most developed markets during the post-COVID inflation spike, and they were not hampered by the after-effects of unorthodox monetary policy.
Therefore, many emerging markets companies are more resilient against tariffs and other inflationary cost pressures, having recently dealt with inflation, and they came out the other side with higher forward earnings growth.
However, not all companies in the MSCI Emerging Markets Index are desirable from an investment standpoint.
This is where being selective in emerging markets equities can come to the fore.
Investing in emerging markets is no easy feat
Selective investment in emerging markets has traditionally been the domain of expensive active managers, and returns between them vary significantly from year-to-year. This is because it is almost impossible for active managers to time factors in emerging markets.
The VanEck MSCI Multifactor Emerging Markets Equity ETF (ASX: EMKT) tracks the MSCI Emerging Markets Multi-Factor Select Index (EMKT Index), which includes companies on the basis of four factors: Value, Momentum, Low Size and Quality. The result is a portfolio that, at last rebalance, includes 227 companies diversified across 22 countries.
EMKT has outperformed since it launched on ASX in 2018. As always noting, past performance is not indicative of future performance.
Table 1: EMKT performance as at 31 July 2025

Source: VanEck, Morningstar Direct.
# EMKT inception date is 10 April 2018 and a copy of the factsheet is here.
Performance is calculated net of management costs, calculated daily but do not include brokerage costs or buy/sell spreads of investing in EMKT. Past performance is not a reliable indicator of future performance. The MSCI Emerging Markets Index (“MSCI EMI”) is shown for comparison purposes as it is the widely recognised benchmark used to measure the performance of emerging markets large- and mid-cap companies, weighted by market capitalisation. EMKT’s index measures the performance of emerging markets companies selected on the basis of their exposure to value, momentum, low size and quality factors, while maintaining a total risk profile similar to that of the MSCI EMI, at rebalance. EMKT’s index has fewer companies and different country and industry allocations than MSCI EMI. Click here for more details.
EMKT’s performance, to the end of last month, puts it in the top quartile of active peers so far this year and over one, three, five years, and since its inception. What’s also apparent in the below is that over these time periods the index is beating a large majority of more expensive active funds that aim to outperform it.
Chart 6: Performance relative to active emerging market manager peer group
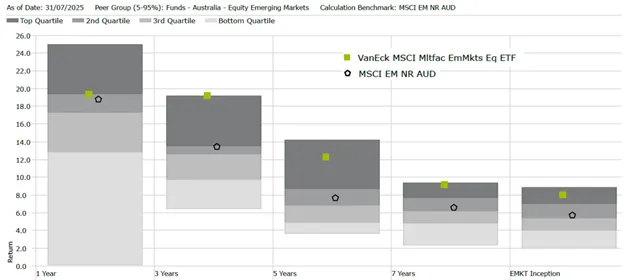
Source: Morningstar. EMKT inception date is 10 April 2018. Past performance is not a reliable indicator of future performance. Results are calculated to the last business day of the month and assume immediate reinvestment of distributions. Results are net of management fees and other costs incurred in the fund, but before brokerage fees and bid/ask spreads. Returns for periods longer than one year are annualised. Peer group Equity Region Emerging Markets funds invest in companies listed in emerging markets from around the globe. Emerging market securities typically account for at least 75% of the portfolio.
Key risks: All investments carry risk. An investment in EMKT carries risks associated with ASX trading time differences, emerging markets, financial markets generally, individual company management, industry sectors, foreign currency, country or sector concentration, political, regulatory and tax risks, fund operations, liquidity and tracking an index. See the PDS and TMD for details.
Published: 18 August 2025
Any views expressed are opinions of the author at the time of writing and is not a recommendation to act.
VanEck Investments Limited (ACN 146 596 116 AFSL 416755) (VanEck) is the issuer and responsible entity of all VanEck exchange traded funds (Funds) trading on the ASX. This information is general in nature and not personal advice, it does not take into account any person’s financial objectives, situation or needs. The product disclosure statement (PDS) and the target market determination (TMD) for all Funds are available at vaneck.com.au. You should consider whether or not an investment in any Fund is appropriate for you. Investments in a Fund involve risks associated with financial markets. These risks vary depending on a Fund’s investment objective. Refer to the applicable PDS and TMD for more details on risks. Investment returns and capital are not guaranteed.
QUAL is indexed to a MSCI index. QUAL is not sponsored, endorsed or promoted by MSCI, and MSCI bears no liability with respect to QUAL or the MSCI Index. The PDS contains a more detailed description of the limited relationship MSCI has with VanEck and QUAL.


