Weight of debt supports wait on gold
Exploding debt levels are increasing financial risks that may potentially lead to the next economic crisis and reward an allocation to gold.
Gold and gold stocks decline in July on US dollar strength, disappointing Q2 results of majors
Paradigm Capital reports that the number of Google searches to buy gold has dropped to the lowest since July 2007, just before the global financial crisis. Meanwhile, according to The Wall Street Journal, Dealogic reports that newly listed tech stocks are up roughly 52% on average from their IPO price in 2018. The divergence between safe haven and speculative investments seems to be reaching extremes.
The lack of interest in gold is reflected in the July price decline of US$29.08 (2.3%) to US$1,224.09 per ounce, a 12-month low. Similar to June, US dollar strength and weak metals prices weighed on gold last month. The dollar held on to its June gains and the US Dollar Index (DXY Index) established a fresh 12-month high following the 17 July Congressional testimony by Federal Reserve Chairman Jerome Powell, who delivered an upbeat assessment of the economy. US second quarter GDP growth hit 4.1%, but we question its sustainability. Declining trends in housing starts and sales suggest the Trump tax stimulus has run its course, while tariffs may eventually hamper growth. Also, 4.1% growth is relatively weak according to Gluskin Sheff who found that real growth averaged 5.5% in the quarter following the four tax cuts of similar magnitude since 1960.
The NYSE Arca Gold Miners Index fell 4.4%, which reflects the disappointing second quarter results of several of the large gold companies. Barrick Gold, Agnico Eagle and Goldcorp reported earnings below market expectations. Reasons included higher taxes, timing of sales, and realised prices. Operating and cost results were as expected, and all maintained their 2018 guidance. The lone exception was Agnico, which raised its production guidance by 50,000 ounces (3%). It seems these companies were unduly punished in a thin summer market, and we expect the stocks to recover in the second half of the year. Apart from these three companies, second quarter results have been positive for other majors and mid-tiers that have reported so far.
Divergence in flows likely due to attractive valuations of miners
There has been a striking divergence in flows of gold bullion and gold equity exchange traded funds (ETFs). In the US over the last two months, gold bullion ETFs have seen steady outflows with bullion holdings falling 3.2%. Over the same period, the gold equity ETFs, VanEck Vectors Gold Miners ETF (GDX) and VanEck Vectors Junior Gold Miners ETF (GDXJ), have seen their share counts increase steadily by 19.8% and 10.2%, respectively. We do not know what is causing the divergence, but suspect it might be positioning by investors aware of the valuation discount in gold miners. RBC Capital Markets calculates average price/cash flow for mid-tiers and majors of roughly 7x, compared to a long-term average of 11x.
Gold consolidating base, poised for second half rally with market catalyst coming next year
We thought the gold market would rally following the June Fed rate increase, as it has for each rate increase over the last two years. However, the fall in the gold price to its yearly lows has caused us to adjust our outlook. The rising trend of higher lows discussed in our May update has failed, and gold seems to be establishing a new pattern with a base around the US$1,200 per ounce level. Net speculative futures positioning is approaching levels last seen at the bottom of the bear market in December 2015. This, along with recent redemptions in the bullion ETFs, suggest gold is oversold. In addition, the DXY Index appears to be topping out. We believe the gold market is poised for a rally in the second half. However, given current sentiment and price action, it is doubtful the metal can achieve new highs above the US$1,365 “ceiling” discussed in our May update. The gold price continues to consolidate a solid base, but it looks like a catalyst that moves it to a higher range may not appear until later in 2019.
Exploding debt could blow up economy into crisis
The following chart from the Congressional Budget Office (CBO) should scare the daylights out of every citizen in the US In fact, every citizen of China should be equally alarmed as their government is the largest holder of US Treasuries.
U.S. Federal Debt Held by Public as a % of GDP
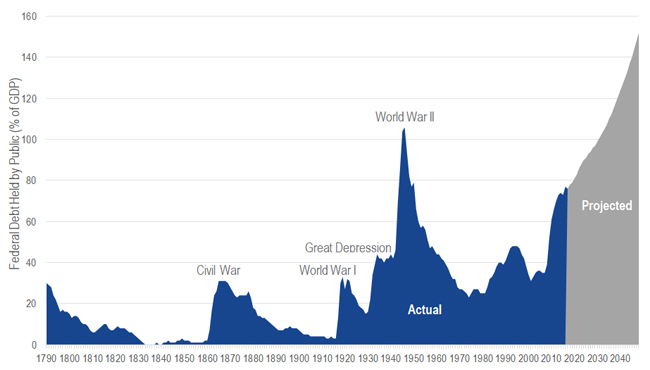
Source: Congressional Budgetary Office, The Long-Term Budget Outlook, June 2018. For illustrative purposes only.
Public debt amounts to US$121,000 per US household. The Treasury set a record in the first quarter by borrowing US$488 billion. In April, the CBO estimated interest payments on the national debt will roughly triple to US$915 billion in ten years. The Trump tax law specifies that most individual tax breaks will disappear after 2025. The CBO estimates that if Congress extends the breaks, the cumulative deficit will rise a further US$2.6 trillion over the next decade. A few more debt related statistics:
- Federally guaranteed student debt is nearly US$1.4 trillion. An Education Department report last November forecasted a US$36 billion shortfall in government student loan programs. A year earlier it forecasted an US$8.4 billion shortfall. Prior to that it forecasted billions in surpluses. This is a disturbing trend for taxpayers.
- Social Security costs will exceed its income this year, three years sooner than expected a year ago. The trust fund will be depleted in 2034, a year sooner than expected in last year’s report. Medicare and Medicaid face a similar deterioration in their trust funds.
- Corporate debt amounts to 45% of GDP, a level last seen in the financial crisis of 2008 and, before that, around the tech bust in 2001.
- The Wall Street Journal finds that in 2017 leveraged lending reached a new high of US$1.6 trillion globally and new issues surpassed the previous record in 2007. Most leveraged loans are “covenant-lite”, with fewer restrictions on collateral, payment terms and level of income.
- Grant’s Interest Rate Observer in its 23 March edition cites Bianco Research, which finds 14.6% of S&P 1500 companies are zombies, meaning their earnings before interest and taxes fail to cover their interest expense. That’s up from 5.7% in the fourth quarter of 2007, just before the Great Recession.
- According to Gluskin Sheff, at the peak of the last credit bubble, the amount of US debt across household, business and government totaled US$27 trillion, or 225% of GDP. A decade later it is now nearly US$50 trillion, or 250% of GDP. Meanwhile, the global economy has added US$25 trillion of debt in just the past year to reach 318% of global GDP.
Both US political parties have made it clear through their actions that they are not interested in reducing, or even stabilizsng, the growth in debt. Likewise, voters are not willing to hold their leaders fiscally accountable. We believe debt will continue to grow until it brings a crisis, just as sub-prime mortgages grew until 2008 when a crisis forced lenders and borrowers to stop. The difference now is that government debt is at the center of the current credit bubble. Politicians have not been willing to raise taxes or cut spending. Some call for higher taxes on the wealthy, but we believe such taxes have limitations and would not make a significant difference. High earners in states such as New York and California already have marginal rates for combined federal, state, and local taxes of around 50%.
Australia provides a model for proper fiscal and monetary behavior. We are enjoying an amazing 27-year expansion. According to The Wall Street Journal, prior to the financial crisis, we reduced government debt from 32% of GDP in 1994 to just 10% in 2007. The Reserve Bank of Australia (RBA) did not make the mistake of leaving rates too low for too long. When the crisis came, the benchmark rate was 7.25%, leaving plenty of room to stimulate growth without manipulating negative rates.
Unfortunately, we know of no other developed nation that can claim such diligence. We believe the full weight of the global debt load will be felt in the next economic downturn. With Fed tightening currently underway, we believe that the 4.1% second quarter GDP growth is an aberration and the downturn might come sooner than most people think. The next debt crisis might bring money printing, monetisation of debt, and other policies that are even more radical than those following the last crisis.
While the prices of gold and gold shares have been in a soft spot for longer than we anticipated, we feel the potential financial risks on the horizon suggest that patience will ultimately pay off.
IMPORTANT DEFINITIONS AND DISCLOSURES
Nothing in this content should be considered a solicitation to buy or an offer to sell shares of any investment in any jurisdiction where the offer or solicitation would be unlawful under the securities laws of such jurisdiction, nor is it intended as investment, tax, financial, or legal advice. Investors should seek such professional advice for their particular situation and jurisdiction.
Any indices listed are unmanaged indices and include the reinvestment of all dividends, but do not reflect the payment of transaction costs, advisory fees or expenses that are associated with an investment in a Fund. Certain indices may take into account withholding taxes. An index’s performance is not illustrative of a Fund’s performance. Indices are not securities in which investments can be made.
NYSE Arca Gold Miners Index is a service mark of ICE Data Indices, LLC or its affiliates (“ICE Data”) and has been licensed for use by VanEck Vectors ETF Trust (the “Trust”) in connection with VanEck Vectors Gold Miners ETF (the “Fund”). Neither the Trust nor the Fund is sponsored, endorsed, sold or promoted by ICE Data. ICE Data makes no representations or warranties regarding the Trust or the Fund or the ability of the NYSE Arca Gold Miners Index to track general stock market performance.
ICE DATA MAKES NO EXPRESS OR IMPLIED WARRANTIES, AND HEREBY EXPRESSLY DISCLAIMS ALL WARRANTIES OF MERCHANTABILITY OR FITNESS FOR A PARTICULAR PURPOSE WITH RESPECT TO THE NYSE ARCA GOLD MINERS INDEX OR ANY DATA INCLUDED THEREIN. IN NO EVENT SHALL ICE DATA HAVE ANY LIABILITY FOR ANY SPECIAL, PUNITIVE, INDIRECT, OR CONSEQUENTIAL DAMAGES (INCLUDING LOST PROFITS), EVEN IF NOTIFIED OF THE POSSIBILITY OF SUCH DAMAGES.
MVIS Global Junior Gold Miners Index (the “Index”) is the exclusive property of MV Index Solutions GmbH (a wholly owned subsidiary of Van Eck Associates Corporation), which has contracted with Solactive AG to maintain and calculate the Index. Solactive AG uses its best efforts to ensure that the Index is calculated correctly. Irrespective of its obligations towards MV Index Solutions GmbH, Solactive AG has no obligation to point out errors in the Index to third parties. The VanEck Vectors Junior Gold Miners ETF (the “Fund”) is not sponsored, endorsed, sold or promoted by MV Index Solutions GmbH and MV Index Solutions GmbH makes no representation regarding the advisability of investing in the Fund.
Please note that the information herein represents the opinion of the author, but not necessarily those of VanEck, and this opinion may change at any time and from time to time. Non-VanEck proprietary information contained herein has been obtained from sources believed to be reliable, but not guaranteed. Not intended to be a forecast of future events, a guarantee of future results or investment advice. Historical performance is not indicative of future results. Current data may differ from data quoted. Any graphs shown herein are for illustrative purposes only. No part of this material may be reproduced in any form, or referred to in any other publication, without express written permission of VanEck.
Related Insights


Published: 22 August 2018