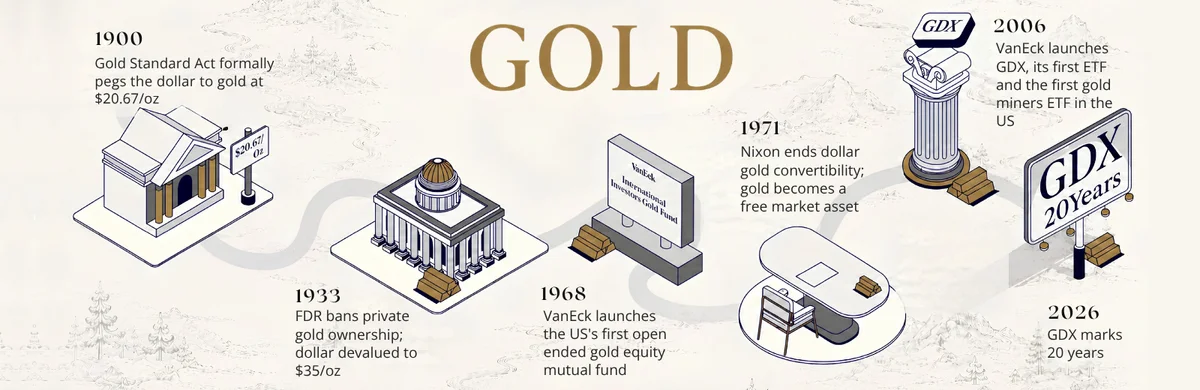
Examining gold’s recovery cycles
While the outcome of this most recent market sell-off and related pandemic are yet-to-be-seen, we remain optimistic about the outlook for gold and gold stocks in the near-term. Much of the market movement in gold prices is relatively easy to explain, while gold companies continue to exhibit, we believe, truly compelling fundamentals and valuations. With respect to the pandemic, companies are taking all precautions, and although we do anticipate that some operations will be impacted, discussions we have had with companies indicate that every effort is being made to ensure inventories, supply lines, employee health and back-up redundancies are in place to sustain production.
Below is a summary of our most recent takeaways.
We believe there are, predominately, two reasons why gold has been under pressure as of late.
- 1. Unwinding of hedged positions in risk parity and other volatility model funds – Gold, commodity and fixed income investments are typically leveraged in risk parity models (based on their underlying volatility relative to equities), so substantial liquidations in these funds have led to outsized, forced selling of these assets.
- 2. Liquidations to raise cash – Selling to meet margin calls and raising cash to cover stock market losses, especially among leveraged funds, is commonplace during market sell-offs.
We believe that gold/gold stocks tend to recover faster than the broader markets following crises.
- More recently, during the 2008 financial crisis, gold and gold stocks bottomed and recovered much earlier than the S&P 500—recouping losses at/around the time the S&P reached its lows in February/March 2009. The S&P 500 took nearly two years to reach its pre-crisis levels again.
Gold and gold stocks recovered before S&P 500 during 2008 financial crisis
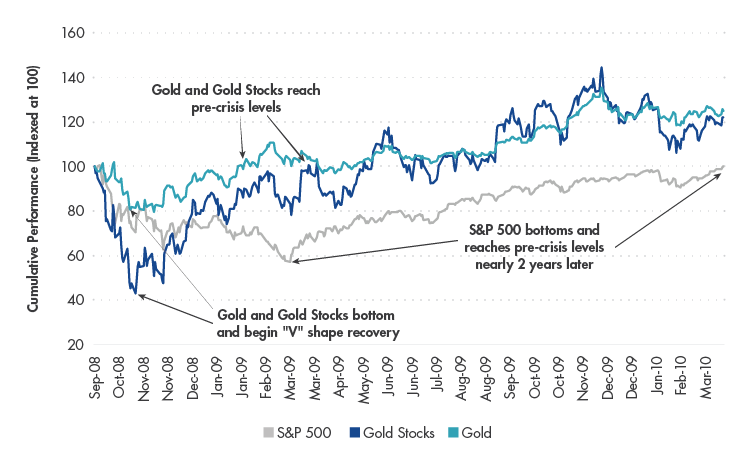
Source: VanEck, Bloomberg. Data as of March 2020. “S&P 500” represented by the S&P 500 Index TR (SPXT). “Gold Stocks” represented by the NYSE Arca Gold Miners Index Net Total Return (GDMNTR). “Gold” represented by gold spot prices.
- Looking at other past market sell offs, gold has held up particularly well while gold stocks—though often following the broader equity market through a drawdown—have, on the whole, outperformed over the full cycle (drawdown to recovery).
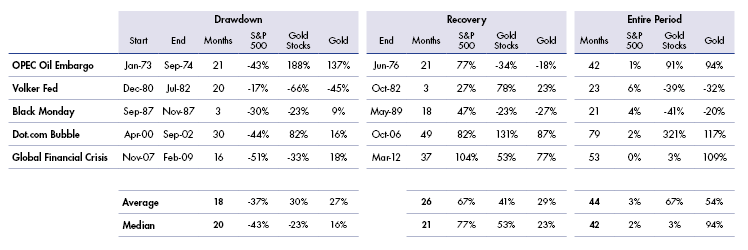
Source: VanEck, Bloomberg. Data as of March 2020. Index returns are cumulative. “S&P 500” represented by the S&P 500 TR Index (SPXT). “Gold Stocks” represented by Barron’s Gold Mining Index (BGMI) from January 1973 to inception date of the Philadelphia Gold and Silver Index (XAUTR) in January 1984 and XAUTR to the inception of the NYSE Arca Gold Miners Index Net Total Return (GDMNTR) in October 1993. “Gold” represented by gold spot prices
We believe that gold stocks, generally speaking, remain in fundamentally good shape.
- We expect no credit problems, while the lengths to which companies have gone to reduce costs and capital expenditures and to avoid mistakes of the past could translate to an additional near 40% increase in free cash flow, on average, for a gold price move from $1,600 to $1,800 (for seniors and mid-tiers).
Estimated free cash flow for gold price moves
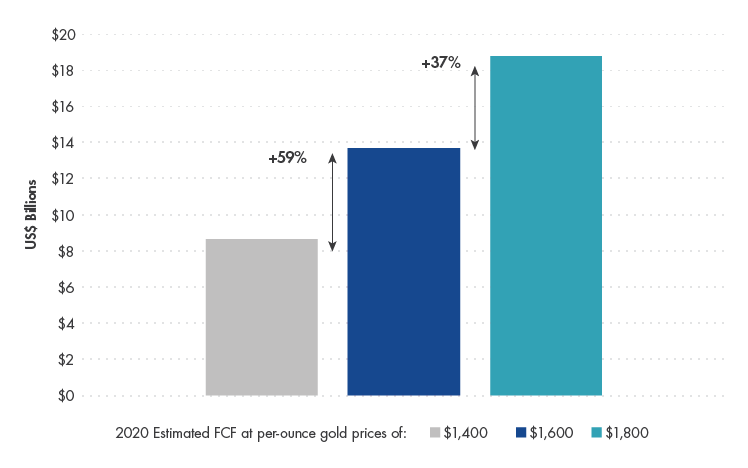
Source: VanEck, Bloomberg. Data as of March 2020. “Senior” miners defined by production levels of approximately 1.5-6.0 million ounces of gold per year (“Mid-Tier” approximately 0.3-1.5 million ounces per year).
IMPORTANT DISCLOSURE
Issued by VanEck Investments Limited ABN 22 146 596 116 AFSL 416755 (‘VanEck’). This is general information only about financial products and not personal financial advice. It does not take into account any person’s individual objectives, financial situation or needs. Before making an investment decision, you should read the relevant PDS and with the assistance of a financial adviser consider if it is appropriate for your circumstances. PDSs are available at www.vaneck.com.au or by calling 1300 68 38 37.
No member of VanEck group of companies gives any guarantee or assurance as to the repayment of capital, the payment of income, the performance, or any particular rate of return of any VanEck funds. Past performance is not a reliable indicator of future performance.
VanEck is the responsible entity and issuer of units in the VanEck Vectors ETFs traded on ASX. All investments carry some level of risk. Investing in international markets has specific risks that are in addition to the typical risks associated with investing in the Australian market. These include currency/foreign exchange fluctuations, ASX trading time differences and changes in foreign regulatory and tax regulations.
NYSE Arca Gold Miners Index is a trademark of ICE Data Indices, LLC or its affiliates (“ICE Data”) and has been licensed for use by VanEck in connection with the US Fund. Neither the Trust nor the Fund is sponsored, endorsed, sold or promoted by ICE Data. ICE Data makes no representations or warranties regarding the Trust or the Fund or the ability of the NYSE Arca Gold Miners Index to track general stock market performance.
ICE DATA MAKES NO EXPRESS OR IMPLIED WARRANTIES, AND HEREBY EXPRESSLY DISCLAIMS ALL WARRANTIES OF MERCHANTABILITY OR FITNESS FOR A PARTICULAR PURPOSE WITH RESPECT TO THE NYSE ARCA GOLD MINERS INDEX OR ANY DATA INCLUDED THEREIN. IN NO EVENT SHALL ICE DATA HAVE ANY LIABILITY FOR ANY SPECIAL, PUNITIVE, INDIRECT, OR CONSEQUENTIAL DAMAGES (INCLUDING LOST PROFITS), EVEN IF NOTIFIED OF THE POSSIBILITY OF SUCH DAMAGES.
Please note that the information herein represents the opinion of the author, but not necessarily those of VanEck, and this opinion may change at any time and from time to time. Non-VanEck proprietary information contained herein has been obtained from sources believed to be reliable, but not guaranteed. Not intended to be a forecast of future events, a guarantee of future results or investment advice. Historical performance is not indicative of future results. Current data may differ from data quoted. Any graphs shown herein are for illustrative purposes only. No part of this material may be reproduced in any form, or referred to in any other publication, without express written permission of VanEck.
©2020 VanEck


Published: 18 March 2020