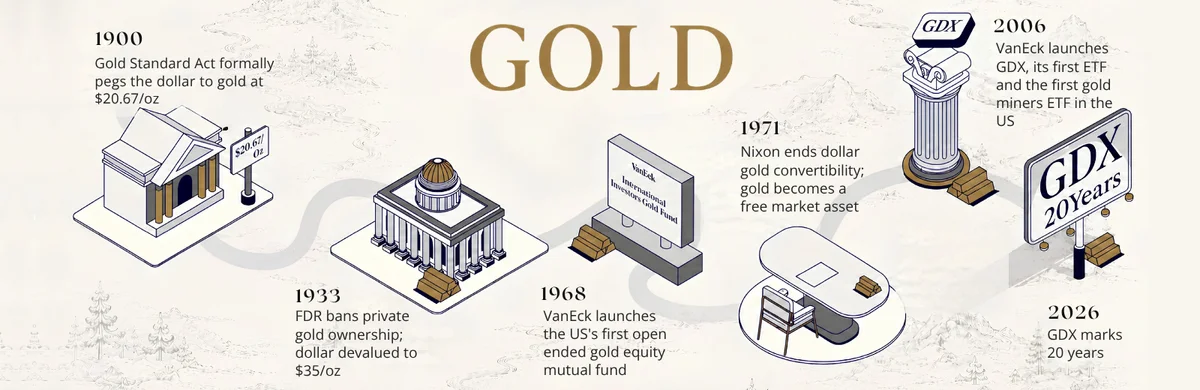
It’s been a gold rush before Paris
Gold has been one of the best-performing asset classes so far in 2024. Its value rose 11.36% over the first quarter of the year (1 January 2024 to 31 March 2024. See charts below for more performance history).
Its momentum has continued. It hit a record high of US$2,330.40 earlier this month.
The price movements have had many analysts scratching their heads because normally when risky assets such as equities do well, defensive assets, such as gold, do poorly.
But that has not been the case recently, with both ‘risky’ equities and ‘defensive’ gold performing well.
In addition, when interest rates are expected to fall, as many are predicting will occur in the second half of 2024, gold has historically not done well. It’s therefore worth understanding what could be driving the price of gold to understand why demand for the yellow metal could continue.
Firstly, central banks have been stockpiling gold. According to the World Gold Council, central banks net gold purchases totaled 1,037 tons in 2023. It was the second straight year central banks added more than 1,000 tons to their total reserves.
Chart 1: Central bank demand for gold rose in 2023
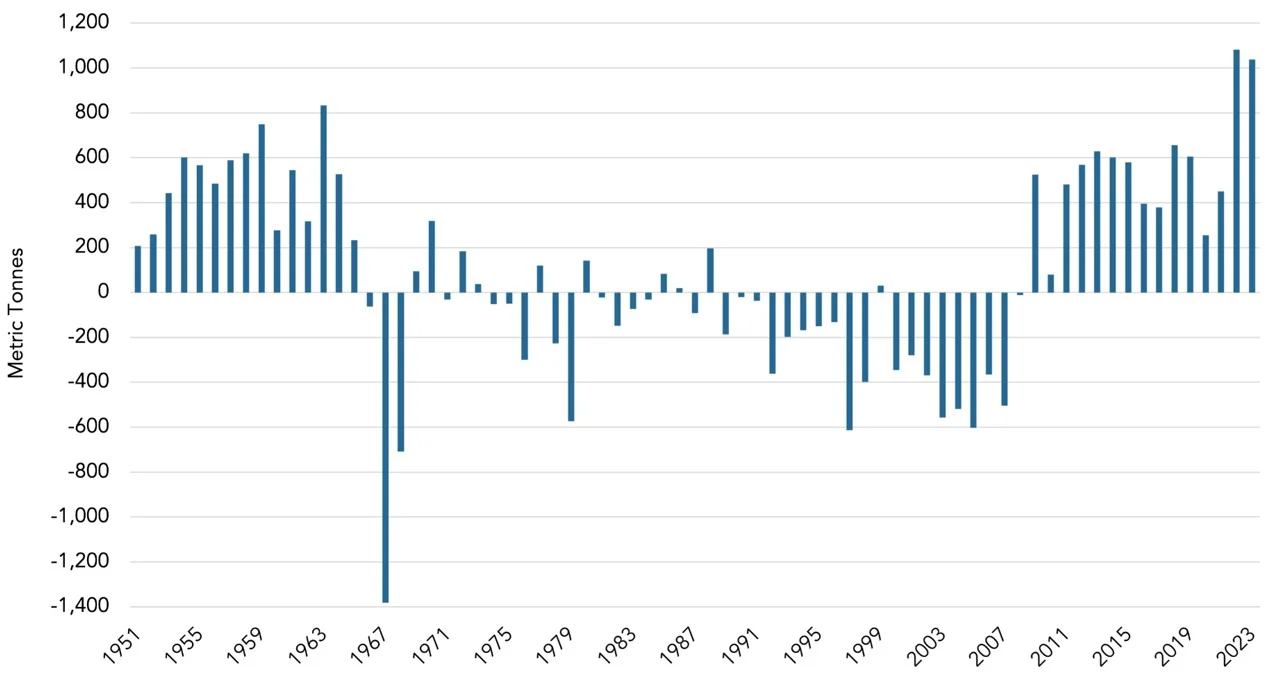
Source: World Gold Council
The year prior, central bank gold buying in 2022 came in at 1,136 tons which was the highest level of net purchases on record dating back to 1950.
China was the biggest buyer in 2023 and its buying has continued in 2024. There is much speculation about China’s gold buying. China is heavily reliant on the US dollar for trade with the rest of the world. The US dollar is the world's reserve currency, and most commodities are priced in US dollars.
Therefore, to trade, China had built up huge foreign exchange reserves, mostly in US dollars and is perhaps keen to diversify its reserves.
It has been noticeable that China has been gradually reducing its holdings in US dollars, via its US treasury holdings, and that drop has accelerated since the COVID-19 pandemic.
There has also been speculation about challengers to the world's reserve currency, with many emerging markets such as India and Brazil already trading in local currencies with China. You can see many of the other gold buyers are emerging market nations.
Chart 2: Central bank purchases comfortably outweigh sales y-t-d
Individual central bank net purchases/sales in tonnes*
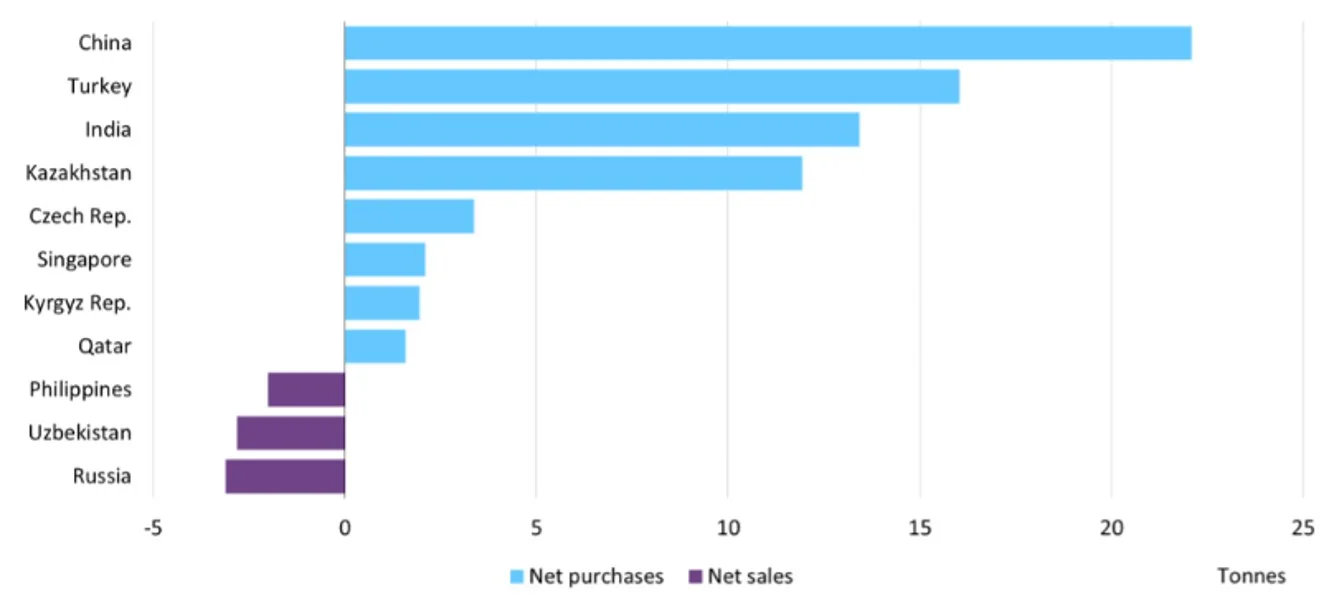
*Data to February 2024 where available.
Source: IMF IFS, respective central banks, World Gold Council
In addition to central bank buying, the other factor driving gold demand has been growing US debt. Many investors are staying away from US treasury bonds as the American economy remains embroiled in heavy, seemingly uncontrolled debt. The rationale is that rising US debt often leads to concerns about inflation. When a government accumulates a significant amount of debt, it may resort to measures such as printing more money or increasing government spending, potentially leading to inflationary pressures. With inflation still at the forefront of investors’ minds, they may be buying gold as a hedge against and return of inflation.
Chart 3: US Total Public Debt
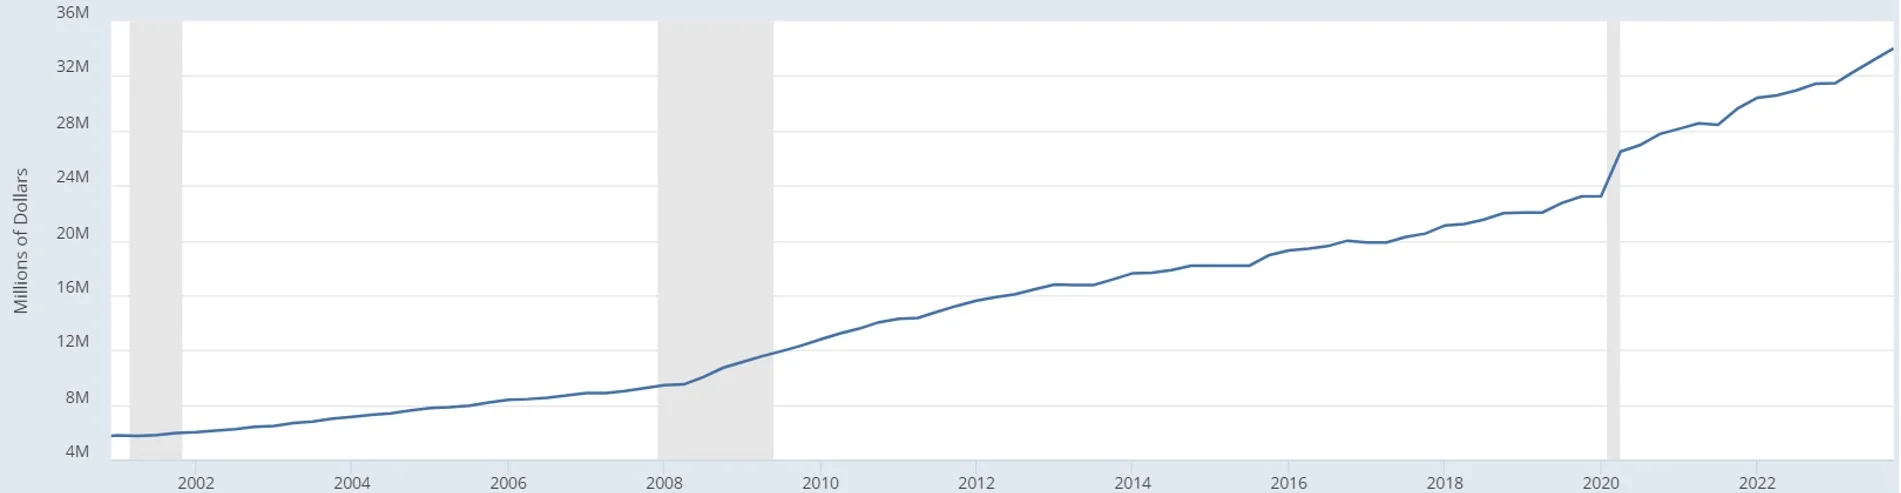
Source: St Louis Federal Reserve, U.S. Department of the Treasury. Fiscal Service. Shaded areas indicate US recessions.
It’s not just the holders of physical gold that have been benefiting recently from the rise in the price of gold.
Gold miners
Gold miners tend to outperform gold bullion when the price rises, and underperform when the gold price falls.
At the start of this gold price rally, that relationship disconnected, as the gold price rose, the price of gold miners fell. That trend recently reversed. Hard.
Since the start of March, miners have outperformed the gold price once again, and this may mark the beginning of a long-anticipated trend reversal for the gold mining equities.
We think that if the gold price continues to rise, its miners’ returns could be amplified because gold miners have retained healthy margins.
Miners were not immune from inflation and the all-in-sustaining costs have risen for gold miners since 2016. But now disciplined mining companies can generate a substantial amount of free cash flow. Cash flow in the chart below would be represented by the white space between the aqua line (the gold price) and the dark blue columns (all-in sustaining costs). As the gold price rises, so too should free cash flow.
Chart 4: Average all-in sustaining costs* versus average annual gold price (US dollars/oz)
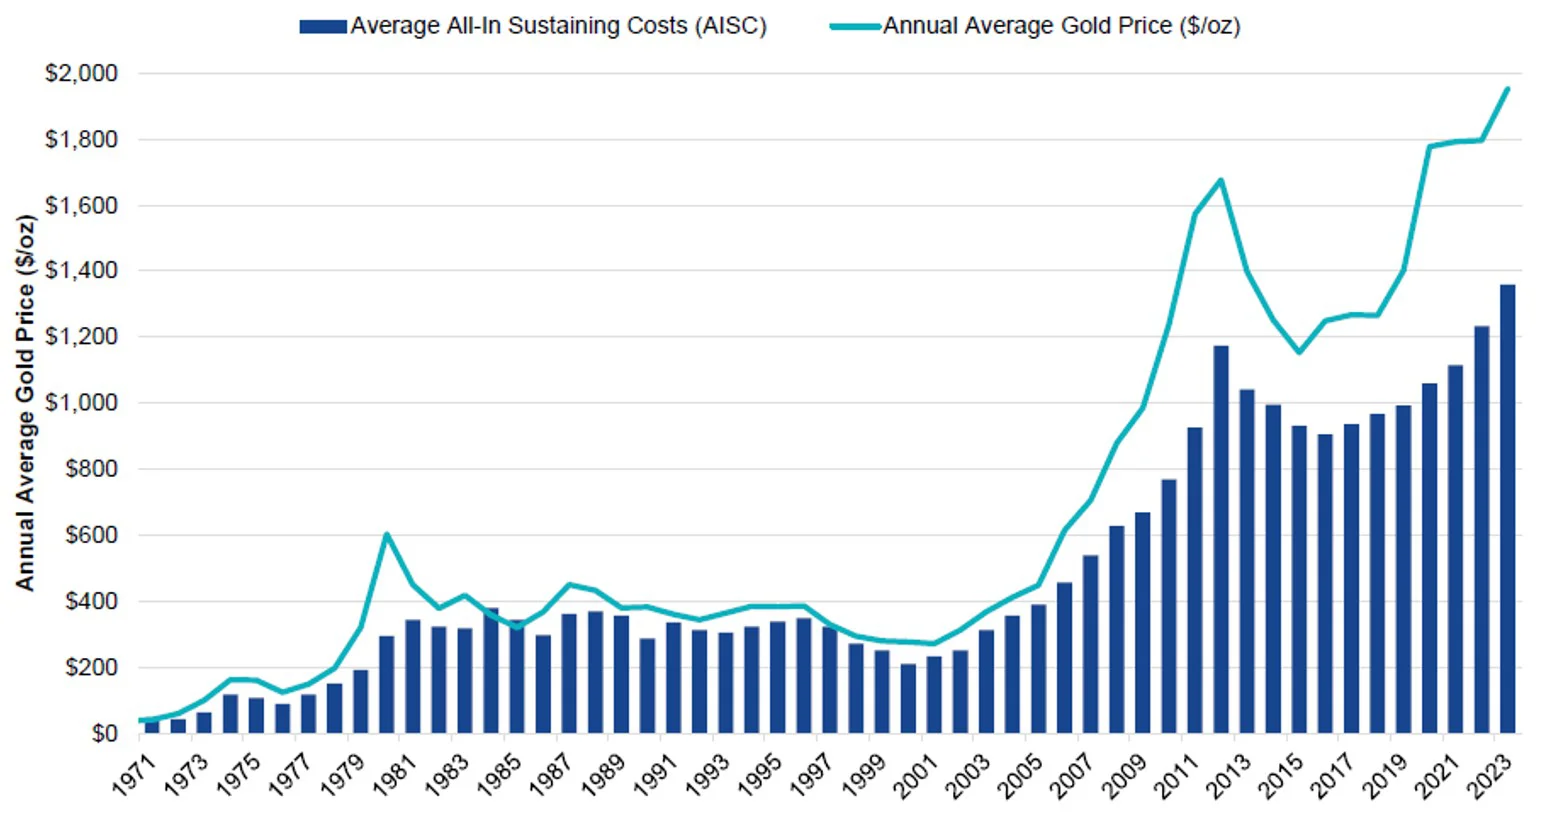
Source: Scotiabank. Data as of December 31, 2023. *All-in-sustaining costs (AISC) reflecting the full cost of gold production from current operations, including adjusted operating costs, sustaining capital expenditure, corporate general and administrative expenses and exploration expenses. Past performance is not indicative of future results.
As we highlighted in our recent VanEck ViewPoint, gold miners are trading at well below historical averages. You can see this in Chart 5 below, which shows the value of gold mining equity, measured using the GDX Index relative to the gold price. The purple line is well below the black line which is the long run average.
Chart 5: Gold companies are relatively cheap at current levels
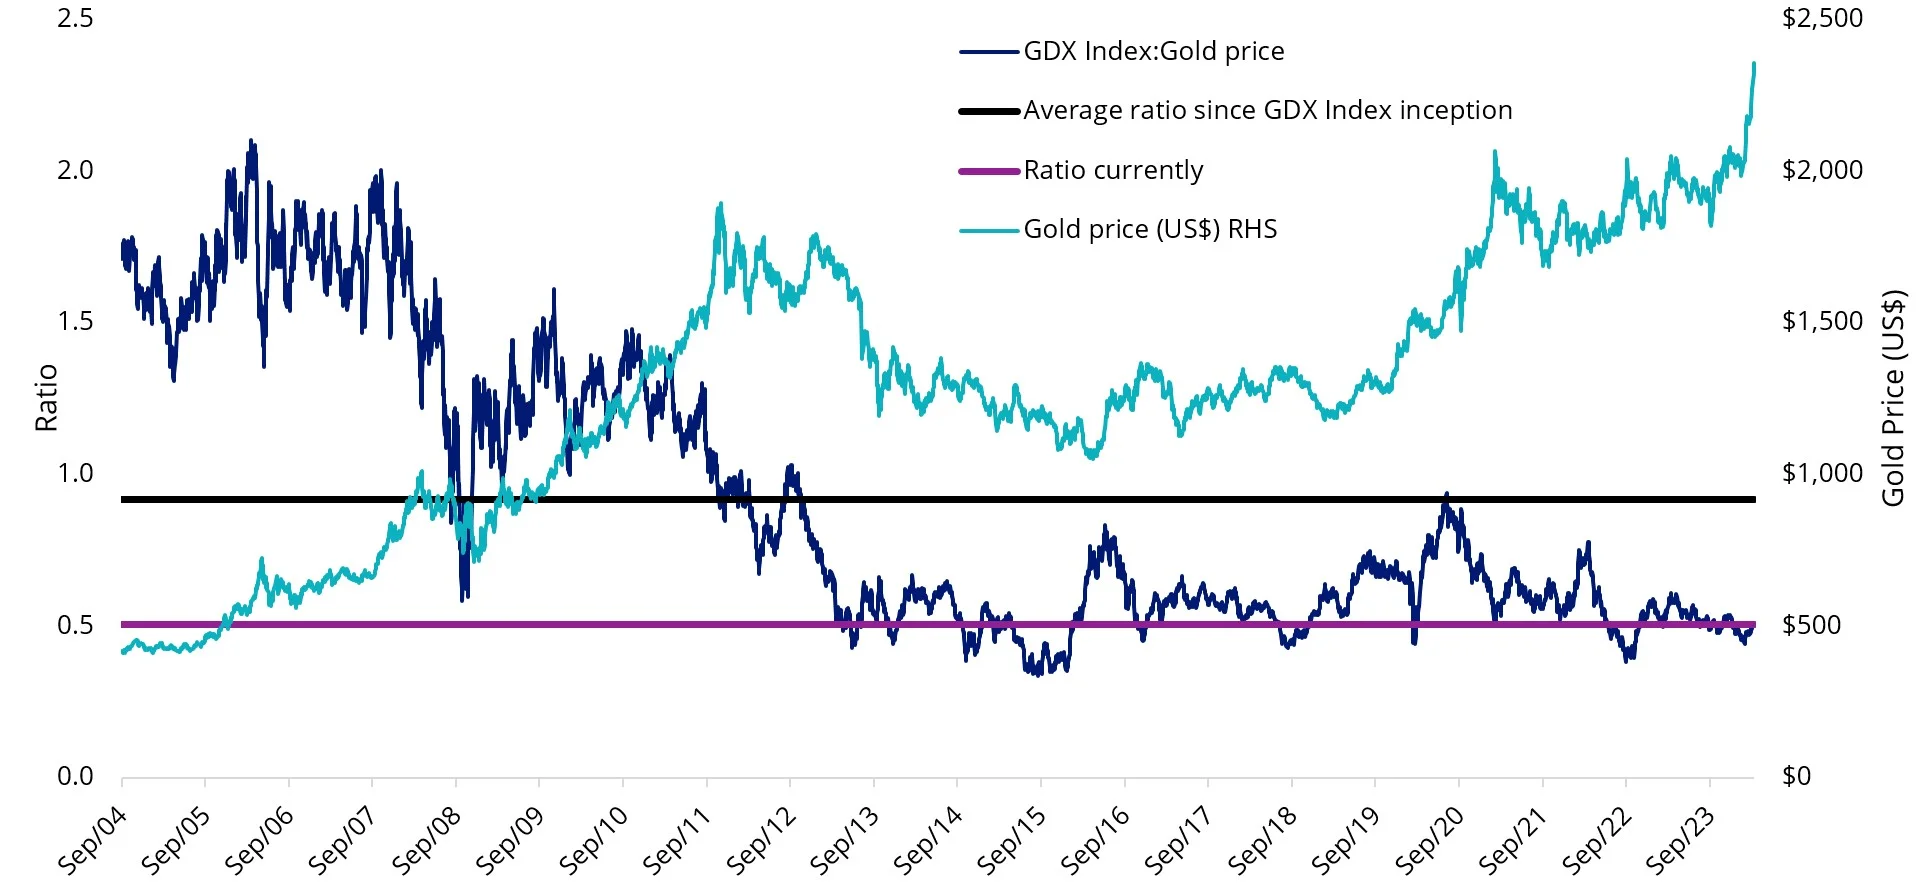
Source: Bloomberg, VanEck, as of 10 April 2024. All figures are in US dollars. GDX Index Inception is 29 September 2004. GDX Index is the NYSE Arca Gold Miners Index. You cannot invest directly in an index. Gold price is LBMA PM Gold Price. Past performance is not a reliable indicator of future performance.
ETFs are an efficient way for investors to access gold investing.
There are gold miners ETFs and there are ETFs that invest in physical gold bullion.
Accessing gold with the specialists
VanEck’s global leadership in gold investing stretches more than 50 years, encompassing gold equites and bullion across ETFs and active funds.
Two ETFs for portfolio considerations:
- VanEck Gold Bullion ETF (ASX: NUGG) – accessing physical gold.
NUGG is an investment in Australian-sourced gold. As an additional feature, NUGG ‘delivers’ by being physically redeemable; an investor who has opened an account in their own name with The Perth Mint may convert their ETF holdings into physical gold bullion.
- VanEck Gold Miners ETF (ASX: GDX) – investing in a diversified portfolio of gold mining companies
Investors seeking exposure to gold can consider investing into gold miners. The advantage of holding gold miners is that their price typically rises more than the increase in gold prices, as gold miners will add their own margins to gold production. Many miners pay dividends too, adding to the potential return.
While each gold strategy has its merit for portfolio inclusion, you should assess all the risks and consider your investment objectives.
Past performance is no guarantee of future performance. The above is not a recommendation. Please speak to your financial adviser or stock broker.


Published: 12 April 2024
Any views expressed are opinions of the author at the time of writing and is not a recommendation to act.
VanEck Investments Limited (ACN 146 596 116 AFSL 416755) (‘VanEck’) is the issuer and responsible entity of all VanEck exchange traded funds (Funds) listed on the ASX. This is general advice only and does not take into account any person’s financial objectives, situation or needs. The product disclosure statement (PDS) and the target market determination (TMD) for all Funds are available at vaneck.com.au. You should consider whether or not an investment in any Fund is appropriate for you. Investments in a Fund involve risks associated with financial markets. These risks vary depending on a Fund’s investment objective. Refer to the applicable PDS and TMD for more details on risks. Investment returns and capital are not guaranteed.
NYSE® Arca Gold Miners Index® is a trademark of ICE Data Indices, LLC or its affiliates (“ICE Data”) and has been licensed for use by VanEck in connection with the US Fund. Neither the Trust nor the Fund is sponsored, endorsed, sold or promoted by ICE Data. ICE Data makes no representations or warranties regarding the Trust or the Fund or the ability of the NYSE Arca Gold Miners Index to track general stock market performance.
ICE DATA MAKES NO EXPRESS OR IMPLIED WARRANTIES, AND HEREBY EXPRESSLY DISCLAIMS ALL WARRANTIES OF MERCHANTABILITY OR FITNESS FOR A PARTICULAR PURPOSE WITH RESPECT TO THE NYSE ARCA GOLD MINERS INDEX OR ANY DATA INCLUDED THEREIN. IN NO EVENT SHALL ICE DATA HAVE ANY LIABILITY FOR ANY SPECIAL, PUNITIVE, INDIRECT, OR CONSEQUENTIAL DAMAGES (INCLUDING LOST PROFITS), EVEN IF NOTIFIED OF THE POSSIBILITY OF SUCH DAMAGES.