Gold in 2025: A new era of structural strength and enduring appeal
Key Takeaways:
- Central banks are buying gold at record levels, signalling long-term diversification away from the US dollar.
- Gold miners surged 110% YTD but remain undervalued, with strong margins and improved capital discipline.
- Structural trends point to gold potentially reaching US$5,000/oz by 2030 as demand and uncertainty grow.
A brief historical context
Gold has been used in commerce as a currency since the Bronze Age. In 560 B.C., the first minted gold coins were produced in Lydia, a Kingdom of Asia Minor1. Because gold is a currency, its price does not behave like other commodities. It’s also why gold equities do not behave like other mining shares.
While the Lydians were the first to mint coins for trade in 560 BC, it was the Egyptians, 3,000 years earlier, who were the first to smelt gold.
Over time, countries tied their currency to the amount of gold they physically held. This was called the gold standard. Great Britain was the first to do this, and because of its economic might during the reign of Queen Anne, other countries soon followed suit. By the 19thCentury, other than China, all major countries used the gold standard.
During the outbreak of the first World War, Britain abandoned the gold standard when Treasury notes were issued. The immediate impact was inflation and in 1925 Great Britain resumed the gold standard. This didn’t last long. The Great Depression forced countries to abandon the standard again.
In 1944, the Bretton Woods system, similar to the gold standard, was established to assist with trade. Again, its existence was short-lived as growing public debt incurred by the war in Vietnam, increased social welfare and inflation prompted President Nixon to undertake a series of economic measures, including temporarily floating the currency, which became known as the Nixon Shock. Within a few years, many countries, including Japan, had floated their currencies. The Jamaica Accords in 1976 ratified the end of the Bretton Woods system. By the early 1980s, all industrialised nations had floated their currencies.
Today, gold is one of the most traded asset classes in the world. Its recent performance through multiple economic cycles, such as the global financial crisis, pandemic-era stimulus, and post-2020 inflationary pressures, has underscored its ability to preserve value when conventional assets falter.
In 2025, it is one of the best-performing asset classes, and its miners are also enjoying a strong year so far.
The current landscape: Record highs and renewed demand
Chart 1: Gold and gold equities have dominated 2025 performance, outpacing all asset classes
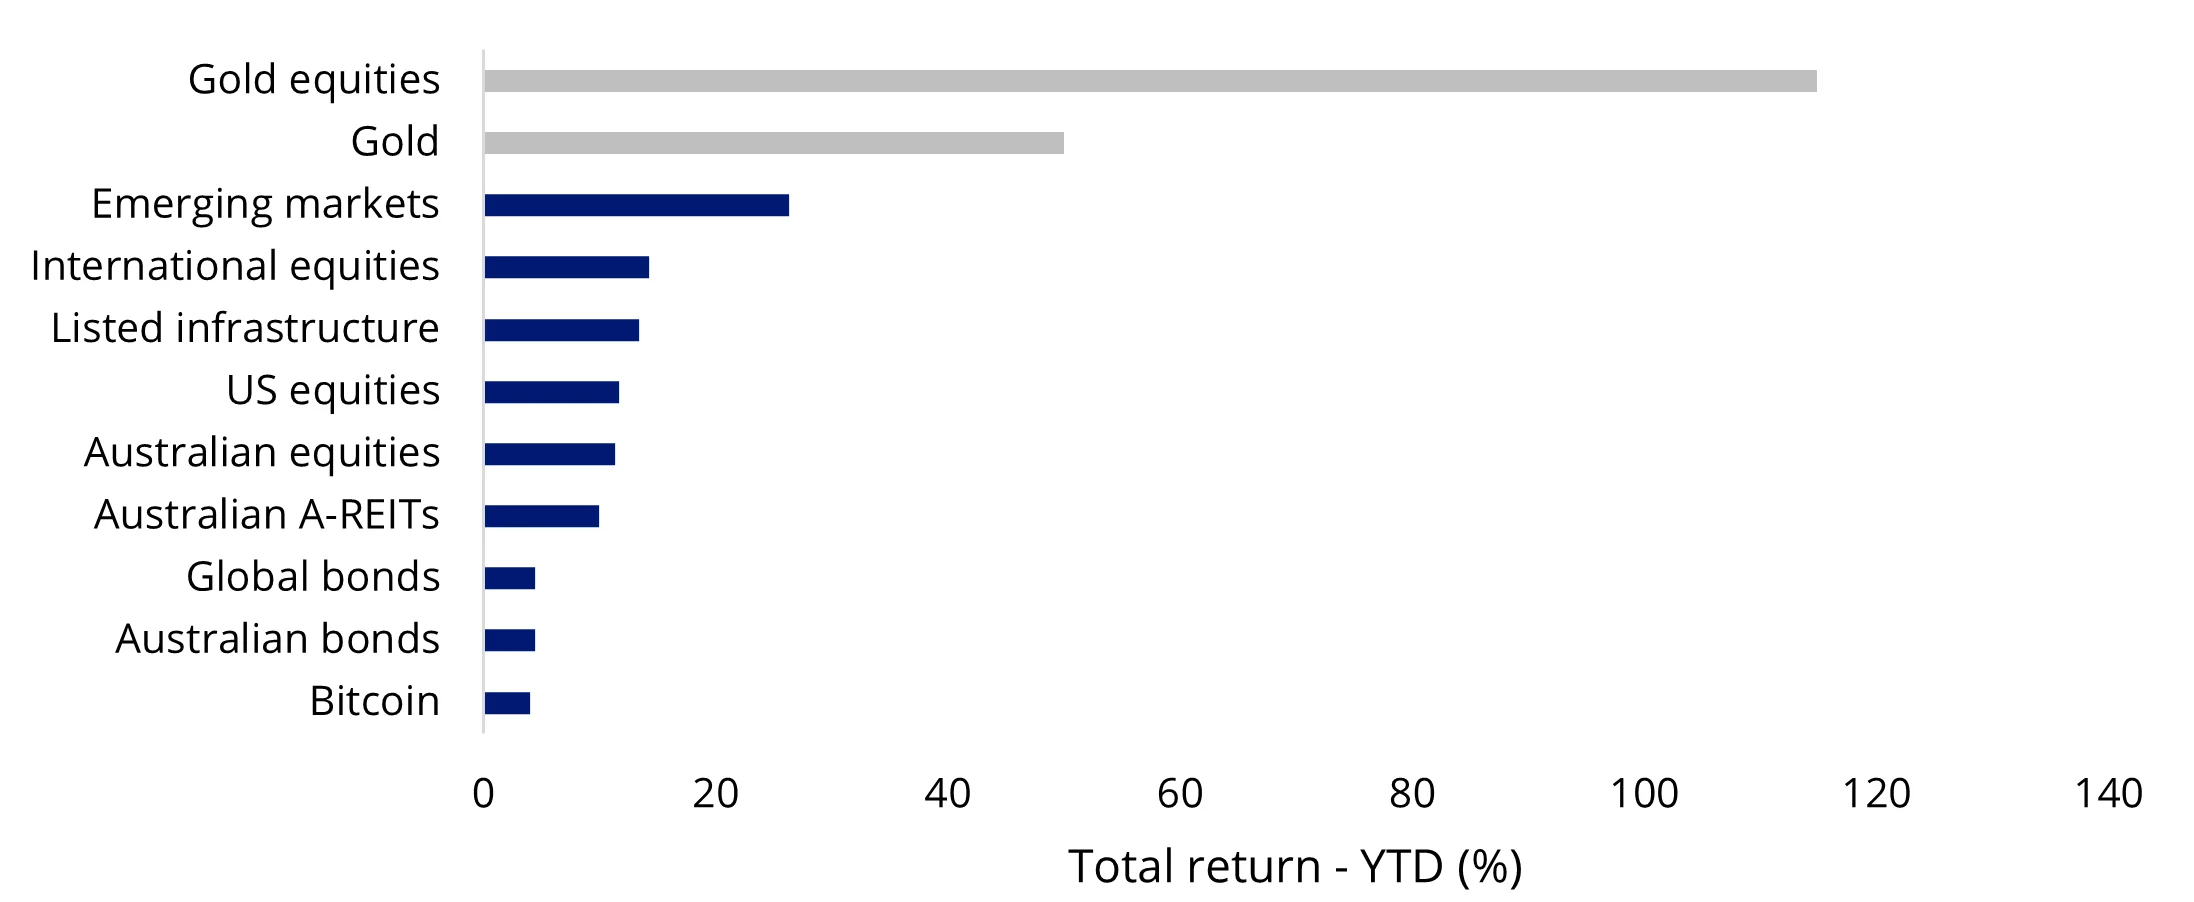
Source: Morningstar. Data as of November 11, 2025. Past performance is not indicative of future results. All returns in Australian dollars. Bitcoin is MarketVector Bitcoin Benchmark Rate, Australian bonds is Bloomberg AusBond Composite 0+Y Index, Global bonds is Bloomberg Global Aggregate Index Hedged to AUD, A-REITs is S&P/ASX 200 A-REIT Index, Australian equities is S&P/ASX 200 Index, US equities is S&P 500 Index, Infrastructure is FTSE Developed Core Infrastructure 50/50 Hedged to AUD Index, International equities is MSCI World ex Australia Index, Emerging markets is MSCI Emerging Markets Index, Gold is LBMA Gold Price PM, Gold miners is NYSE Arca Gold Miners Index. It is not possible to invest directly in an index.
Gold hit a record of over US$4,000 per ounce in late 2025, having gained over 50% year-to-date, making it a top-performing major asset class worldwide.
This rally, while remarkable, is not without historical precedent; similar surges occurred in the 1970s and 1980s during periods of currency debasement and heightened geopolitical stress.
What’s driving the gold price in 2025
Several key themes define the recent rise in gold’s price:
1. Central Bank Buying and De-dollarisation
Chart 2: Central banks have become consistent net buyers of gold, marking one of the strongest buying streaks in modern history
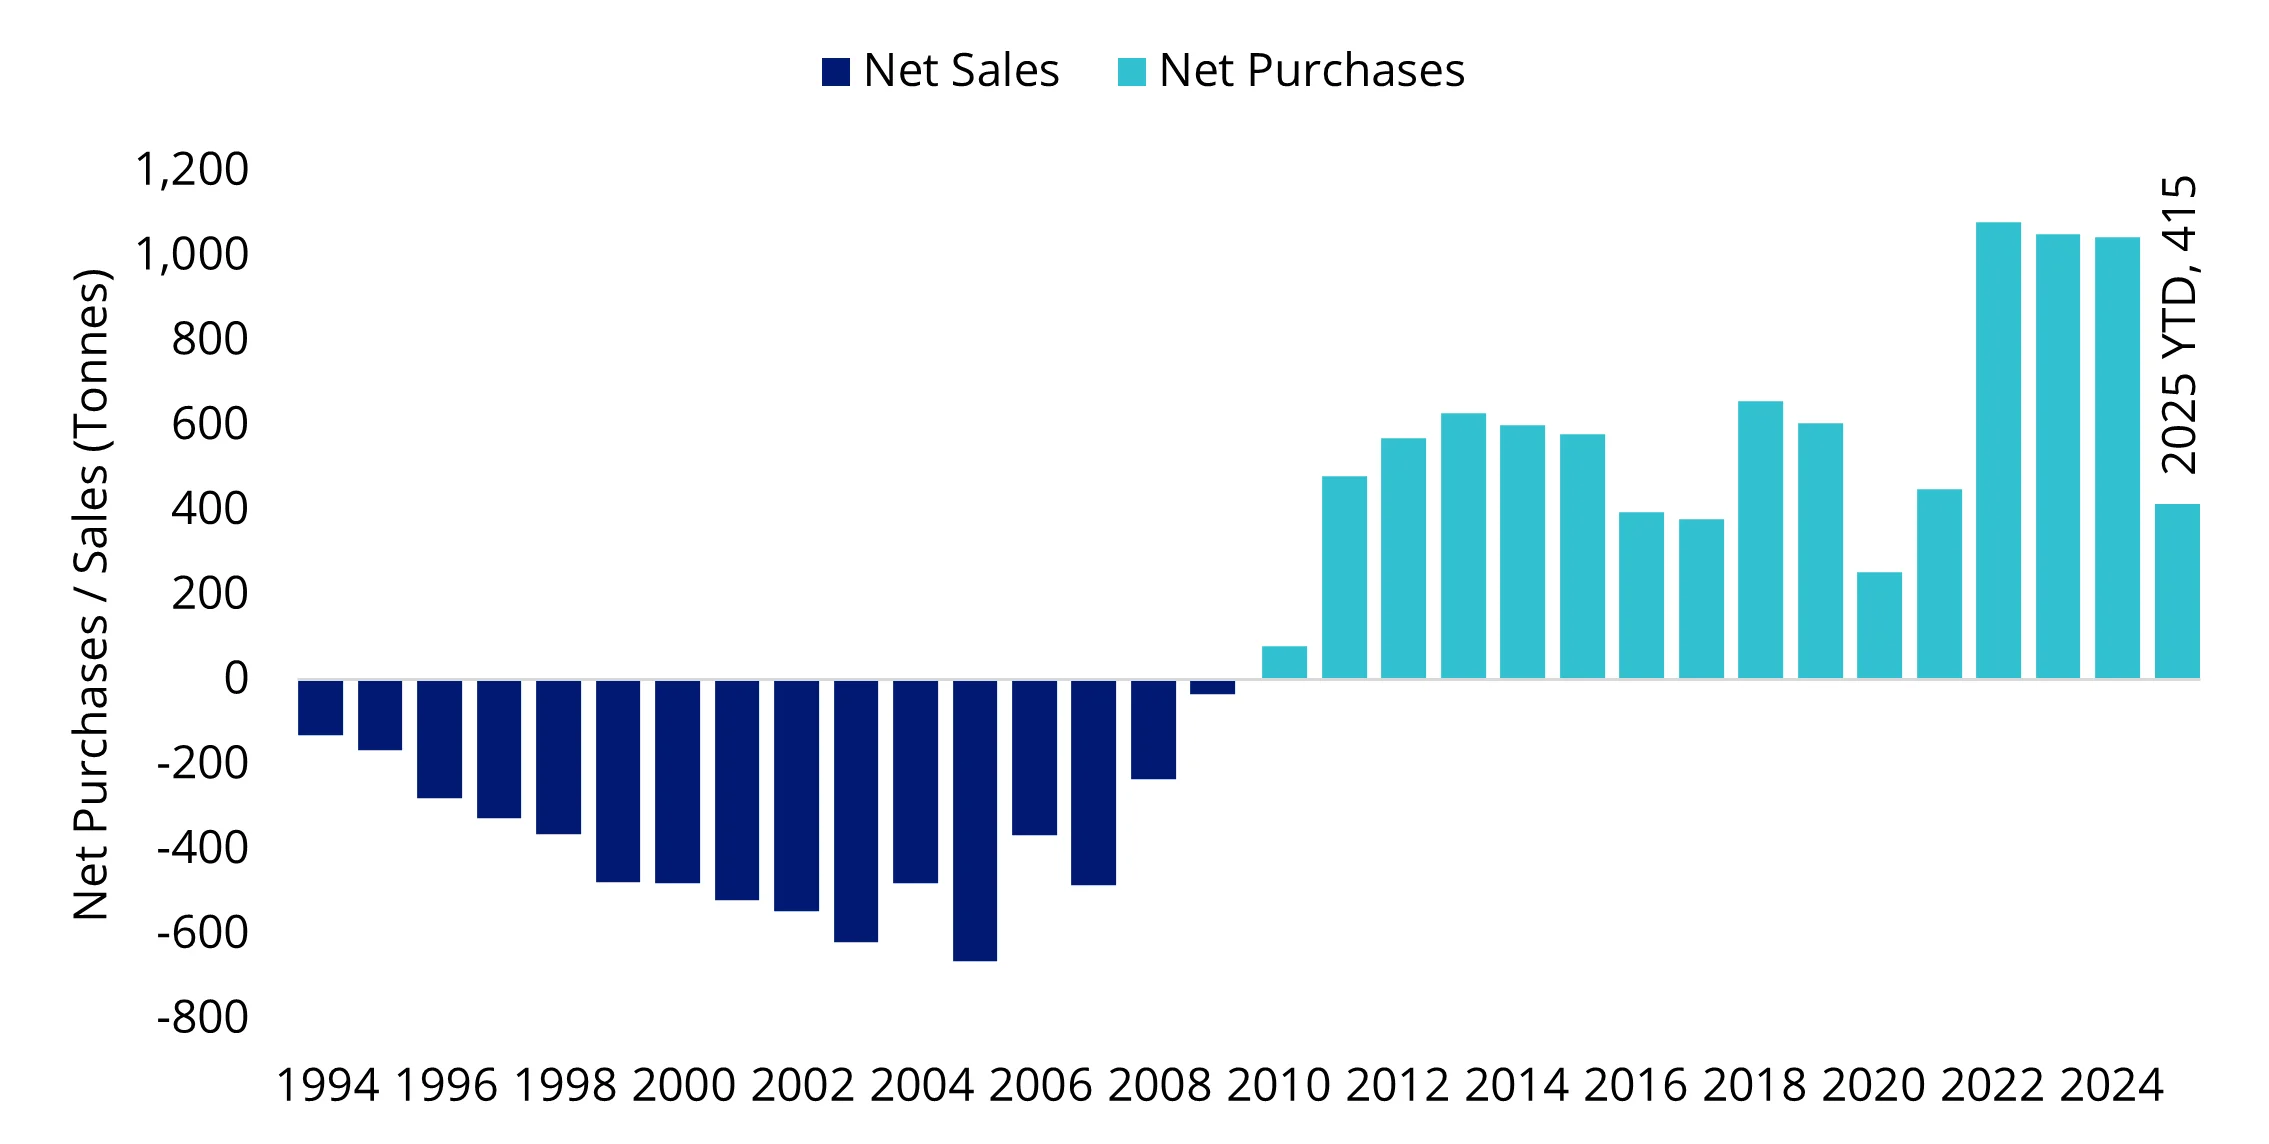
Source: World Gold Council. Data as of June 2025. For illustrative purposes only.
Since 2022, central banks have purchased over 1,000 tonnes of gold annually, roughly twice the decade-long average. Leading this trend have been emerging economies, notably China, Turkey, Poland, and India. This signals a long-term diversification away from the US dollar. This central bank behaviour underscores a global realignment in currency reserves: as the dollar’s share of official reserves declines, gold’s share continues to rise as a neutral, non-sovereign store of value.
Chart 3: Gold’s rise parallels a gradual de-dollarisation trend as central banks diversify reserves
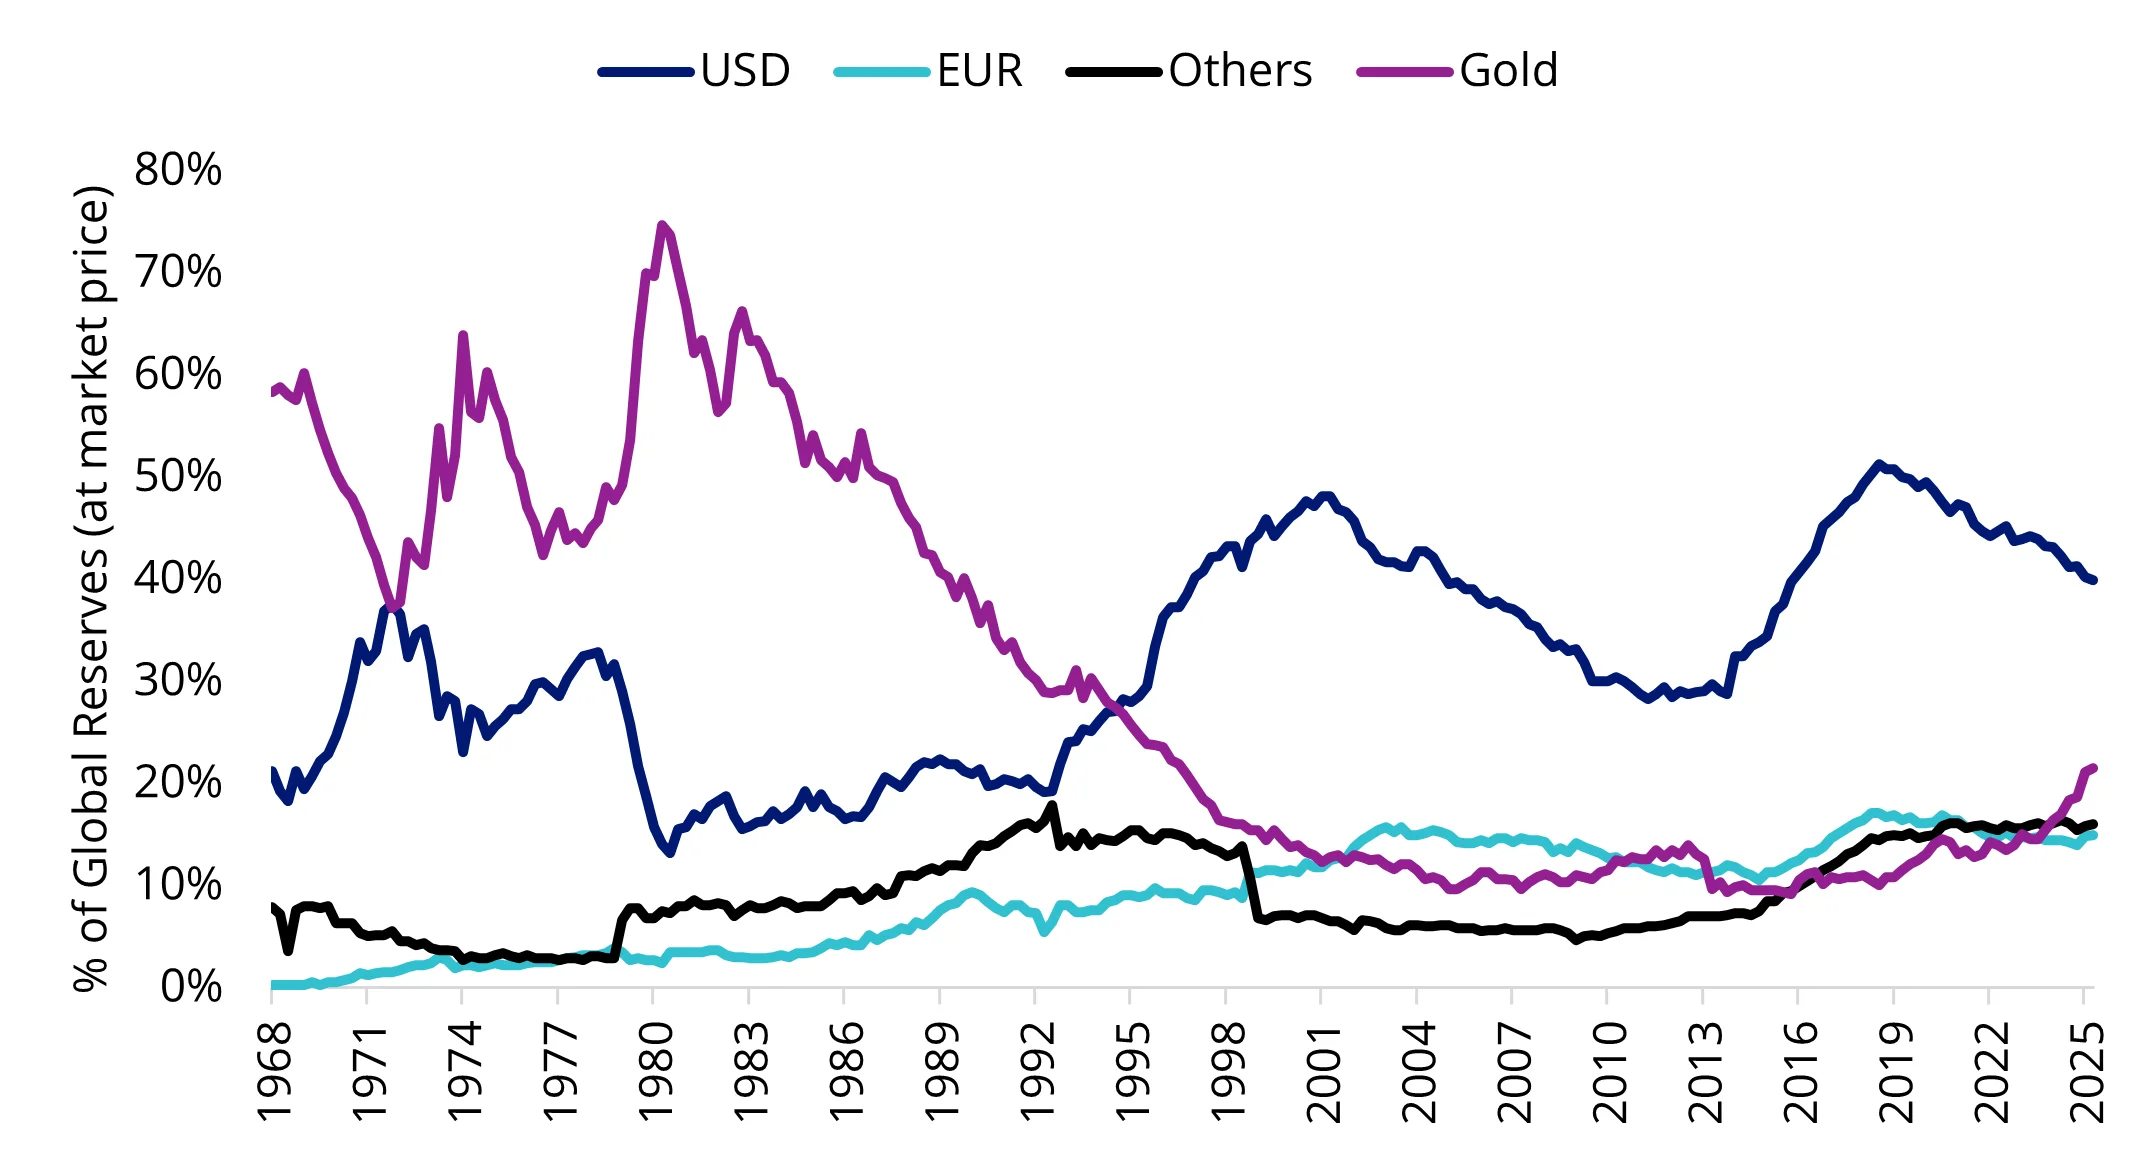
Source: Deutsche Bank. Data as of 30 June, 2025. For illustrative purposes only. Past performance is no guarantee of future results.
2. The return of Western investors
After several years of ETF outflows, Western investment demand for gold has returned in 2025, with inflows into gold ETFs. Gold ETF holdings remain well below previous peaks, suggesting that the asset class may still have room to normalise relative to historical levels.
Chart 4: After years of outflows, gold ETF holdings are rising again, signalling renewed Western demand
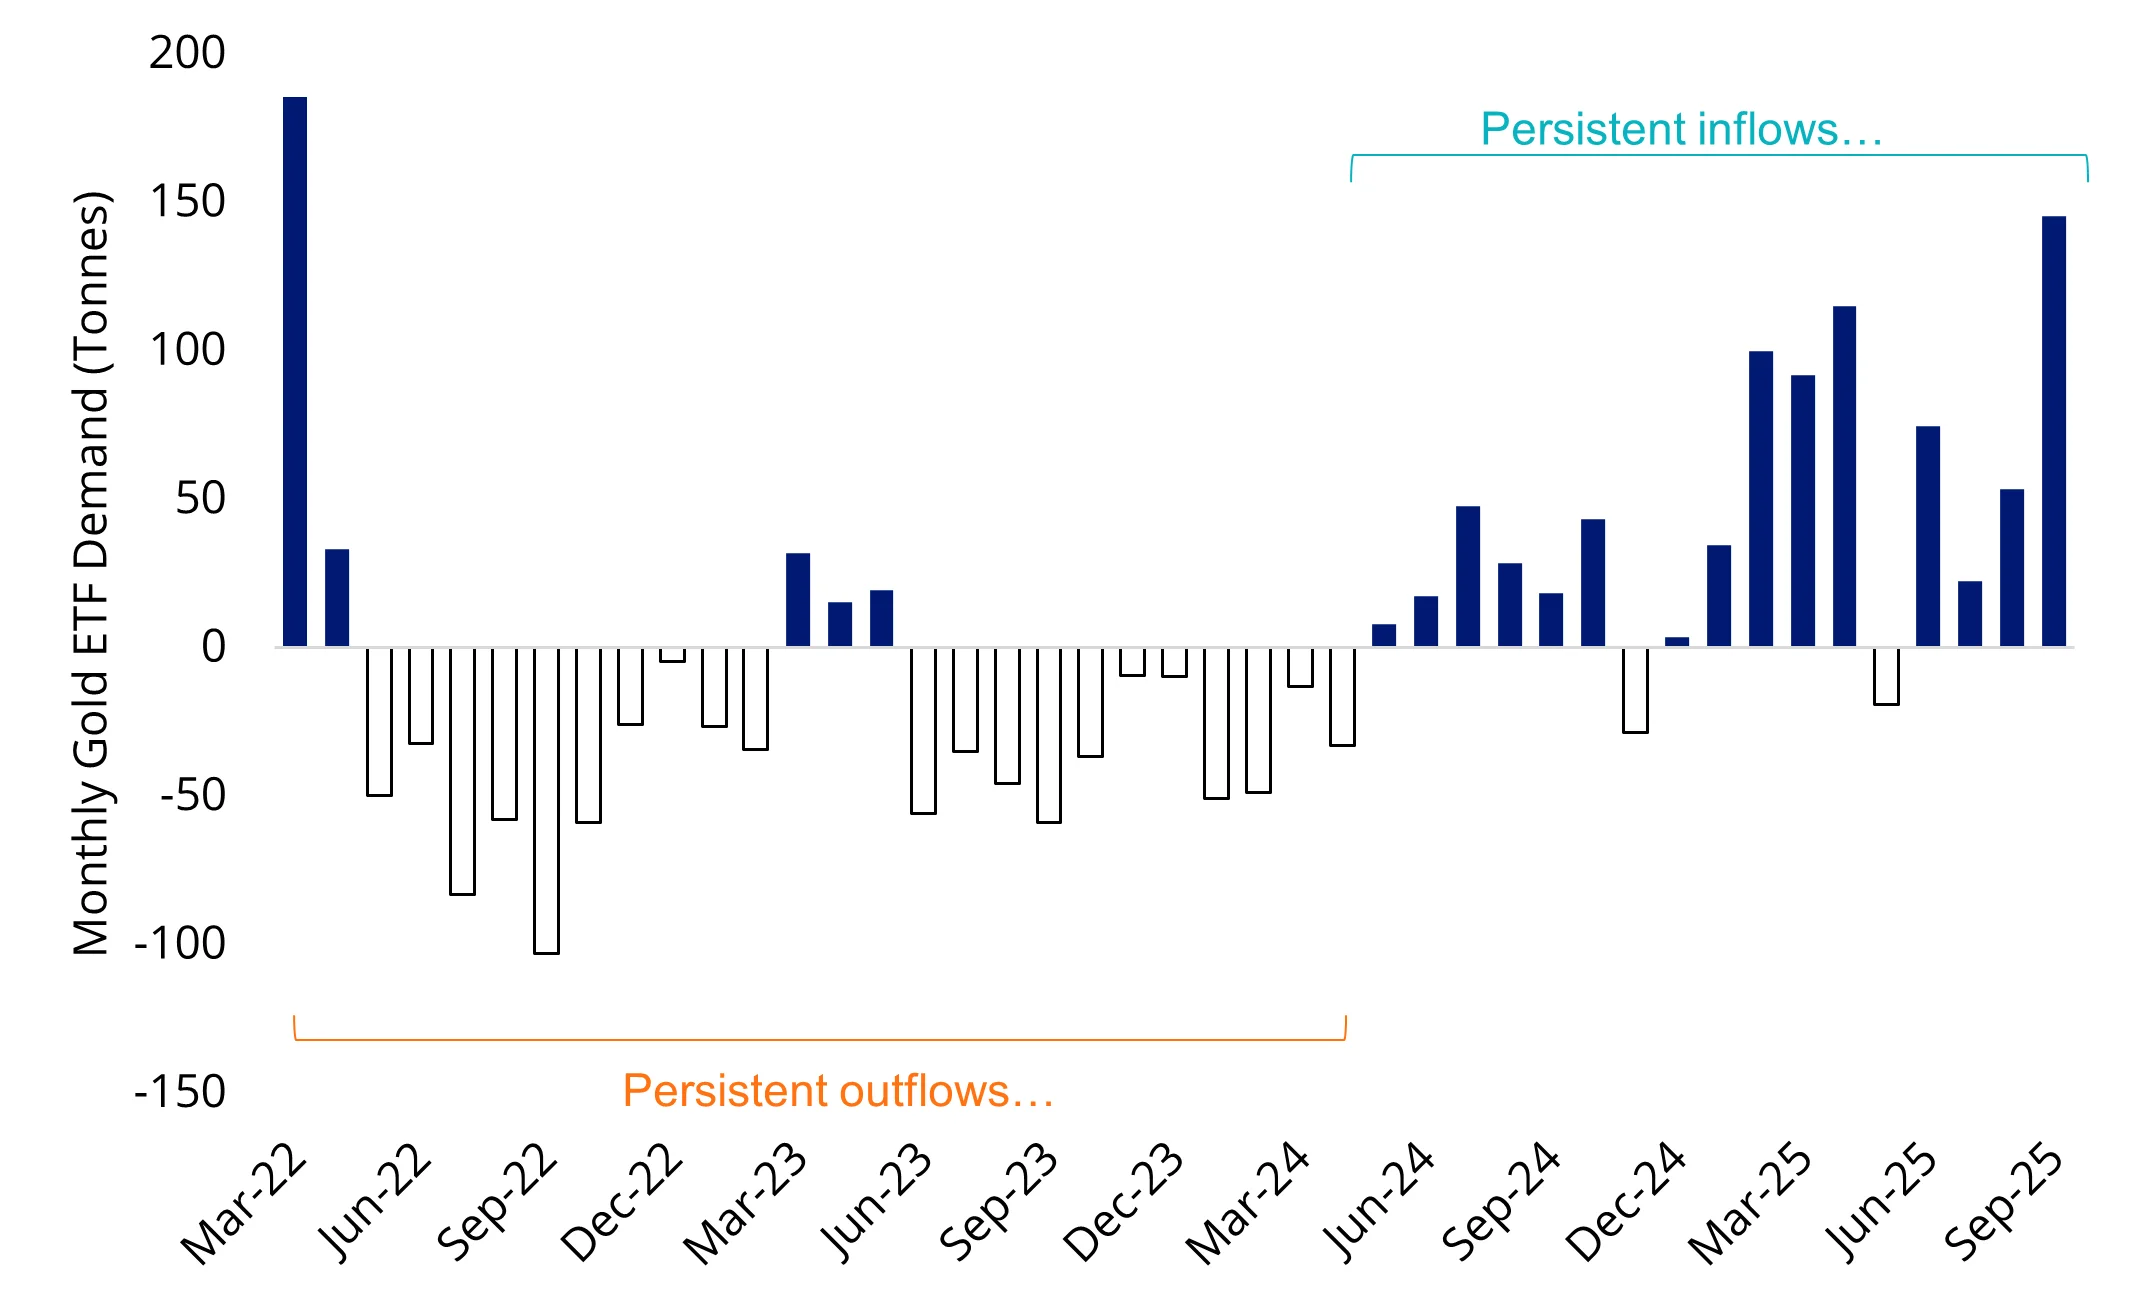
Source: World Gold Council. Data as of September 2025. For illustrative purposes only.
3. Geopolitical and Macroeconomic Catalysts
In our last Vector Insights, we suggested that fear could be driving up gold’s price. ”The increased government debt and its spending, combined with geopolitics, going back to reason three (Gold shines during inflationary periods), create an ideal environment for a sustained period of above-target inflation. This all plays into why investors are flocking to gold now,” we said.
Gold Equities and Miners: Undervalued Leverage
Gold miners, as represented by the NYSE Arca Gold Miners Index have staged a spectacular rebound in 2025, rising over 110% year-to-date (to 11 November 2025), and yet remain fundamentally undervalued relative to the metal itself.
Chart 5: Gold’s strength keeps nearly all producers profitable
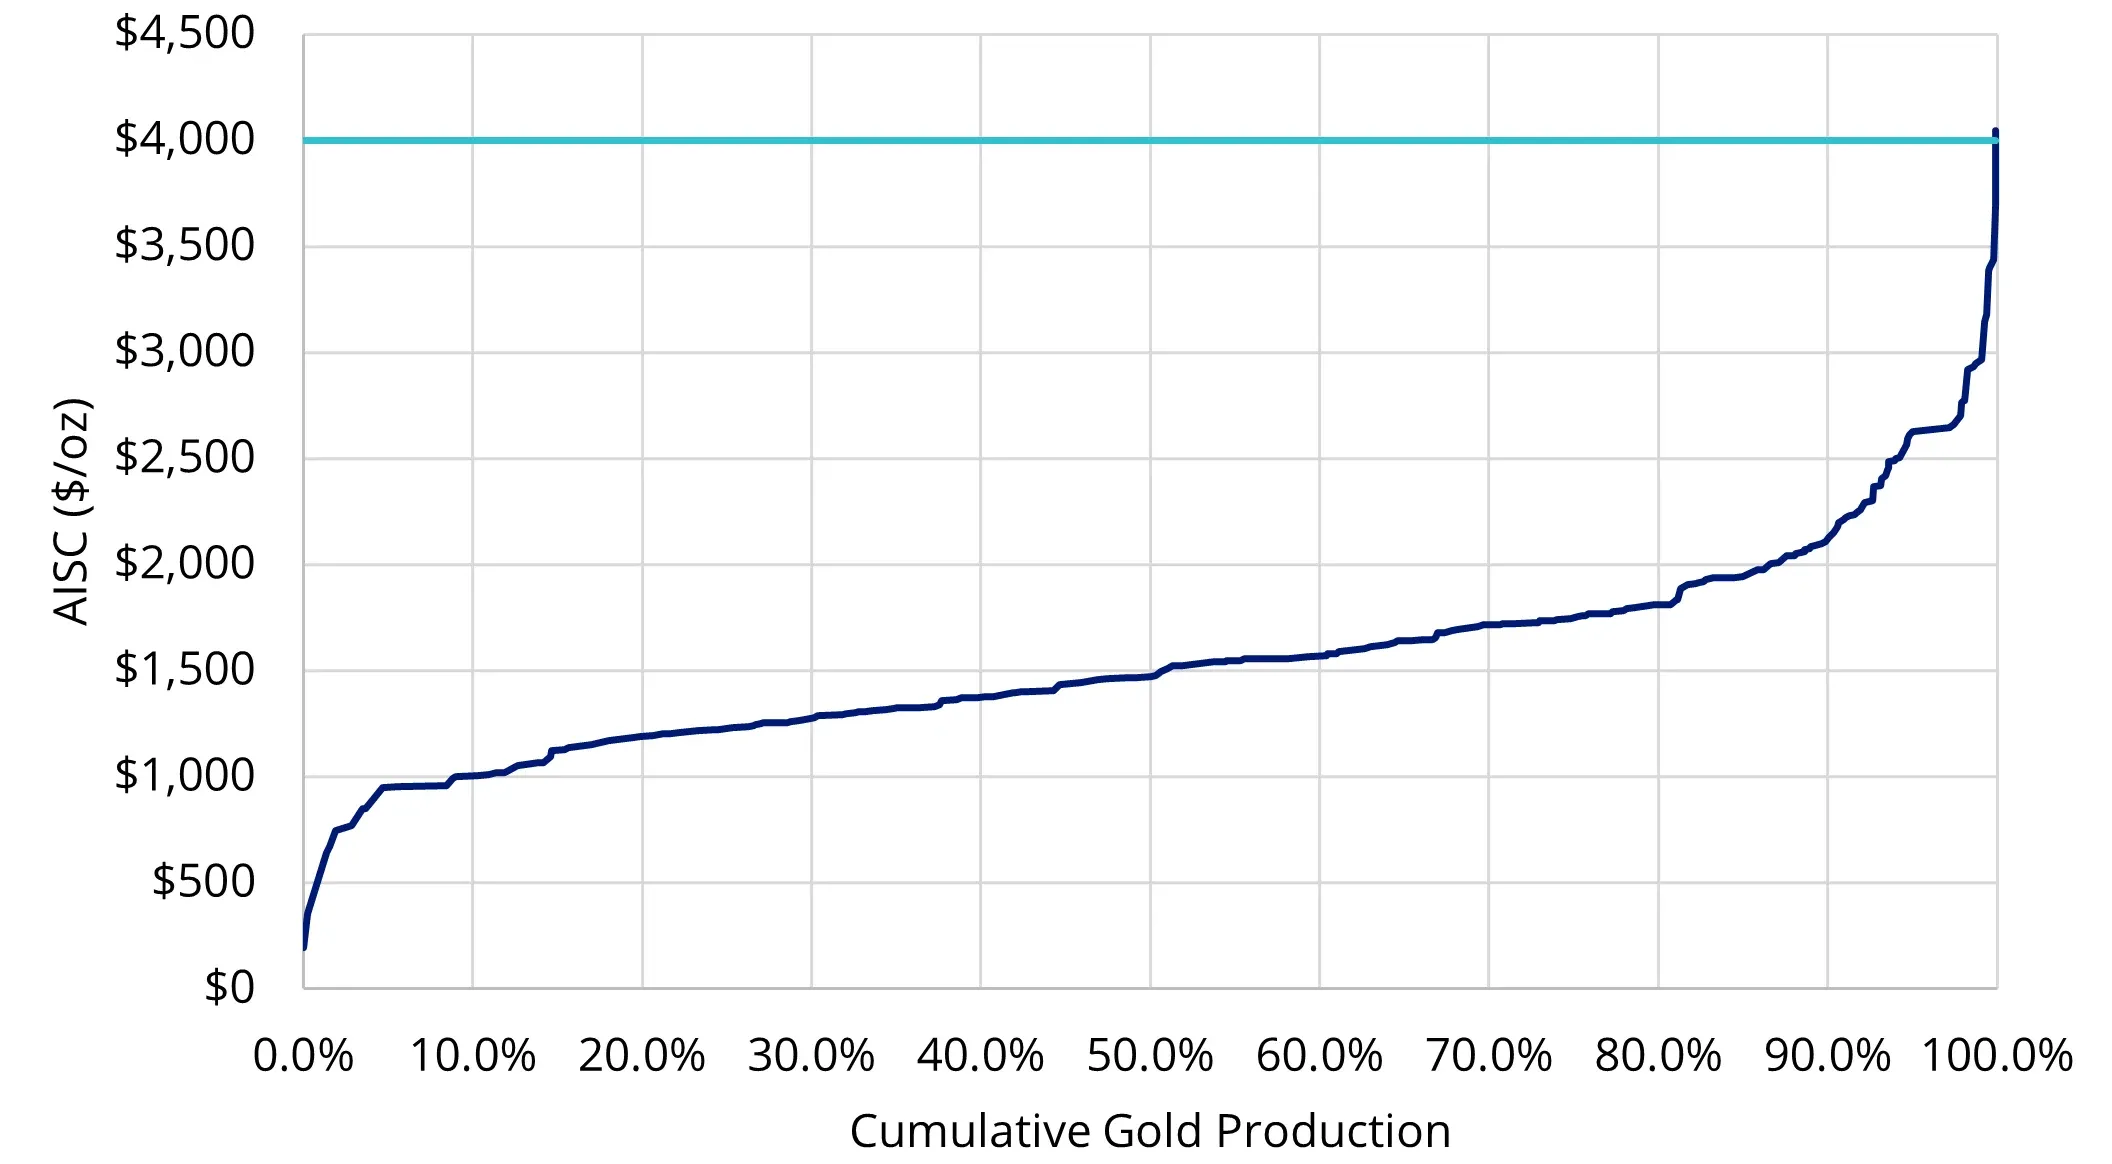
Source: World Gold Council. Data as of June 30, 2025. For illustrative purposes only.
With all-in sustaining costs averaging around US$1,600/oz and current prices near US$4,000/oz, the result has been record margins across the industry. Miners are displaying improved capital discipline and stronger balance sheets, a key differentiator from previous cycles when high prices often led to overspending.
Short-term Forecast: 2026 Gold Predictions
Gold has the potential to trade even higher in 2026. Gold tends to outperform during later phases of inflationary cycles, when investors seek protection from social, geopolitical, and financial instability.
Gold is well-positioned to continue its rally, especially as more Western investors continue their return to the market. The ongoing uncertainty surrounding tariffs, along with continued inflationary pressures and geopolitical risks, is likely to further bolster gold's appeal as a hedge against global market volatility. With this backdrop, gold prices could break through their inflation-adjusted highs and climb to new trading ranges above US$4,000 per ounce in the near term.
Side note: For miners, it’s about more than the gold price
A rising gold price environment has historically been accompanied by strong performance by gold equities. The sector outperformers must also demonstrate that they are fundamentally positioned and have a sound strategy that will translate higher gold prices into improved cash flow and higher returns, which will deliver growth. Organic growth does not come easy in the gold sector. Finding new gold deposits, or defining/expanding existing ones, is a difficult, lengthy, and capital-intensive process. To significantly expand their depleting reserve and resource base, companies generally must acquire other companies or assets. All things equal, the more advanced a project is, the higher its valuation and the faster the company can deliver growth.
Gold stocks’ leverage to the gold price, combined with their attractive valuations relative to the broader equity markets, and their low correlation with most other asset classes, should lead to a re-rating of the sector as investors look to rotate capital and diversify their portfolios.
5-year forecast: Gold price forecast for 2026-2030
Gold’s long-term case stays strong as central bank demand, fiscal strain, and inflation risk continue to support the metal.
As these trends continue to play out and reshape the global economic order in the coming years, gold has the potential to climb toward US$5,000 per ounce.
Long-term gold forecast: 2030 & beyond
Longer term, investors should expect gold to continue to act as a hedge against broader market volatility and uncertainty. The investment case for gold may grow stronger due to the potential decline of the US dollar’s reserve status and emerging market central banks’ gold holdings continuing to rise.
Gold’s renaissance
Gold’s 2025 performance is not a speculative anomaly; it reflects shifting global fundamentals. In an era defined by currency realignment, fiscal excess, and geopolitical volatility, gold has reasserted its historic role as the ultimate store of value and a cornerstone of prudent portfolio construction.
For investors still asking, “Did I miss it?” The answer remains: The gold story is far from over.
Source:
1 – Katz, J and Holmes, F (2008). The Goldwatcher: Demystifying Gold Investing Wiley, New York


Published: 14 November 2025
Any views expressed are opinions of the author at the time of writing and is not a recommendation to act.
VanEck Investments Limited (ACN 146 596 116 AFSL 416755) (VanEck) is the issuer and responsible entity of all VanEck exchange traded funds (Funds) trading on the ASX. This information is general in nature and not personal advice, it does not take into account any person’s financial objectives, situation or needs. The product disclosure statement (PDS) and the target market determination (TMD) for all Funds are available at vaneck.com.au. You should consider whether or not an investment in any Fund is appropriate for you. Investments in a Fund involve risks associated with financial markets. These risks vary depending on a Fund’s investment objective. Refer to the applicable PDS and TMD for more details on risks. Investment returns and capital are not guaranteed.