Gold’s rally holds strong above US$4,000
Key Takeaways:
- Gold is holding firm: Despite sharp swings, prices remain strong above US$4,000.
- Demand is driving gains: Tight supply and steady buying continue to support the market.
- Miners gaining ground: Solid profits and low valuations set up potential upside.
A relentless rally and a reality check
Gold surpassed the US$4,000 per ounce mark in October, continuing a relentless rally to reach a record close of US$4,356.30 per ounce on October 20. The large move, of almost US$400 per ounce (+10%) in just seven trading sessions, signalled to us that markets were becoming overbought. It appears a wave of investors, fearful of missing out on the year’s best-performing trade, rushed in and triggered an aggressive price reaction.
The gold price then pulled back, erasing those gains and clearing out the more speculative positions. Despite heightened volatility and the predictable “gold comes crashing down” commentaries that followed, gold still posted another strong month, closing at US$4,002.92 per ounce on October 31, which was a US$143.65 per ounce (+3.73%) gain for the month.
Tight market, elastic demand
October’s price action is a powerful reminder of the tightness of the gold market. When it comes to gold and gold stocks, it does not take much to move the needle. Gold supply remains inelastic, and it is the demand side of the equation that drives the story.
Solid and consistent support from the official sector, combined with pent-up jewellery demand serving as a floor as prices pull back, suggests to us that fresh investment demand could propel gold prices even higher. Investment demand for gold bullion tends to translate into demand for gold equities as participants want to increase their exposure and leverage to the gold price.
And in a space with a total market capitalisation of only around US$1 trillion, even after this year’s surge, it does not take much capital to move stock prices up significantly. While the prevailing perception among many investors is that gold and gold stocks must be “crowded trades”, due to the phenomenal performance so far this year, the reality is the opposite. The gold asset class remains significantly underowned.
Rallying beyond US$4,000
In our view, US$4,000 gold does not mark the end of this bull market. Historical correlations between gold bullion ETF flows and price performance suggest that renewed investment demand, such as levels seen in 2020, could provide further support for prices.
Chart 1: Ample headroom - Gold allocations remain far from past peaks
Central banks and private investors have increased their gold allocations in recent years, signalling a renewed appreciation for gold’s strategic role. Despite this resurgence, gold’s share of global assets and reserves remains well below historical peaks reached in the 1970s and early 1980s.
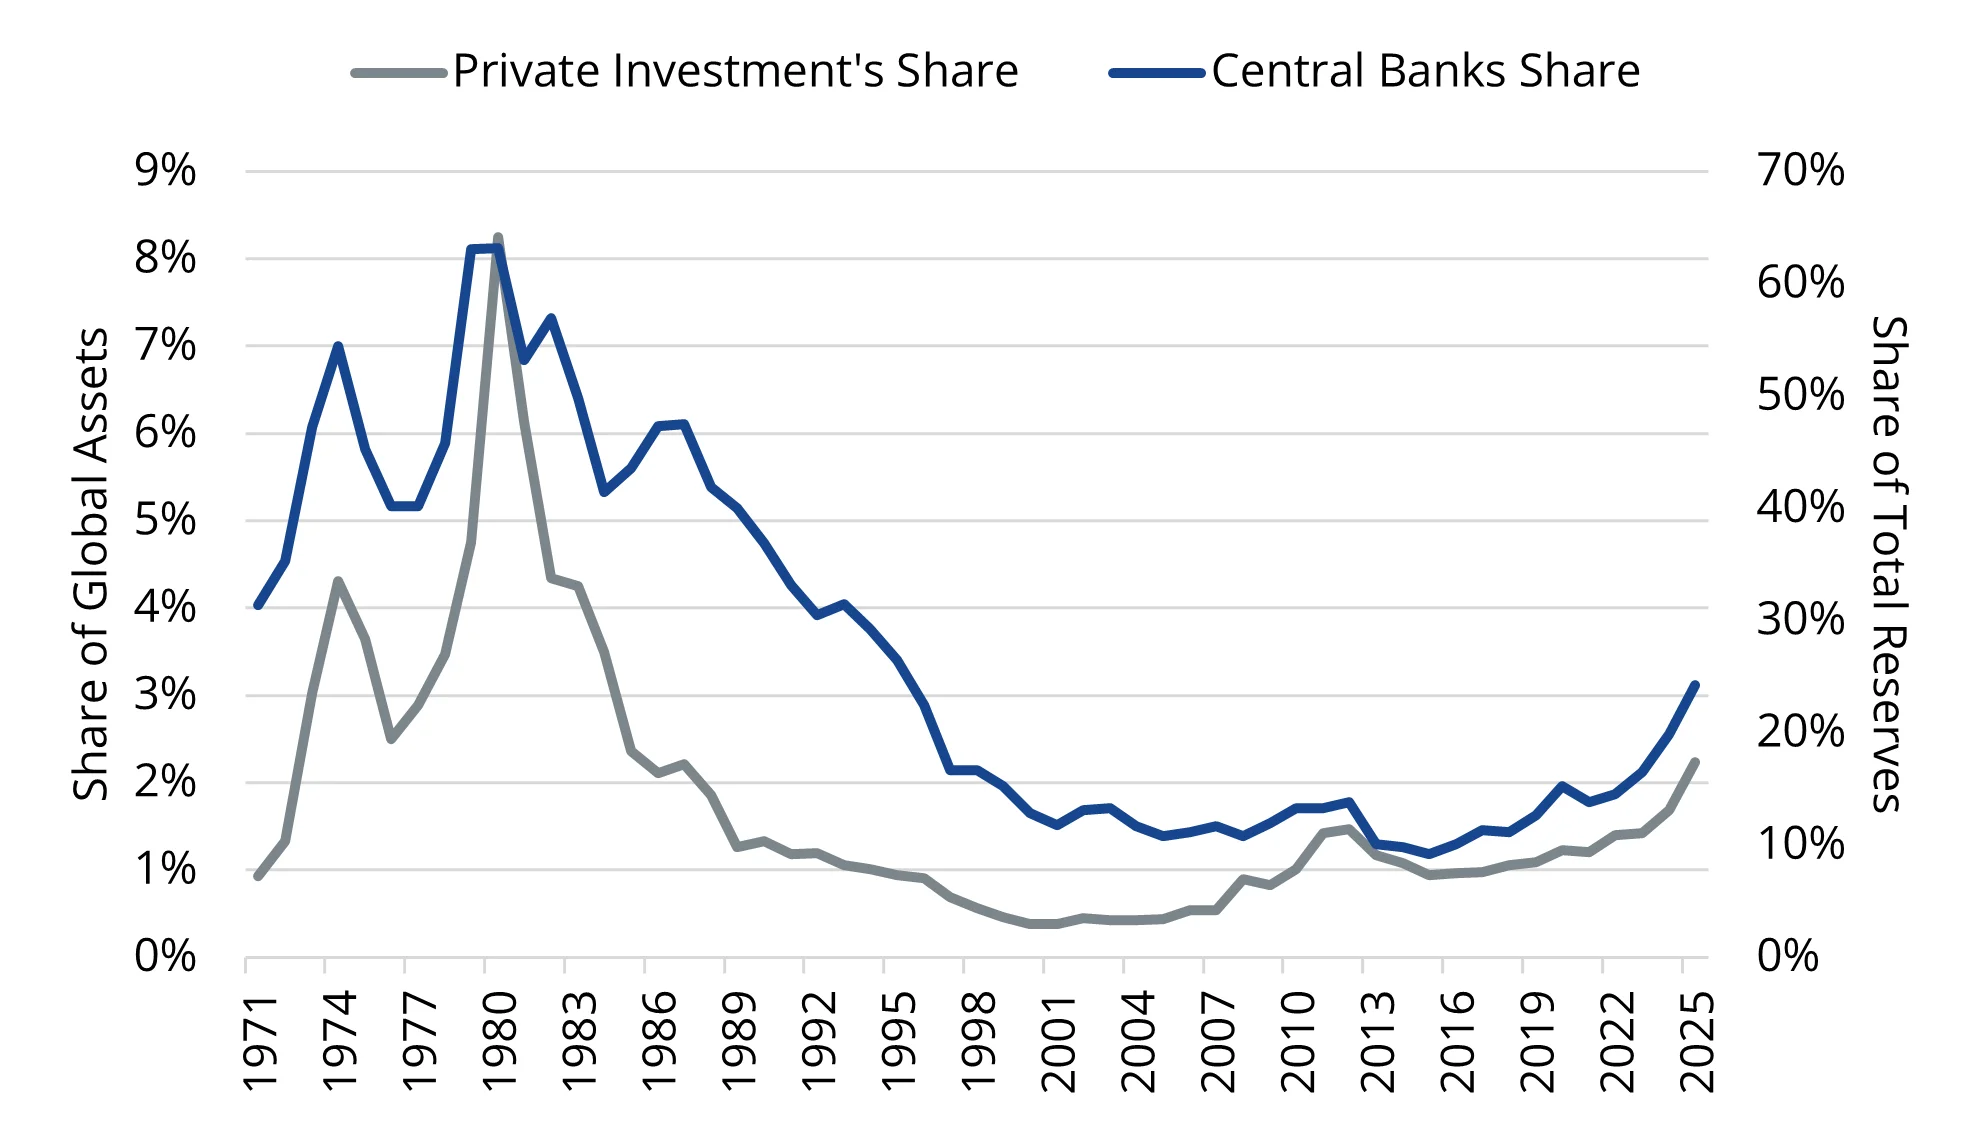
Source: World Gold Council. Data as of June 2025. Past performance is not indicative of future results.
We also see potential for a modest rotation of capital from richly valued broader equities, particularly the tech/AI segment, as investors seek diversification amid rising risks of a market correction. Such a shift could favour gold stocks.
Gold miners: Value hiding in plain sight
Chart 2: Attractive relative valuations Support re-rating potential
Gold miners trade at roughly one-third the valuation of the S&P 500 and a fraction of the “Mag 7” on both EV/EBITDA and Price-to-Cash-Flow metrics. While gold miner valuations have risen to the top of their 5-year range, they still sit well below broader market levels, underscoring the sector’s relative attractiveness.
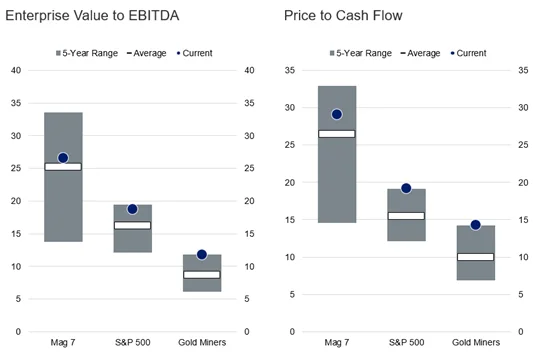
Source: FactSet. Data as of September 2025. “Mag 7” represented by the harmonic average values of Alphabet, Amazon, Apple, Meta, Microsoft, Nvidia, Tesla. “Gold Miners” represented by NYSE Arca Gold Miners Index. Not a recommendation to buy or sell any security mentioned herein. Past performance is not indicative of future results.
Our positive view on gold stocks is supported by our outlook for higher gold prices, but also by strong fundamentals. Gold miners enjoy record margins, with profitability that remains attractive and sustainable, even at much lower gold prices (Chart 3).
Yet, despite these favourable dynamics, valuations remain at historically low levels. October’s volatility caused miners to lag gold’s performance, with the NYSE Arca Gold Miners Index (GDMNTR) down 4.23% for the month.
Chart 3: Gold’s strength keeps the majority of the producers profitable
The industry cost curve shows that the majority of global gold production remains profitable at current prices near US$4,000/oz. Even higher-cost producers sit well below current gold prices, indicating a robust profitability buffer across the sector.
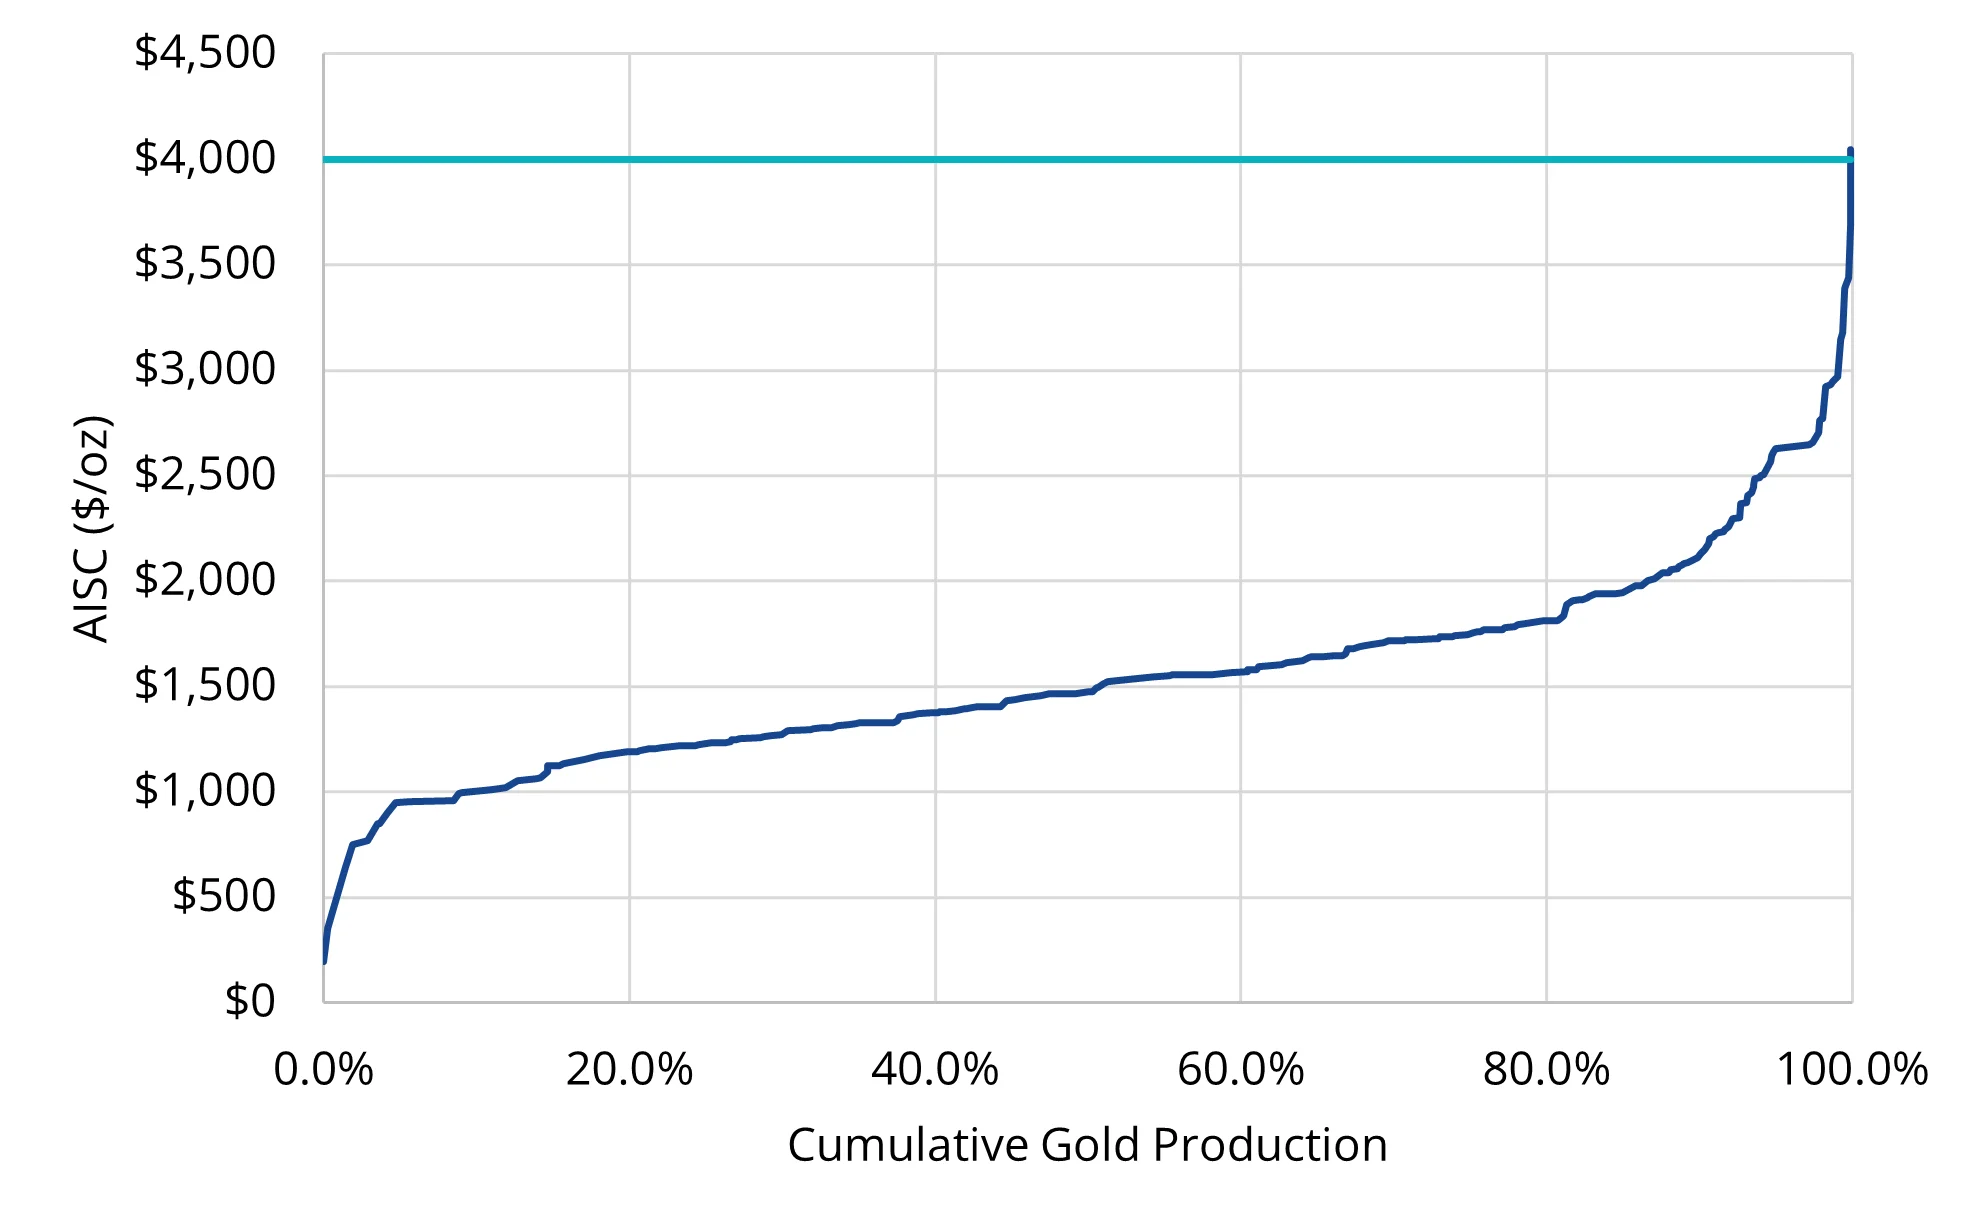
Source: World Gold Council. Data as of June 30, 2025.
Earning their place in portfolios
We expect the attractive valuations of the gold miners, along with consistent delivery against their targets, to become difficult for investors to ignore. Gold companies have started to report their Q3 2025 results at the end of October, reaffirming our view that costs in the industry are being contained, companies are exercising excellent capital discipline, and as a group, they are meeting or beating their operational targets.
We may be at the cusp of a historical transition where the gold mining sector finally earns a sleeve, a place, an allocation, or, at the very least, a consideration within global multi-asset portfolios.


Published: 20 November 2025
Any views expressed are opinions of the author at the time of writing and is not a recommendation to act.
VanEck Investments Limited (ACN 146 596 116 AFSL 416755) (VanEck) is the issuer and responsible entity of all VanEck exchange traded funds (Funds) trading on the ASX. This information is general in nature and not personal advice, it does not take into account any person’s financial objectives, situation or needs. You should consider whether or not an investment in any Fund is appropriate for you. Investments in a Fund involve risks associated with financial markets. These risks vary depending on a Fund’s investment objective. Refer to the applicable product disclosure statement (PDS) and target market determination (TMD) available at vaneck.com.au for more details. Investment returns and capital are not guaranteed.