A place to hide from rising rates
Asset allocators, after being rocked by the historic sell-off in bonds earlier this year, are looking at relatively attractive yields. But developed market (DM) bonds are only part of the bond story.
There are some strong tailwinds for emerging market bonds, like the GFC and subsequent debt crises when emerging market debt, as an asset class, shined.- EMs have lower leverage and higher real interest rates relative to DM;
- DM authorities are being forced into more fiscal and monetary experimentation and supply - creating greater risks.
To take full advantage of the opportunities within EM debt, it is necessary to take an unconstrained active approach, to avoid having the highest weighting to indebted, poorly run nations.
The VanEck Emerging Income Opportunities Active ETF (Managed Fund) (EBND) takes an active, high conviction and benchmark agnostic approach to investing across the EM bond spectrum (the benchmark is 50% J.P. Morgan Emerging Market Bond Index Global Diversified Hedged AUD and 50% J.P. Morgan Government Bond-Emerging Market Index Global Diversified).
EBND has a targeted dividend yield of 5% p.a.* and pays income monthly.
The yield to maturity as at 31 August 2022 is 11.31%.
EM central banks led and are keeping it ‘real’
EM central banks raised rates early and significantly, relative to the DM’s late hiking cycle.
Exhibit 1 – Policy rates in EM and DM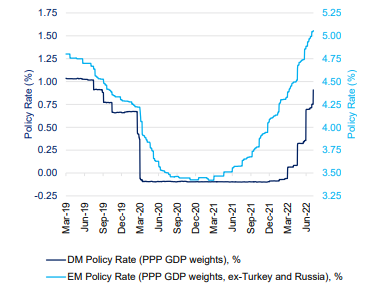
Source: VanEck, Bloomberg 31 August 2022.
Investors have always demanded a higher premium from EM issuers, but when you consider the real policy rates (rates minus inflation), the difference is stark and investors are being rewarded in EM bonds.
Exhibit 2 – Real policy rates in EM and DM (%)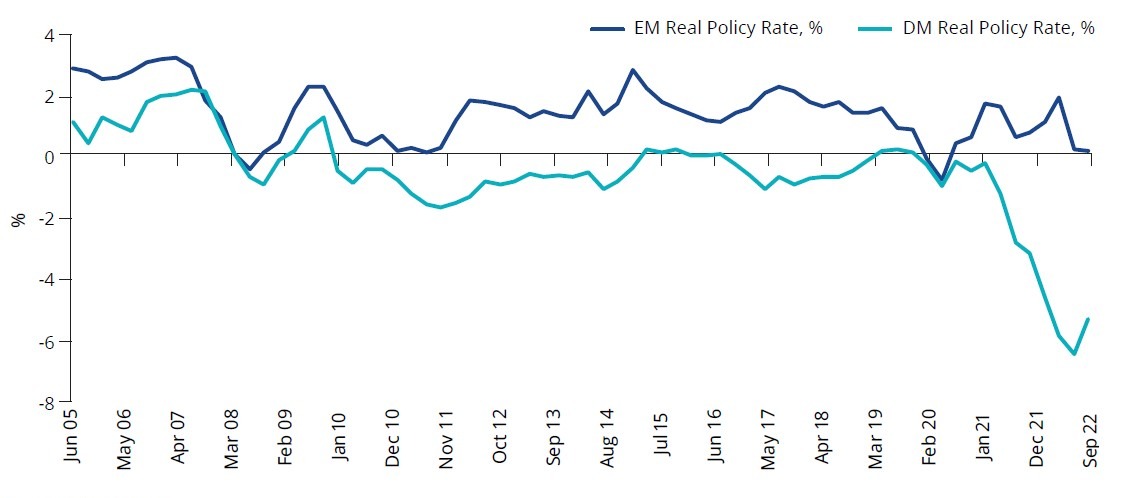
Source: VanEck, Bloomberg 31 August 2022.
EM policymakers are awash in dollars and hiking rates way earlier and larger than the Fed and other DM central banks, as they’ve done for all of the crises of the past two decades. You can see in Exhibit 3, surpluses as far as the eye can see, despite the many global crises we’ve faced.
Exhibit 3 – EM current account balance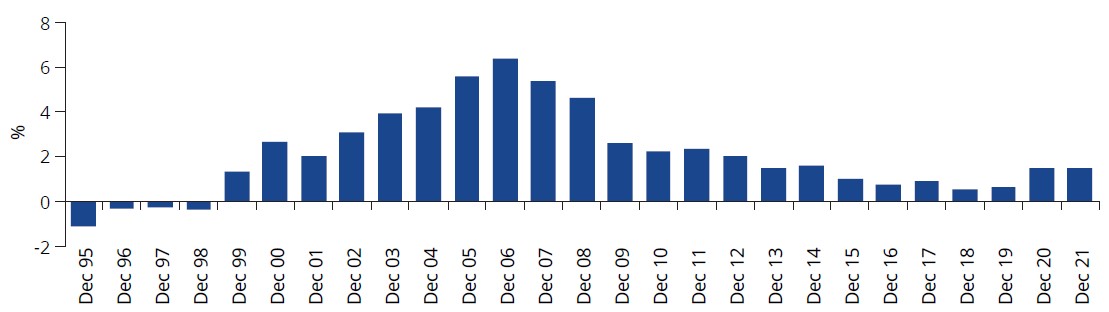
Source: VanEck, Bloomberg.
EM could be the place to hide from rising rates
While the yields on DM bonds hit medium-term highs, investors considering bonds for yield are still concerned about duration, that is the threat that rates continue to rise, eroding capital. The chart below shows if you are worried about duration, US treasuries and investment grade have much worse upside/downside characteristics than do EM sovereigns. The spreads in EM are sufficient to better absorb rising rate scenarios.
Exhibit 4 – Returns on fixed income from -100 basis points to +100 basis points shift in yield curve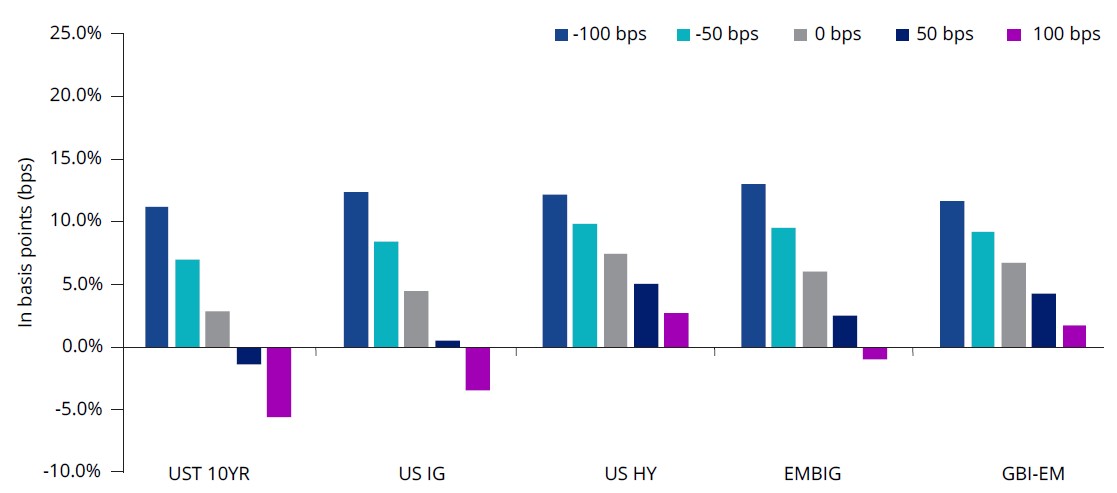
Source: VanEck, Bloomberg, as at 31 August 2022. UST10YR is Bloomberg US Government 10 Year Term Index, US IG is ICE BofA US Corporate Index, US HY is ICE BofA US High Yield Index, GBI-EM is EM local - J.P. Morgan Government Bond Index-Emerging Markets Global Diversified (GBI-EM); EMBIG is EM hard currency - J.P Morgan Emerging Markets Bond Index Global Diversified (EMBIGD) – EMBIGD is unhedged, EBND hedges its hard currency.
You could be missing out because most global bond portfolios don't have an allocation
One asset class that has in the past been overlooked by Australian investors which can enhance their yield is EM bonds. There are a number of reasons Australian investors may not have an allocation to EM bonds based on old world beliefs, but we are entering a new world. Global comparisons show that many EM economies are now as liquid and structurally sound as DM, or better. EM (the dark blue lines in the chart below) generally have stronger balance sheets than DM (the aqua lines on the chart). On many metrics the G10 economies are worse than the largest 26 EM.
Exhibit 5 – EM v DM balance sheets
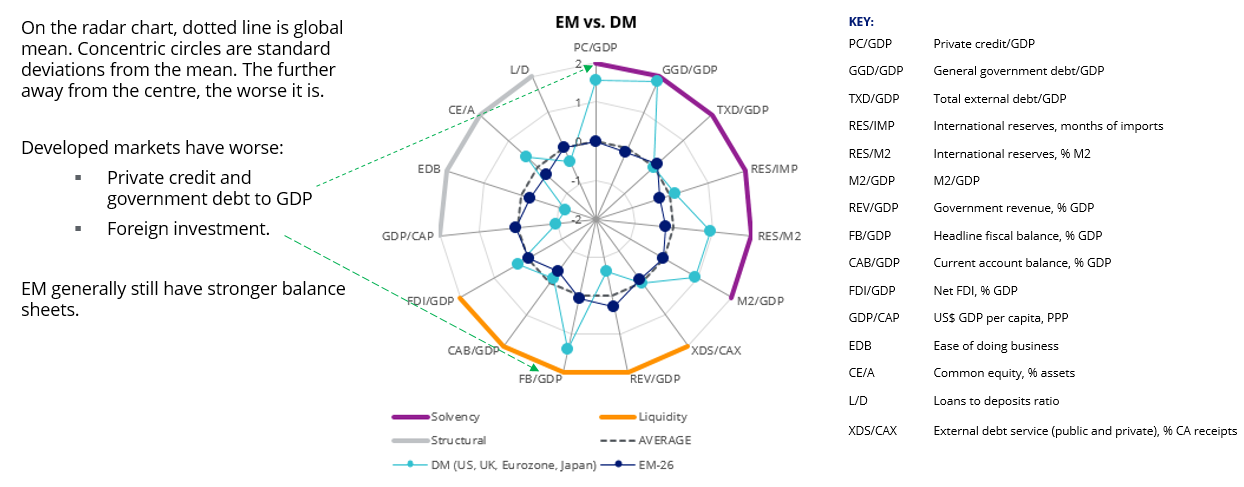
Source: Credit Suisse, JP Morgan, Bloomberg, BIS, Central Bank Website.
Despite their stronger fundamentals, EM governments and corporations generally pay more than their DM counterparts when they issue bonds. This presents an opportunity for opportunistic investors.
If you consider the risk and reward trade off, as you’d expect, EM bonds’ volatility are above DM bonds, but well below equities. The chart below also shows that since 2006 DM high yield bonds have experienced nearly double the risk of EM hard currency bonds for a similar return.
Exhibit 6 – Fixed income portfolio efficient frontier, 2004-2022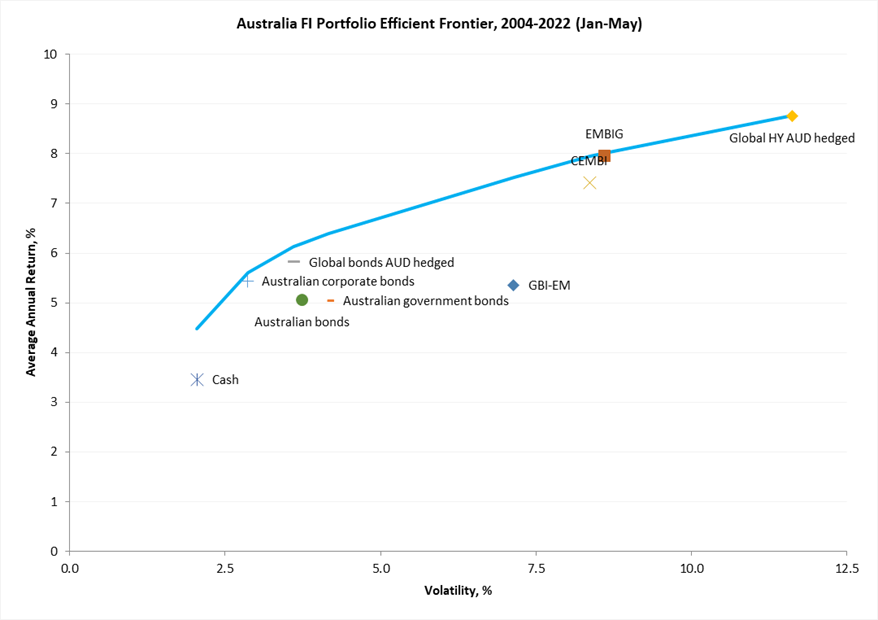
Source: Bloomberg, VanEck, 31 August 2022. Results are calculated monthly and assume immediate reinvestment of all dividends. Volatility is Standard Deviation of returns. You cannot invest in an index. Past performance is not a reliable indicator of future performance. Indices used: Cash – Bloomberg Australian Bank Bill 0+ Yr Index; Global Bonds AUD hedged – Barclays Global Aggregate Bond Index A$ Hedged; Australian Bonds – Bloomberg AusBond Composite Index; Australian corporate bonds – Bloomberg AusBond Credit 0+Yr Index; Australian government bonds – Bloomberg AusBond Australia Government Bond; GBI-EM is EM local - J.P. Morgan Government Bond Index-Emerging Markets Global Diversified (GBI-EM); EMBIG is EM hard currency - J.P Morgan Emerging Markets Bond Index Global Diversified (EMBIGD) – EMBIGD is unhedged, EBND hedges its hard currency; CEMBI – J.P Morgan Corporate Emerging Markets Bond Index (CEMBI); Global HY AUD hedged – Bloomberg Barclay Global High Yield Index A$ Hedged.
We’ve discussed this before, but based on the 18 years of data above, through August of this year (including all the bad recent times), the efficient frontier’s implied allocation is roughly 20% of all fixed income to EM debt for 4% standard deviation, and over 60% for a 7% standard deviation. We’re not recommending an allocation of that magnitude as a percentage of fixed income assets to EM debt, nor are we asset allocators. We believe that portfolios that continue to overlook EM debt will not survive bond stability, and if bonds recover, they will begin a major re-pricing. A dedicated allocation may be necessary, whatever the case, there is a strong argument for investors to consider an allocation greater than zero.
Active management in EM bonds
During the current rate rising environment and bond sell-off, it seemed babies were thrown out with the bathwater in all bond markets. Selectivity and remaining vigilant, especially in EM is key.
VanEck’s unconstrained approach offers a number of benefits including greater diversification than approaches limited to only hard or local currency. We believe an optimal portfolio of EM bonds is unconstrained by indices, and invests in bonds that offer the best value relative to their fundamentals while managing risk. EBND has outperformed its benchmark in 2022, mainly due to not owning any Russia, despite its large benchmark weight at the time, and by actively managing the portfolio’s hard and local currency positions. EBND has also demonstrated outperformance since its inception. As always, past performance is by no means indicative of future performance.
EBND performance as at 31 August 2022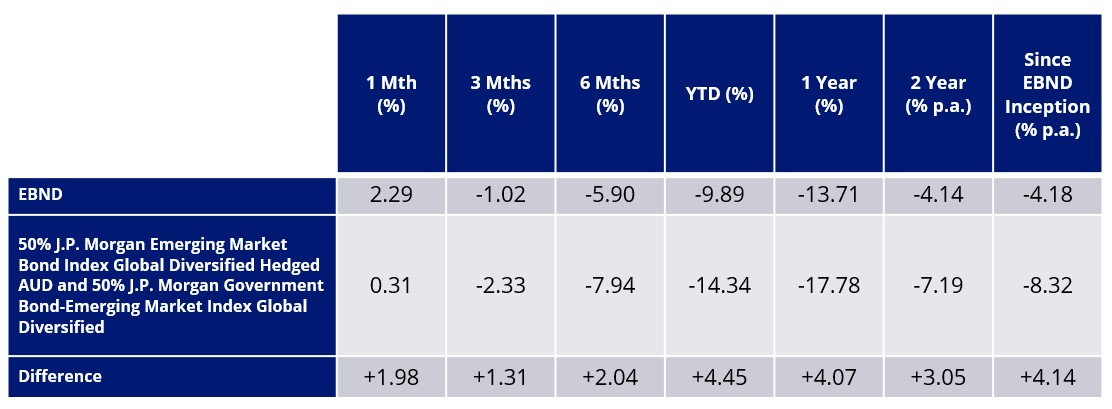
*Inception date is 11 February 2020. A copy of the factsheet is here.
Source: Bloomberg, VanEck. The chart above shows past performance of EBND and of 50% J.P. Morgan Emerging Market Bond Index Global Diversified Hedged AUD and 50% J.P. Morgan Government Bond-Emerging Market Index Global Diversified. Results are calculated to the last business day of the month and assume immediate reinvestment of distributions. EBND results are net of management fees and other costs incurred in the fund, but before brokerage fees and bid/ask spreads incurred when investors buy/sell on the ASX. Past performance is not a reliable indicator of future performance.
Monthly income: 5% p.a. target yield
EBND pays dividends monthly. EBND has a target dividend yield of 5% p.a*. As it is a fully transparent active ETF, EBND will trade close to its fair value because it is supported by an external market maker, which also facilitates liquidity.
VanEck’s EBND advantage
* VanEck determines the amount of the dividend each month taking into account all relevant factors targeting an annual dividend yield of 5% p.a. of the capital invested at the beginning of the period. VanEck may amend this target from time to time.
Key risks
An investment in the Fund carries risks associated with: ASX trading time differences, emerging markets bonds and currencies, bond markets generally, interest rate movements, issuer default, currency hedging, credit ratings, country and issuer concentration, liquidity and fund manager and fund operations. See the PDS for details.

Published: 30 September 2022
Any views expressed are opinions of the author at the time of writing and is not a recommendation to act.
VanEck Investments Limited (ACN 146 596 116 AFSL 416755) (VanEck) is the issuer and responsible entity of all VanEck exchange trades funds (Funds) listed on the ASX. This is general advice only and does not take into account any person’s financial objectives, situation or needs. The product disclosure statement (PDS) and the target market determination (TMD) for all Funds are available at vaneck.com.au. You should consider whether or not an investment in any Fund is appropriate for you. Investments in a Fund involve risks associated with financial markets. These risks vary depending on a Fund’s investment objective. Refer to the applicable PDS and TMD for more details on risks. Investment returns and capital are not guaranteed.