Rebuilding the buffer: New T-Bill issuance on the way after the debt ceiling dance
Since it hit the debt ceiling in January, the US government has been drawing down money held in the Treasury General Account with the Fed as the balance dropped from around US$700 billion to under US$50 billion now. In order to quickly rebuild that buffer, US Treasury Bill (T-Bill) issuance will need to increase to around $US1.25 trillion by the end of the year according to Morgan Stanley. Here’s what you should know about the debt ceiling, US T-Bills and how Australian investors can access this liquid market.
It has been predicted that the new T-Bills will need to return higher than the Federal Reserve’s reverse repo rate, which has been the go-to strategy for money market funds that have been attracting flows from bank deposits in order to attract the necessary liquidity. Currently the 1-3 month T-Bill yield is 5.2% and the new T-Bills are likely to be issued at these higher rates.
The debt ceiling
According to the US Department of Treasury, “The debt limit is the total amount of money that the United States government is authorized to borrow to meet its existing legal obligations, including Social Security and Medicare benefits, military salaries, interest on the national debt, tax refunds, and other payments.”
Since 1960, the US Congress has acted 78 times to raise, temporarily extend or revise the definition of the debt limit.
The US didn’t fulfil its debt obligations in 1979 when Congress didn’t legislate in time to raise the debt ceiling. This resulted in three late payments, not outright defaults:
- 26 April 1979, the US Treasury defaulted on US$41 million of maturing T-Bills. They were paid 20 days late on 17 May 1979.
- 3 May 1979, the US Treasury defaulted on another US$40 million of maturing T-Bills. These were paid 14 days later.
- 10 May 1979, the US Treasury defaulted on yet another US$40 million of maturing T-Bills. These were paid 7 days late on 17 May 1979.
The result of these ‘temporary’ defaults did shock many investors who, up until that time, believed that the US government would always pay its debts on time.
Back in 1979, the debt ceiling was US$879 billion, in 2021 it was raised to US$31.4 trillion.
The new deal does not raise the limit to a certain level, rather suspends it until 2025.
As Republicans and Democrats squabbled over the details, and there were fears that a deal may not be made, yields on T-Bills with longer maturities rose to 7%, while the shorter-dated ones hovered around 5.2%. Currently, the U.S. Treasury Bills: 1-3 Months Unhedged AUD Index yield is 5.2%, at the higher end of the Fed Funds Rate of 5-5.25%, as it appears the deal has been reached.
Since 19 January 2023, when the US hit its US$31.4 trillion limit, the Department of the Treasury has been taking measures in preparation for the necessary congressional approval. The Treasury has been drawing down money held in its General Account with the Fed. The balance has dropped from around US$700 billion this time last year to under US$50 billion now.
Chart 1: US Treasury, General Account: Week Average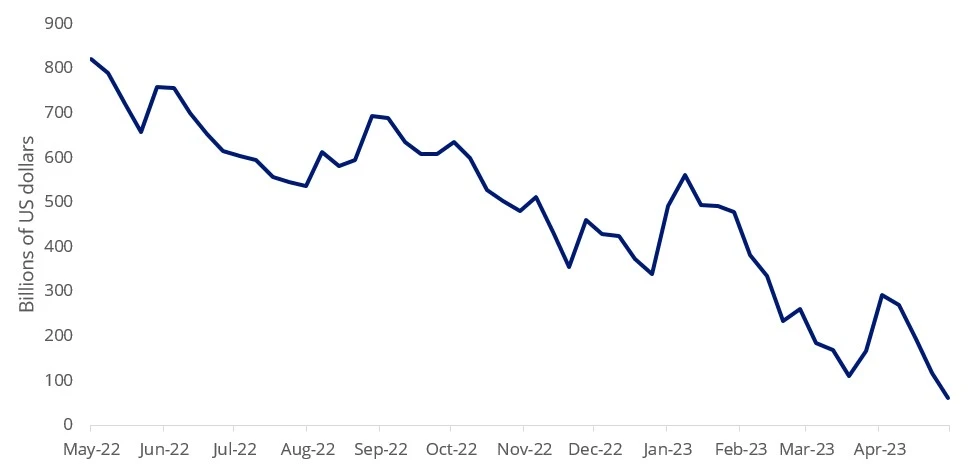
Source: Board of Governors of the Federal Reserve System (US), One year to 24 May 2023.
In order to quickly rebuild that buffer, T-Bill issuance will need to increase to around $US11.25 trillion by the end of the year according to Morgan Stanley.
It has been predicted that the new T-Bills will need to return higher than the Federal Reserve’s reverse repo rate, which has been the go-to strategy for money market funds that have been attracting flows from bank deposits.
One way for Australian investors to access this liquid market is the VanEck 1-3 Month US Treasury Bond ETF (TBIL).
TBIL gives investors access to short-term US treasury bonds via the efficiency of an ETF. TBIL offers exposure to short-term treasury bonds that mature within the next three months allowing investors to target the short-end of the yield curve. Because the index TBIL tracks is unhedged, as rates have risen in the US more than in Australia and the US dollar has strengthened, the index TBIL tracks has benefited.
Chart 2: AusBond Bank Bill Index versus 1m-3m US Treasury Bills (hedged and unhedged)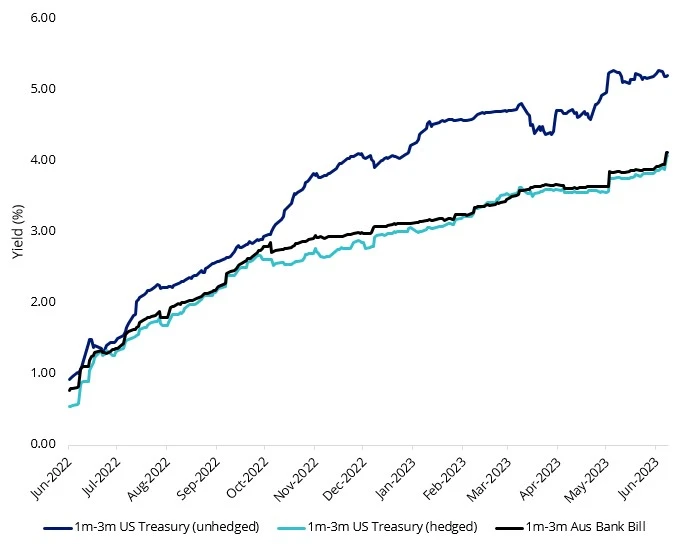
Source: Bloomberg, VanEck. Past performance is not indicative of future performance. You cannot invest directly in an index. 1m-3m US Treasury (unhedged) is represented by the Bloomberg U.S. Treasury Bills: 1-3 Months Unhedged AUD Index, 1m-3m US Treasury (hedged) is represented by the Bloomberg U.S. Treasury Bills: 1-3 Months Hedged AUD Index, 1m – 3m Aus Bank Bill is represented by the Bloomberg AusBond Bank Bill Index.
In the current macro environment
Currently, short-term treasury bond yields are higher than longer-term yields which is known as an inverted yield curve. In the past, this has been a forward indicator for a recession. A recession can create uncertainty in markets.
The Australian dollar is considered a “risk on” currency so in times of uncertainty it typically depreciates relative to the US dollar. The US dollar could appreciate relative to the Australian dollar if we enter a period of economic weakness.
Chart 3: Market risk hedge
AUD/USD
Source: Bloomberg past performance is not indicative of future performance
The index that TBIL tracks is the Bloomberg U.S. Treasury Bills: 1-3 Months Unhedged AUD Index and has returned 4.96% per annum over the past 10 years. The below table outlines the performance of TBIL’s index since its inception - as always, past performance is not indicative of future performance.
Table 1: Trailing performance - Bloomberg U.S. Treasury Bills: 1-3 Months Unhedged AUD Index
|
Performance as at 31 May 2023 |
1 Mth |
3 Mths |
6 Mths |
1 Yr |
3 Yrs |
5 Yrs |
10 Yrs |
15 Yrs |
Since inception |
|
Bloomberg 1-3 Month US Treasury Bill Index |
2.53 |
5.45 |
5.82 |
14.55 |
2.03 |
4.70 |
4.96 |
3.26 |
2.94 |
Source: Bloomberg, Returns in Australian dollars. Results are calculated to the last business day of the month and exclude costs associated with investing in the ETF. You cannot invest directly in the Index. The above performance information is not a reliable indicator of current or future performance of TBIL, which may be lower or higher. The Bloomberg U.S. Treasury Bills 1-3 Months Unhedged AUD Index was launched on 19 May 1997 and has a base date of 31 December 1991. Data prior to the launch date is back-tested data.
Key risks
An investment in TBIL carries risks associated with: interest rate movements, currency, bond markets generally, issuer default, credit ratings, country and issuer concentration, liquidity, tracking an index and fund operations. See the PDS for more details.

Published: 08 June 2023
VanEck Investments Limited (ACN 146 596 116 AFSL 416755) (VanEck) is the issuer and responsible entity of all VanEck exchange traded funds (Funds) listed on the ASX. This is general advice only and does not take into account any person’s financial objectives, situation or needs. The product disclosure statement (PDS) and the target market determination (TMD) for all Funds are available at vaneck.com.au. You should consider whether or not any Fund is appropriate for you. Investments in a Fund involve risks associated with financial markets. These risks vary depending on a Fund’s investment objective. Refer to the applicable PDS and TMD for more details on risks. Investment returns and capital are not guaranteed.
Bloomberg® and the indices licensed herein (the “Indices”) are service marks of Bloomberg Finance L.P. and its affiliates, including Bloomberg Index Services Limited (“BISL”), the administrator of the Indices (collectively, “Bloomberg”) and have been licensed for use for certain purposes by VanEck Investments Limited (the “Licensee”). Bloomberg is not affiliated with the Licensee, and Bloomberg does not approve, endorse, review, or recommend the financial products referenced herein (the “Financial Products”). Bloomberg does not guarantee the timeliness, accurateness, or completeness of any data or information relating to the Indices or the Financial Products.