Bridging the gap
Global Infrastructure as an asset class was hit hard with the market benchmark, the FTSE Developed Core Infrastructure 50/50 Hedged into Australian Dollars Index, and its recovery has not yet matched global equity markets.
Investors remain wary of companies with revenues tied to customer volumes like airports and toll-roads, which have been the hardest hit as a result of restrictive travel conditions and lock-downs.
Infrastructure however is a broad category, including networks and facilities necessary for sustaining society such as utilities, towers and water. Many of these companies’ operations have continued to hold-up well during this period and thus represent an opportunity.
Additionally we believe that in time, travel and road use will return to pre-COVID-19 levels, which will see a large rebound in these assets too.
Global Infrastructure’s recovery has so far trailed equities
When markets retreated in March, infrastructure assets were among the worst hit. While equities have led a recovery, infrastructure has lagged – see Figure 1.
Figure 1: 2020 calender year to date index performance
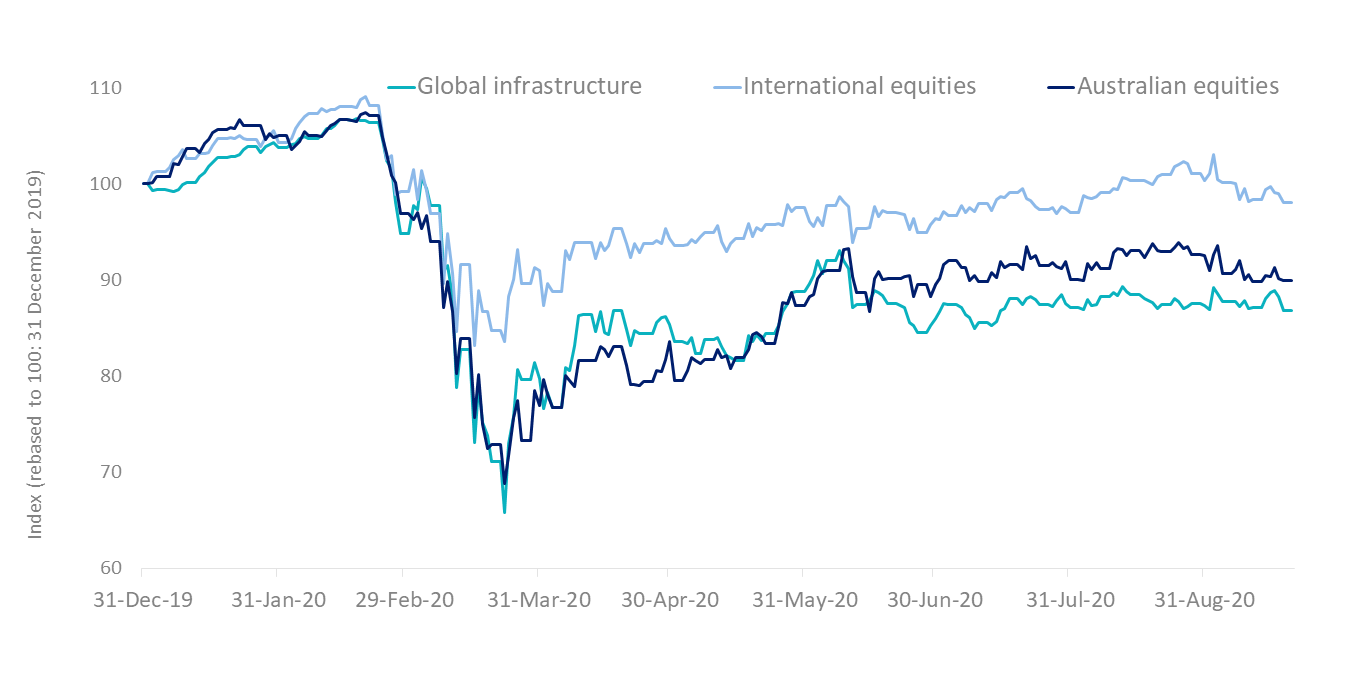
Source FTSE, 31 Dec 2019 to 21 September 2020. Rebased to 100. Indices used, Global Infrastructure: FTSE Developed Core Infrastructure 50/50 Hedged into Australian Dollars Index; International equities: MSCI World ex Australia Index; Australian equities: S&P/ASX 200 Index
There is no doubt the significant economic downturn has had an impact on valuations in the short term but the nature of most infrastructure assets is that they are long duration, often 30+ years. Additionally there are some infrastructure assets such as mobile telecommunications that have not experienced a slowdown at all. As such, our view is that most infrastructure assets will not be derailed by a one or so year of revenue shock and we remain positive on the long term case for infrastructure assets in a portfolio.
With financial market returns being so strong for most of the last decade, value opportunities have been hard to come by. Likewise, investors requiring income from their portfolios had a difficult time given the downward trajectory of interest rates. With most economies experiencing low or negative real rates and central banks using unconventional programs in order to stimulate their economies, income investors will have an even harder time as the economy recovers. Against this backdrop, infrastructure can provide both a value and income opportunity.
Global infrastructure stocks are now at their cheapest level that they have been for some time, as measured by the EV/EBITDA ratio, which is around 12, coming off its lowest level since December 2018 – see Figure 2.
Figure 2: A value opprtunity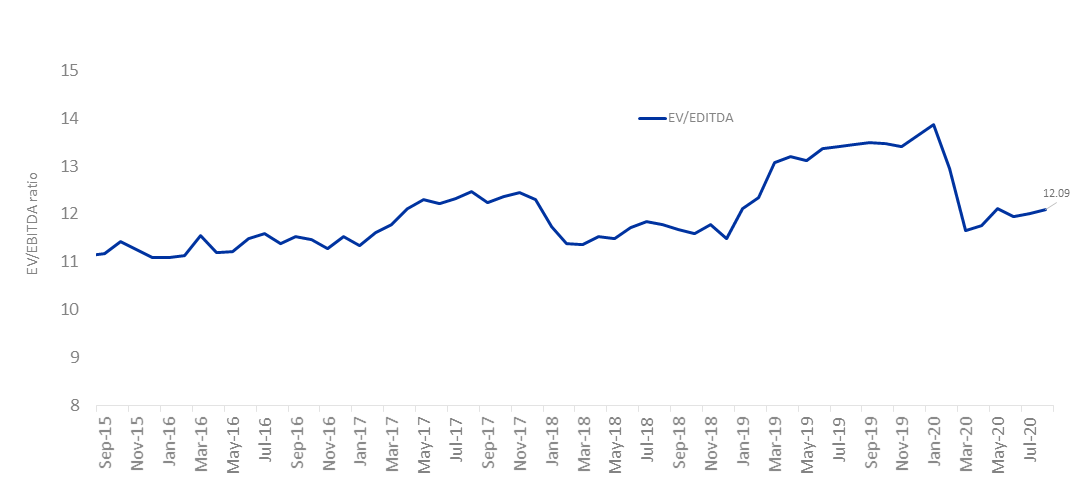
Source FTSE, five years to 31 August 2020. Index used FTSE Developed Core Infrastructure 50/50 Hedged into Australian Dollars Index.
Despite falling yields elsewhere, the dividend yield on the FTSE Developed Core Infrastructure 50/50 Index was relatively high at 3.35% as at 31 August 2020. The 12 month trailing yield rose significantly in March 2020 due to the fall in asset prices – see Figure 3. While there may be some companies that reduce dividends, a large cohort will not do this, meaning we still anticipate a reliable and attractive income stream.
Figure 3: Dividend yield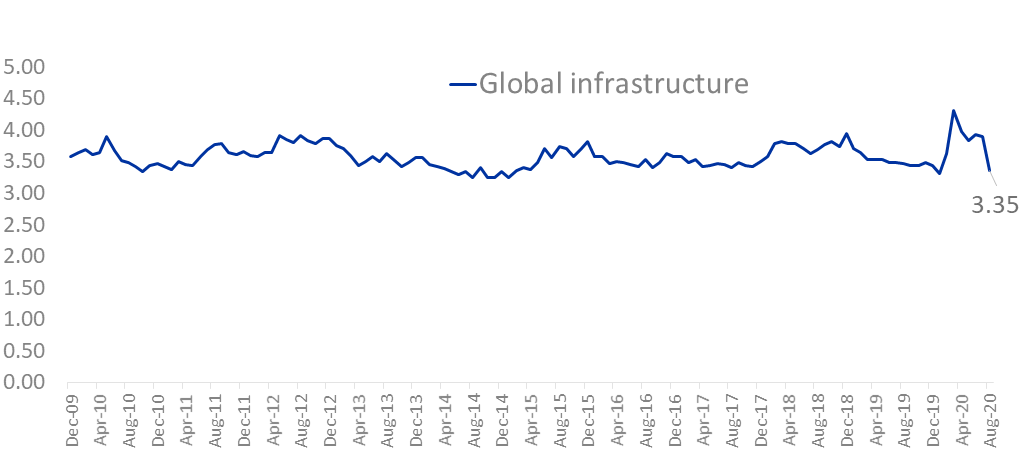
Source FTSE. Global Infrastructure is FTSE Developed Core Infrastructure 50/50 Hedged into Australian Dollars Index. You cannot invest in an index. Dividend yield is not a guarantee of future dividends by IFRA. Past performance of the index is not a reliable indicator of future performance of the fund.
Diversification is key
While we believe that long run returns expectations for infrastructure are now very attractive, this environment has significant risks for individual assets. As such, being diversified across a range of underlying sectors and stocks is key. The following figures show the sector breakdown of the FTSE Developed Core Infrastructure 50/50 Hedged into Australian Dollars Index (IFRA Index) and the returns of each sector for CYTD August 2020.
Figure 4: CYTD 2020 IFRA Index sub-sector return
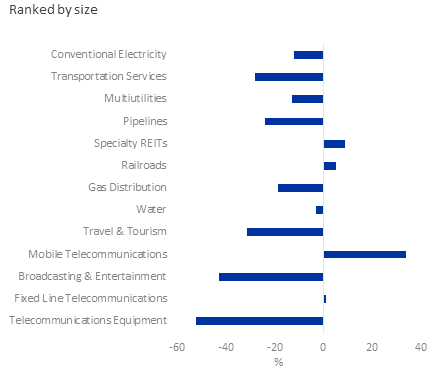
Figure 5: IFRA Index sub-sector breakdown 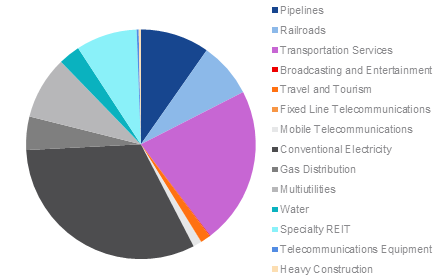
Source for Figues 4 and 5: Factset, FTSE, 1 January 2020 to 31 August 2020. Returns in Australian dollars. The Index is hedged to AUD. Sub-sectors are FTSE Industry Classification Benchmark (ICB) subsectors. Past performance is not a reliable indicator of future performance.
‘Defensive’ infrastructure such as utilities and specialty REITs (which includes American Tower Corporation and Crown Castle) have fared better than transportation and pipelines (which have also been impacted by the low oil price). This highlights the importance of diversification.
The IFRA Index has sector and stock capping that improves diversification and reduces concentration risk at both a sector and stock level. It is also used as the global infrastructure benchmark by industry participants including consultants and fund managers.
One trade access to 140 Global Listed Infrastructure securities
VanEck provides investors with the opportunity to access a portfolio of around 140 global infrastructure securities simply via a single trade on ASX in the VanEck Vectors FTSE Global Infrastructure (Hedged) ETF (ASX: IFRA). IFRA was the first global infrastructure ETF on ASX.


Published: 29 September 2020