The asset class that keeps on truckin'
This is why infrastructure, as an asset class, has become sought after by investors.
Infrastructure is critical for a functioning society and it consists of a diverse range of assets including transport networks such as roads, railways, airports, canals and ports and it also includes other networks and facilities necessary for sustaining society such as utilities, towers and water.
Infrastructure’s rise, as an asset class, has been driven by its use by large institutions attracted to its long-term risk return profile. Investing directly in infrastructure requires large capital outlays and investments are often illiquid.
The asset class has broad appeal, and ETFs such as the VanEck FTSE Global Infrastructure (Hedged) ETF (IFRA) allows investors to access a diversified portfolio of listed infrastructure companies from around the world.
The current macroeconomic outlook, which is expected to be characterised by slowing growth and continued rising rates and high inflation, has impacted returns on all assets, especially those perceived as ‘long duration’ such as infrastructure.
While infrastructure assets are typically long-lived and linked to dependable income, there are some variables that investors need to consider that are distinctive to some infrastructure assets, for example:
-
- earnings from assets such as toll roads are inflation linked; and
- utilities often benefit from regulated price increases which shield the return on assets from the effects of inflation and interest rates.
As such, we believe global infrastructure offers some hedging against inflation and rising rates. And because, as noted above, demand for many infrastructure assets are inelastic, it potentially will not be as impacted by slowing global economic as other asset classes.
In addition, there are long term tail winds and structural support that is positive for the asset class. Now could be the time to consider the asset class that keeps on truckin’ as a portfolio construction tool.
Characteristics of infrastructure
Investors have come to recognise that infrastructure assets tend to be linked to steady and reliable income, supported by real assets that tend to be long lived, retaining their value. Sydney Airport is an example of an asset that has recently been sold.
During the low rate environment following the GFC, global listed infrastructure securities were particularly attractive with investors sometimes earning them the moniker of ‘bond proxy’. Indeed, that is how many investors were using them.
Infrastructure in a rising rate environment
On 1 February, the US Federal Reserve (the Fed) raised its rates for the eighth time this cycle, and rises are expected to continue, as the Fed remains committed in its fight against inflation. In this rising rate environment, income producing assets such as bonds generally perform poorly but considering infrastructure as a ‘bond proxy’ may not be correct and investors could be missing out on potential upside.
Many infrastructure assets such as utility companies providing electricity, gas and water have earnings that are regulated based on their cost of capital. As the cost of capital rises (or falls), so do their revenues. As a result, the earnings performance of these companies should be largely unaffected by rising rates.
Some infrastructure assets such as roads are also often linked to inflation as they have contractual abilities to raise toll prices in line with CPI.
Additionally, the earnings of some infrastructure assets are affected by customer usage such as airports and these assets usually benefit from increased traffic growth in times when real interest rates are rising – assuming that the reason for higher interest rates is due to improving economic/GDP growth. The ongoing increased mobility of the population since the easing of COVID restrictions, support increased demand for infrastructure.
Infrastructure returns during the most recent rising rate environments
Contrary to common belief, history shows infrastructure stocks can perform well when interest rates start rising.
When the Fed started its hiking cycle in 2004, global listed infrastructure returned 33.41% in the year following. Even in the short-term, with expected price weakness, performance was 8.26% in the 3 months following the first 2004 rate hike. The same index had seen a 4.05% rise after the first hike in December 2016, finishing 12 months later with a 21.27% return. After the Fed raised rates this time, infrastructure initially held up well, but since then, investors have had nowhere to hide from market falls.Table 1: Infrastructure Index post the Federal Reserve rate rises
|
Start of hike cycle |
+3 months (%) |
+6 months (%) |
+12 months (%) |
|
June 2004 |
|||
|
Infrastructure Index |
8.26% |
9.99% |
33.41% |
|
December 2016 |
|||
|
Infrastructure Index |
4.05% |
8.86% |
21.27% |
|
March 2022 |
|||
|
Infrastructure Index |
15.99% |
-3.07% |
- |
Prior to the COVID-19 market falls, relative performance of infrastructure securities to other equities tended to have a negative correlation to the US 10-year yield. That went out the door as lockdowns took hold, airports ceased operating and toll roads experienced decreases in traffic. As a result, infrastructure fell with long term rates. Only in the second half of 2022, as the US 10-year jumped higher, did infrastructure resume its negative correlation and hence its recent poor relative performance. Should rates normalise, there could be significant upside for infrastructure assets.
Chart 1: Infrastructure versus government yield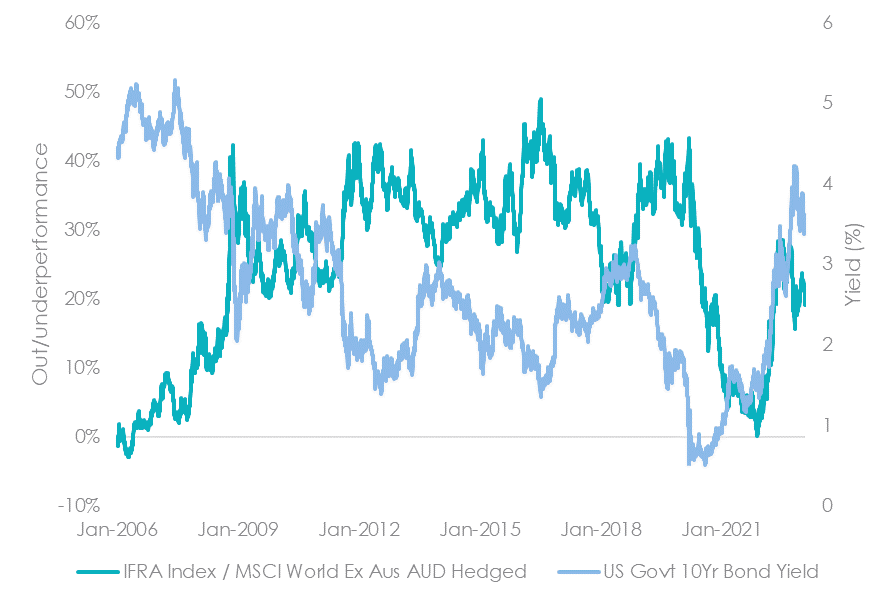
Source: Bloomberg, VanEck. Past performance is not a reliable indicator of future performance. You cannot invest in an index.
Potentially recession proof
One of the key drivers of the long-term performance of global infrastructure securities is that they exhibit inelastic demand for the services they offer. These are basic services in people’s lives such as major roads and household. The consumption patterns, and therefore the cashflow, vary little in response to price or the economic cycle.
Recent and long-term tailwinds
In August, the US Inflation Reduction Act was enacted and we believe it has the potential to transform infrastructure. Production credits support energy and utility providers that invest in sustainable infrastructure, and as demand for energy and utilities continues to increase, the investment opportunity goes well beyond headline figures. The resulting increase in expenditure, incentives and co-investment between governments and private enterprises creates an opportunity and those existing providers are best placed to capitalise.
In addition, the dire need for infrastructure spending underpins the policies for growth for the next decade and beyond for many other governments around the world. According to the World Bank, over US$90 trillion of new investment will be needed to meet infrastructure needs over the next two decades. Shifting demographics such as the growing global population requires not only more investment in infrastructure but also doing more with less.
In developed markets, the aging population who require stable income to fund retirements will put a premium on income generating assets. If they have been spooked by the recent ‘volatility’ of bonds, they may, potentially prefer riskier ‘real’ assets, thus driving demand.
Diversification is key
While we believe that long run return expectations for infrastructure are now attractive, this environment still has significant risks for individual assets. As such, being diversified across a range of underlying sectors and stocks is key.
The IFRA gives investors exposure to a diversified portfolio of 133 global listed infrastructure securities. IFRA tracks the FTSE Developed Core Infrastructure 50/50 Hedged into Australian Dollars Index which has sector and stock capping that improves diversification and reduces concentration risk at both a sector and stock level. It is also used as the global infrastructure benchmark by industry participants including consultants and fund managers.
Dividends are paid four times a year – furthermore VanEck’s tax strategy ensures income is smooth and not impacted by currency fluctuations. IFRA is also the most cost-effective A$ hedged global infrastructure offering in the Australian market.
Stable income advantage
IFRA is hedged into Australian dollars to limit the impact that currency movements could have on income. IFRA, unlike many other global listed infrastructure funds, also makes beneficial choices under the tax rules, including adopting the ‘Taxation of Financial Arrangements’ (ToFA) currency hedging rules. These tax choices enable smooth income payments to be maintained over time.
Not all fund managers utilise this strategy. Below on the left is a hedged infrastructure example from a widely regarded fund manager, on the right is IFRA. Note that the example Australian dollar hedged unlisted managed fund made no distributions between September 2014 and 30 June 2016, nor did they distribute throughout 2019 and they did not pay income during the past six quarters. IFRA, on the other hand, has maintained a steady income.
Chart 2: Unlisted Managed Fund: Dividend Payment History (cpu)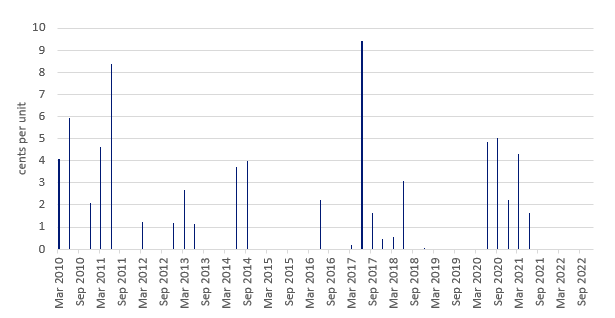
Chart 3: IFRA: Dividend Payment History (cpu)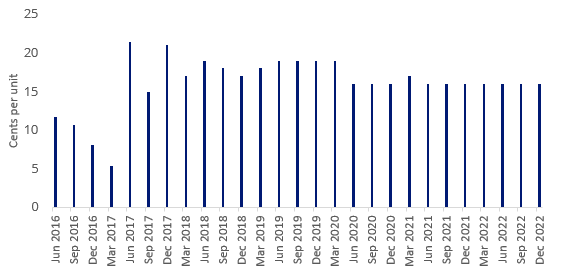
Source: Fund Manager website accessed 2 February 2023. Past performance is not a reliable indicator of future performance.
One trade access to 133 Global Listed Infrastructure securities
With one trade on ASX IFRA gives investors access to:
- a portfolio of 133 of the world’s largest infrastructure securities providing international diversification that replicates the well-regarded market benchmark for global listed infrastructure, the FTSE Developed Core Infrastructure 50/50 Hedged into Australian Dollars Index;
- stable income paid quarterly; IFRA’s 12-month trailing dividend yield is 3.04% (as at 31 January 2023), as always dividend yield is not a guarantee of future dividends by IFRA; and
- a cost-effective strategy with a management fee of 0.52% p.a., which is around a third of the cost of an equivalent active Global Listed Infrastructure strategy.
If you’re looking for more information, you can visit our dedicated property and infrastructure landing page.
Key risks: An investment in the ETF carries risks associated with: ASX trading time differences, financial markets generally, individual company management, industry sectors, foreign currency, currency hedging, country or sector concentration, political, regulatory and tax risks, fund operations, liquidity and tracking an index. See the PDS for details.


Published: 10 February 2023