A comparison of international investing approaches
Historically, there have been two popular approaches to investing in international equities:
- via an actively managed fund; or
- via a passive fund tracking the benchmark index.
Actively managed funds have been known to incur high costs and the dispersion of returns between managers have been high. Sometimes the returns were good, but often they were not. Many people found this a poor bargain and moved to lower-cost passive funds that tracked traditional indices or similar reproductions of these. In these new funds, returns were considered average - not high, not low, just the market average.
When it comes to international investing in a passive fund, the widely used benchmark is the MSCI World ex Australia Index, for ease of reading let’s call it the ‘International Equity Index’. This index has over 1,500 companies in it, and not all of them are desirable from an investing point of view.
We think investors should also consider a third approach to international investing and lots already are.
Our International Quality ETF (QUAL) tracks an index, but it’s not the International Equity Index, it is the MSCI World ex Australia Quality Index. This index includes the top 300 companies from the International Equity Index selected on the basis of high return on equity (ROE), low debt and stable earnings. The characteristics are synonymous with ‘quality’ investing.
You can read more about quality investing - here.
We think QUAL provides a compelling alternative to ETFs that track the International Equity Index, even after you take fees into consideration.
So, let’s walk through the difference between QUAL and the International Equity Index.
QUAL vs International Equity Index - Performance
Since QUAL launched in 2014, its quality approach has served Australian investors well. Over longer-term periods QUAL has outperformed the International Equity Index – a testament to quality investing’s prowess across the range of economic cycles.
Chart 1: Cumulative performance since QUAL inception date to 20 November 2023 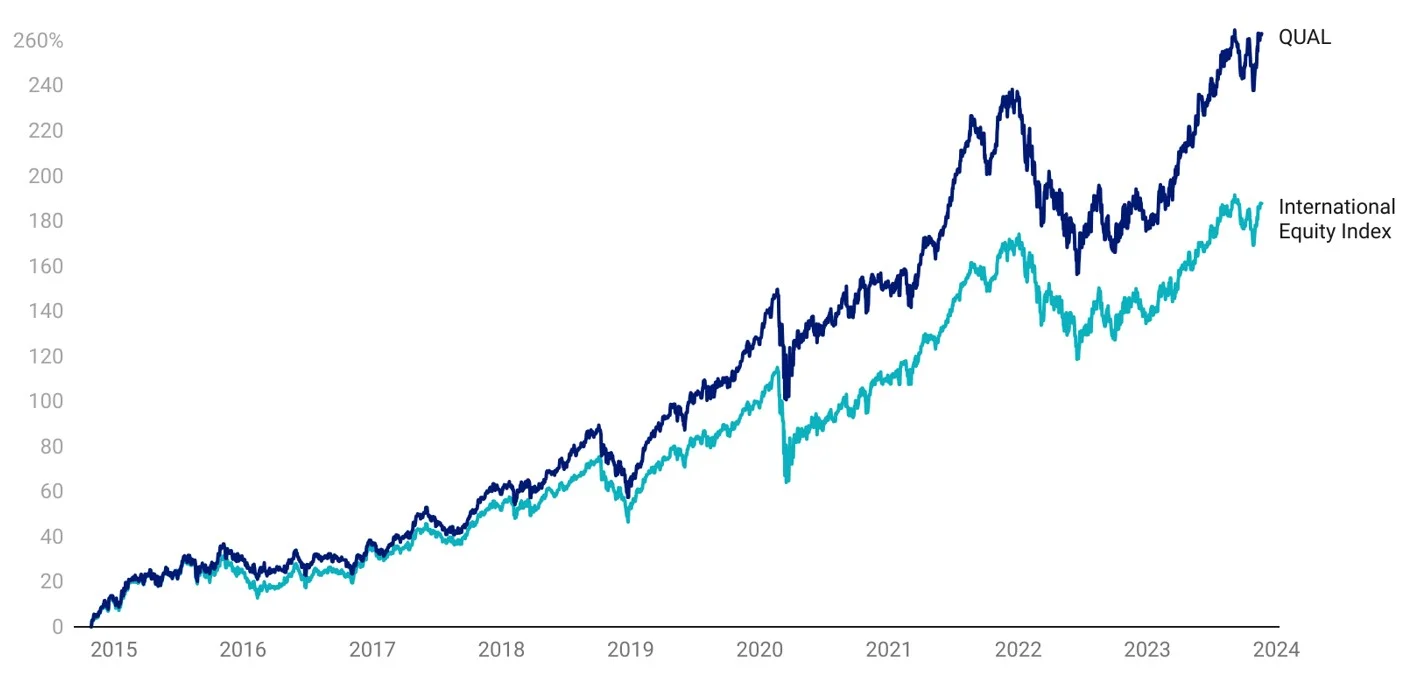
Table 1: Trailing performance to 20 November 2023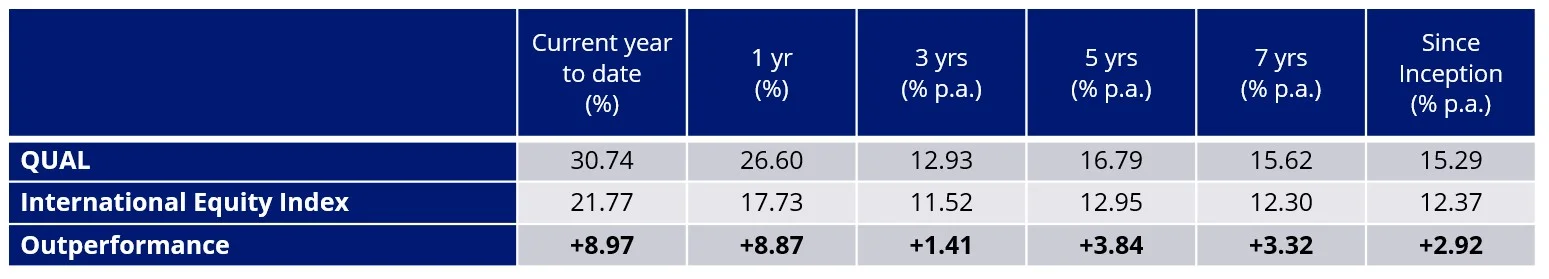
*Inception date is 29 October 2014 – the most recent factsheet is here. International Equity Index is MSCI World ex Australia Index. Chart 1 and Table 1 source: Morningstar Direct, VanEck. The chart and table above show past performance of QUAL and of the MSCI World ex Australia Index. You cannot invest directly in an index. Results are calculated to the last business day of the month and assume immediate reinvestment of distributions. QUAL results are net of management fees and other costs incurred in the fund, but before brokerage fees and bid/ask spreads incurred when investors buy/sell on the ASX. Returns for periods longer than one year are annualised. Past performance is not a reliable indicator of future performance. The MSCI World ex Australia Index (“MSCI World ex Aus”) is shown for comparison purposes, as it is the widely recognised benchmark used to measure the performance of developed market large- and mid-cap companies, weighted by market capitalisation. QUAL’s index measures the performance of 300 companies selected from MSCI World ex Aus based on MSCI quality scores, weighted by market cap x quality score at rebalance. Consequently, QUAL’s index has fewer companies and different country and industry allocations than MSCI World ex Aus. Click here for more details.
QUAL in an economic contraction
There has been much speculation about whether there is going to be a global recession. In developed markets central banks, including our own and the US’s Federal Reserve, raised rates to curb inflation. The impact of raising rates is to slow down the economy. There is a fear that the current rate-rising cycle could drive us into a recession or economic contraction.
An economic contraction is one of the four stages of the economic cycle. In the chart below, we label each stage of the economic cycle with a colour: recovery (blue), expansion (green), slowdown (orange) and contraction (purple). We have used the Purchasing Managers’ Index (PMI) as a measure of the prevailing direction of the economy. It is an indication of the trends in the manufacturing and service sectors by measuring the change in production levels across the economy from month-to-month. It is therefore considered a key indicator of the state of the economy.
So, to illustrate how the quality factor may perform in the current economic environment, as well as through the cycle, in Chart 2 below we overlay the PMI with the relative performance of ‘quality’ (MSCI World Quality Index/MSCI World Index), the black line. When the black line is rising, quality is outperforming. You can see below the PMI is contracting (below 0 in the chart), and since the beginning of the year, quality has been outperforming.
Chart 2: US ISM Manufacturing PMI Index and relative MSCI World Quality performance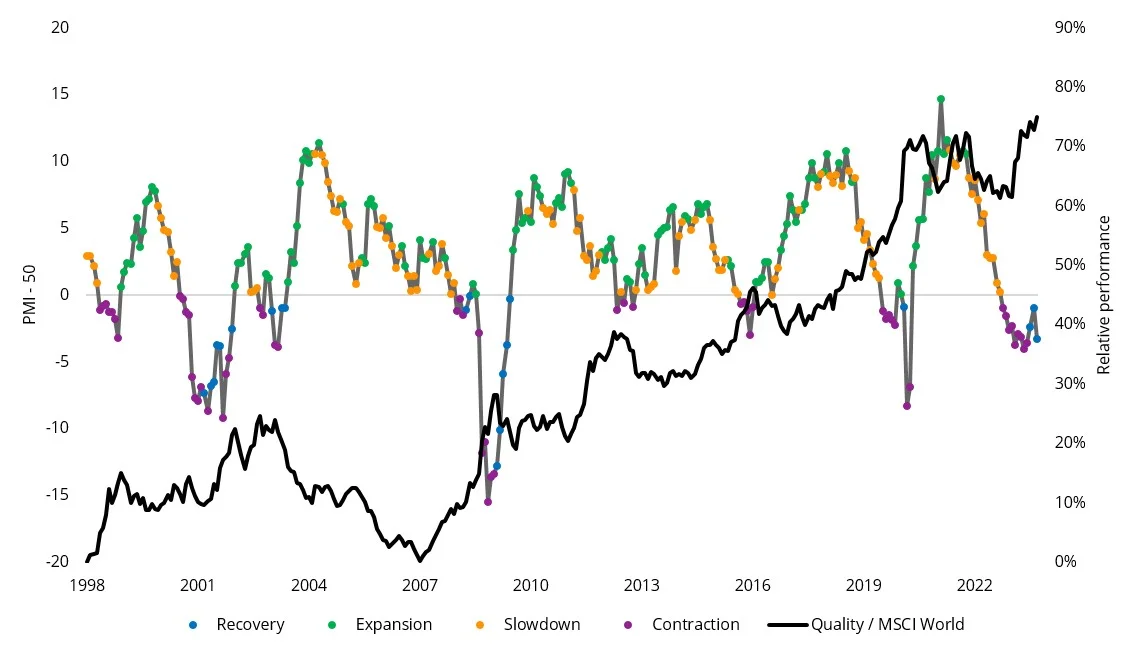
Source: Bloomberg, MSCI, October 2023. Past performance is not a reliable indicator of future performance. Quality and MSCI World represented by the MSCI World Quality Index and MSCI World Index respectively. You cannot invest directly in an index. Results assume immediate reinvestment of all dividends and exclude costs associated with investing in the ETF and taxes. You cannot invest directly in an index.
It is evident from the above that quality had periods of outperformance and underperformance and that these tend to correlate to the economic cycle. The table below represents the returns of the quality factor through the economic cycles since 1997.
Table 2: Quality Factor performance during different economic regimes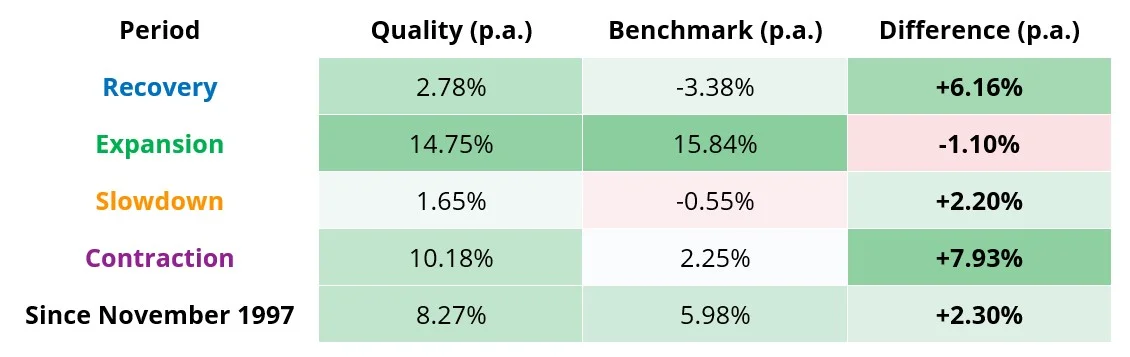
Source: Bloomberg, MSCI, Since common inception (November 1997) to October 2023. Past performance is not a reliable indicator of future performance. Quality and Benchmark are represented by the MSCI World Quality Index and MSCI World Index respectively.
You can see that quality historically outperformed most during a contraction and subsequent recovery. As a result of these performance characteristics, the quality factor has earned the reputation as being a ‘defensive factor’. Quality companies have historically stable earnings and are lowly leveraged, so they are typically better equipped to withstand the downside extremes of the economic cycle.
The analysis shows that while quality does tend to behave defensively in downturns, it also tends to capture a fair share of the upside in expansions. While we always point out that past performance cannot be relied upon for future performance, the quality factor has historically demonstrated long-term outperformance across entire economic cycles.
We highlighted the importance of quality during slowdowns and contractions here and here.
QUAL vs International Equity Index - Top 10 holdings
Below you can see the top 10 companies. The top 10 holdings are companies that investors can relate to in their day-to-day lives – to see all the holdings in QUAL and their weightings click here.
|
Table 3: Top 10 holdings QUAL |
Table 4: Top 10 MSCI World ex Australia Index |
|
|
|
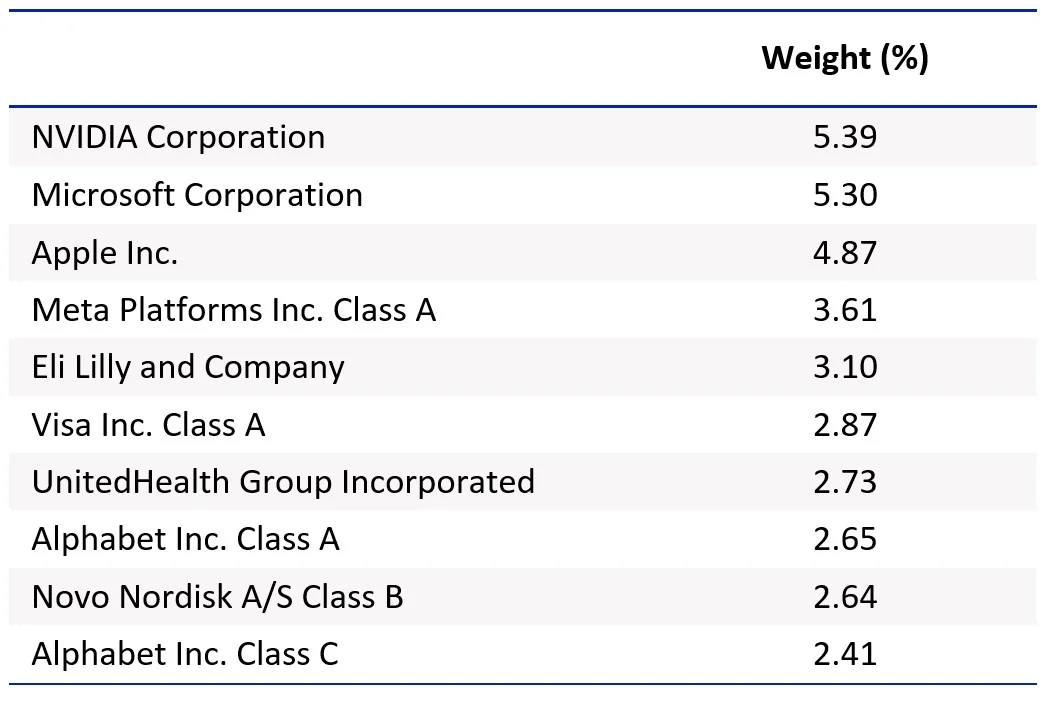
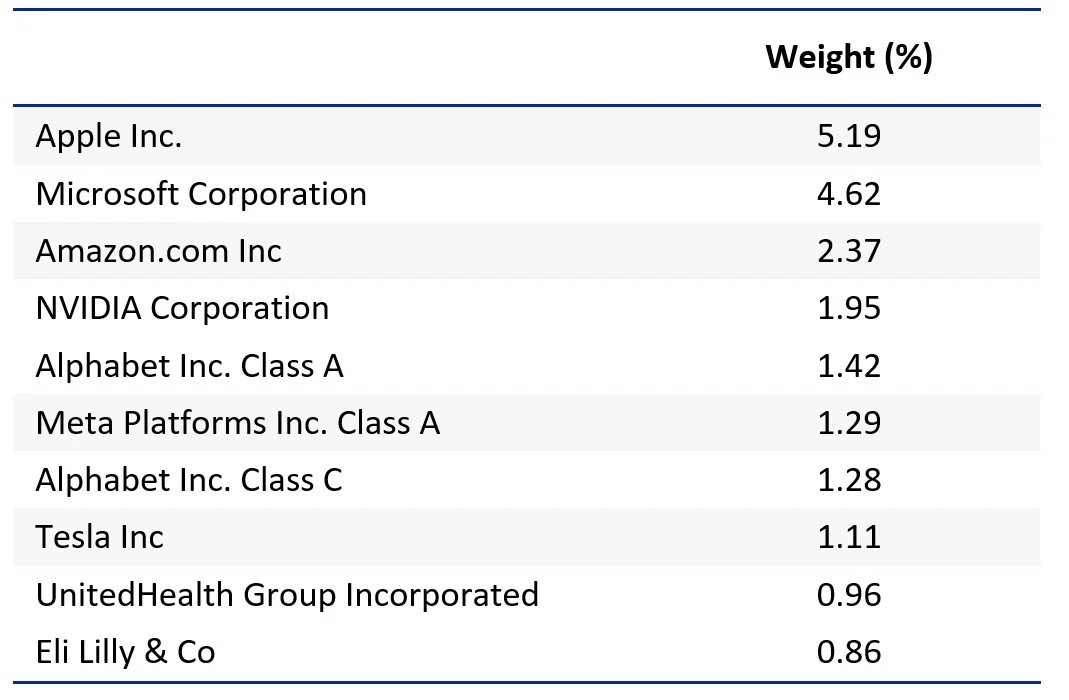
Source: FactSet, VanEck, MSCI, as at 31 October 2023. Not a recommendation to act.
QUAL vs International Equity Index - Style
When looking at portfolios it is important to determine what style, e.g. value or growth, and what size bias a portfolio holds, e.g. giant, large, mid or small. Below we can see QUAL’s. Importantly QUAL holds giant companies with a core-growth orientation relative to the International Equity Index.
|
Chart 3: QUAL holdings-based style map |
Chart 4: MSCI World ex Australia Index holdings-based style map |
|
|
|
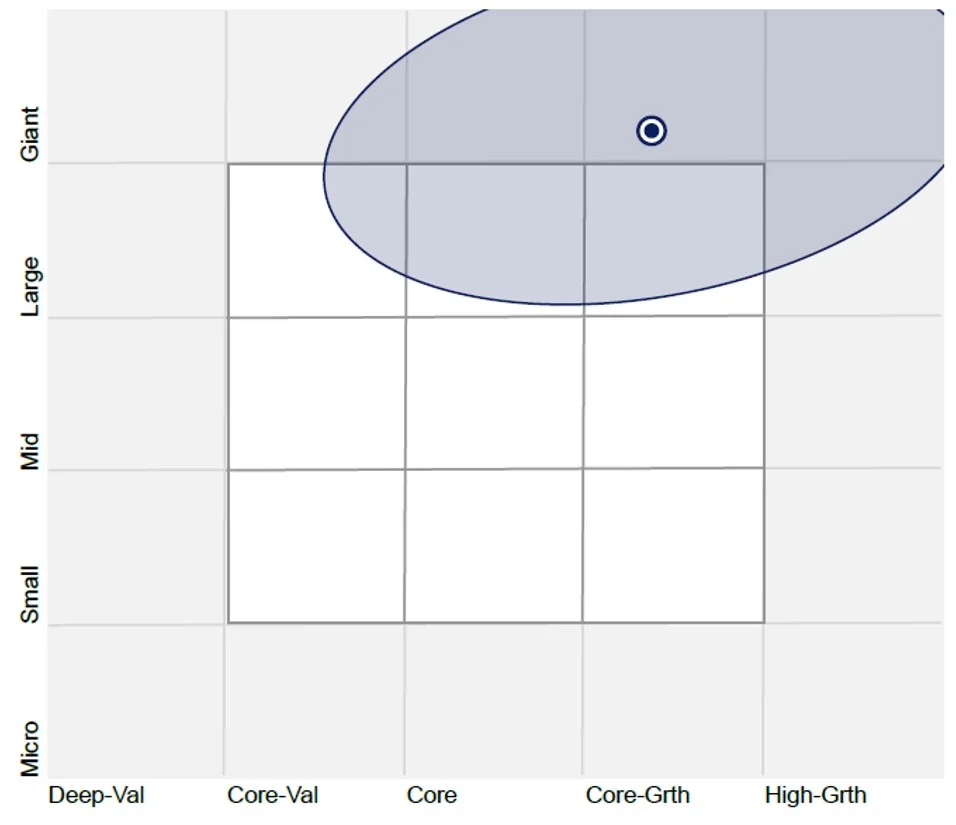
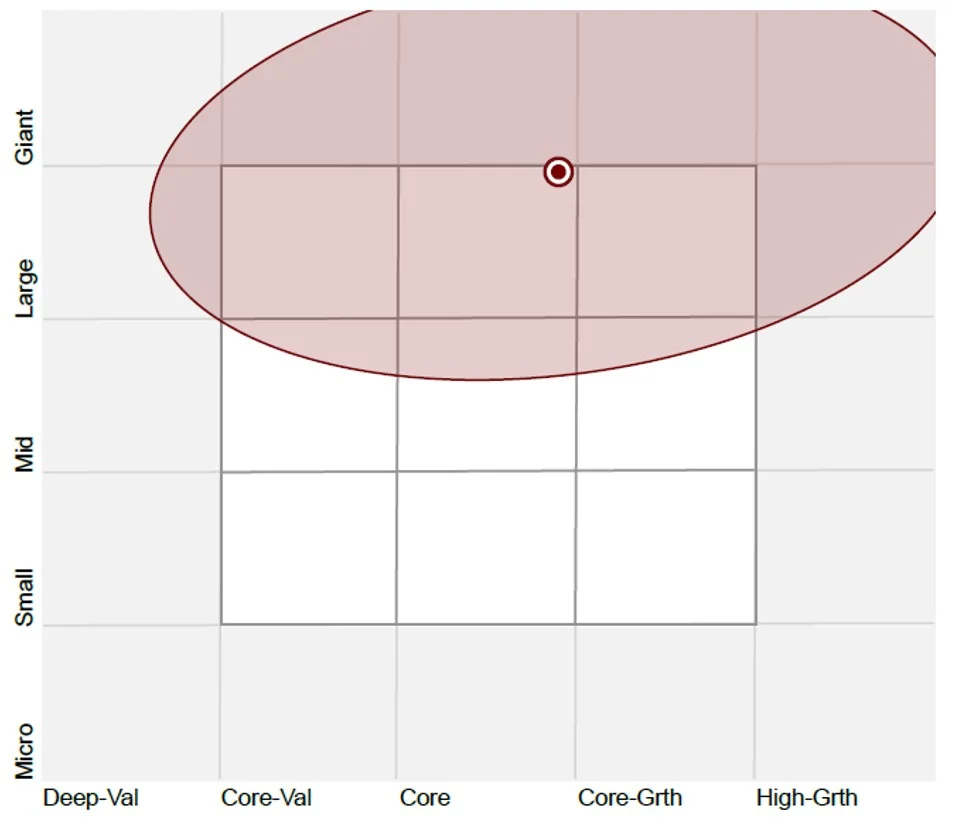
Source: Morningstar Direct, as at 31 October 2023
QUAL vs International Equity Index – Fundamentals
Table 5: Statistics and fundamentals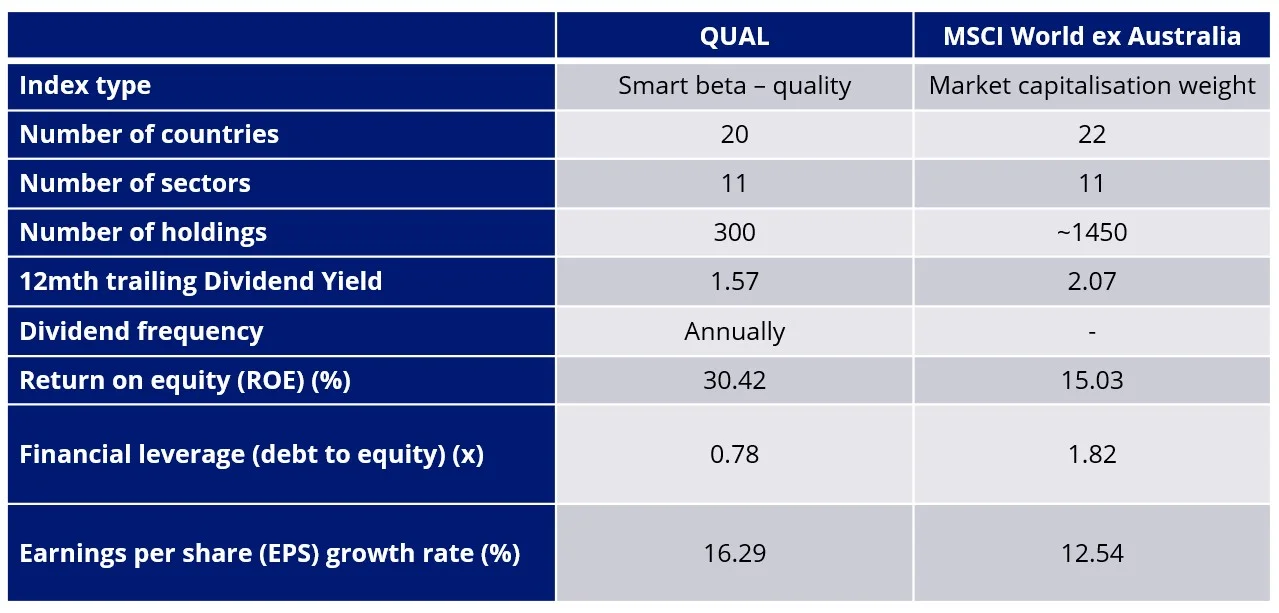
Source: VanEck, MSCI, FactSet, as at 31 October 2023. You cannot invest directly in an index.
As you would expect, QUAL has higher ROE, lower financial leverage and a higher EPS growth rate.
While many international equity ETFs have merits for portfolio inclusion, you should assess all the risks and consider your investment objectives.
Australian dollar hedged versions of many exposures noted exist too.
Past performance is no guarantee of future performance. The above is not a recommendation. Please speak to your financial adviser or stock broker.
Key risks
An investment QUAL carries risks associated with: ASX trading time differences, financial markets generally, individual company management, industry sectors, foreign currency, country or sector concentration, political, regulatory and tax risks, fund operations and tracking an index. See the PDS for details.


Published: 22 November 2023
Any views expressed are opinions of the author at the time of writing and is not a recommendation to act.
VanEck Investments Limited (ACN 146 596 116 AFSL 416755) (VanEck) is the issuer and responsible entity of all VanEck exchange trades funds (Funds) listed on the ASX. This is general advice only and does not take into account any person’s financial objectives, situation or needs. The product disclosure statement (PDS) and the target market determination (TMD) for all Funds are available at vaneck.com.au. You should consider whether or not an investment in any Fund is appropriate for you. Investments in a Fund involve risks associated with financial markets. These risks vary depending on a Fund’s investment objective. Refer to the applicable PDS and TMD for more details on risks. Investment returns and capital are not guaranteed.
QUAL is indexed to a MSCI index. QUAL is not sponsored, endorsed or promoted by MSCI, and MSCI bears no liability with respect to QUAL or the MSCI Index. The PDS contains a more detailed description of the limited relationship MSCI has with VanEck and QUAL