Quality investing for INVESTCON 5
According to billionaire investor Howard Marks, markets are currently at “INVESTCON 5”. In these conditions, we think quality companies may offer a solution.
Given near record-low tight spreads, equity markets have ridden the wave of relatively cheap credit and leverage. Many companies have risen with the market irrespective of their fundamentals.
Throughout the past year, it has not been uncommon to read an industry expert explain that equity valuations are stretched, and yet the S&P 500 has risen over 17% in the last 12 months (to 31 July 2025).
Last weekend, Howard Marks was the latest when he released his memo, The Calculus of Value. Marks introduced the concept of INVESTCONs (Investment Readiness Conditions), echoing the Pentagon’s DEFCON (Defence Readiness Condition), as a way of dealing with the markets’ continued appreciation and apparent optimism. Marks argues it is impossible to be so certain about markets to implement INVESTCON 3, 2 or 1 – that is, remain invested, “because “overvaluation” is never synonymous with “sure to go down soon,” it’s rarely wise to go to those extremes.”
Marks suggests,”… it’s time for INVESTCON 5.” INVESTCON 5 is: Reduce aggressive holdings and increase defensive holdings.
We think, for international equity investors, if they do choose to open the INVESTCON 5 envelope, the code inside could be QUAL. QUAL aims to target the quality factor, and it has historically been associated with defence.
There are a few reasons to consider INVESTCON 5. Credit spreads on investment-grade and high-yield bonds are at near-decade lows.
Chart 1: Corporate credit spreads
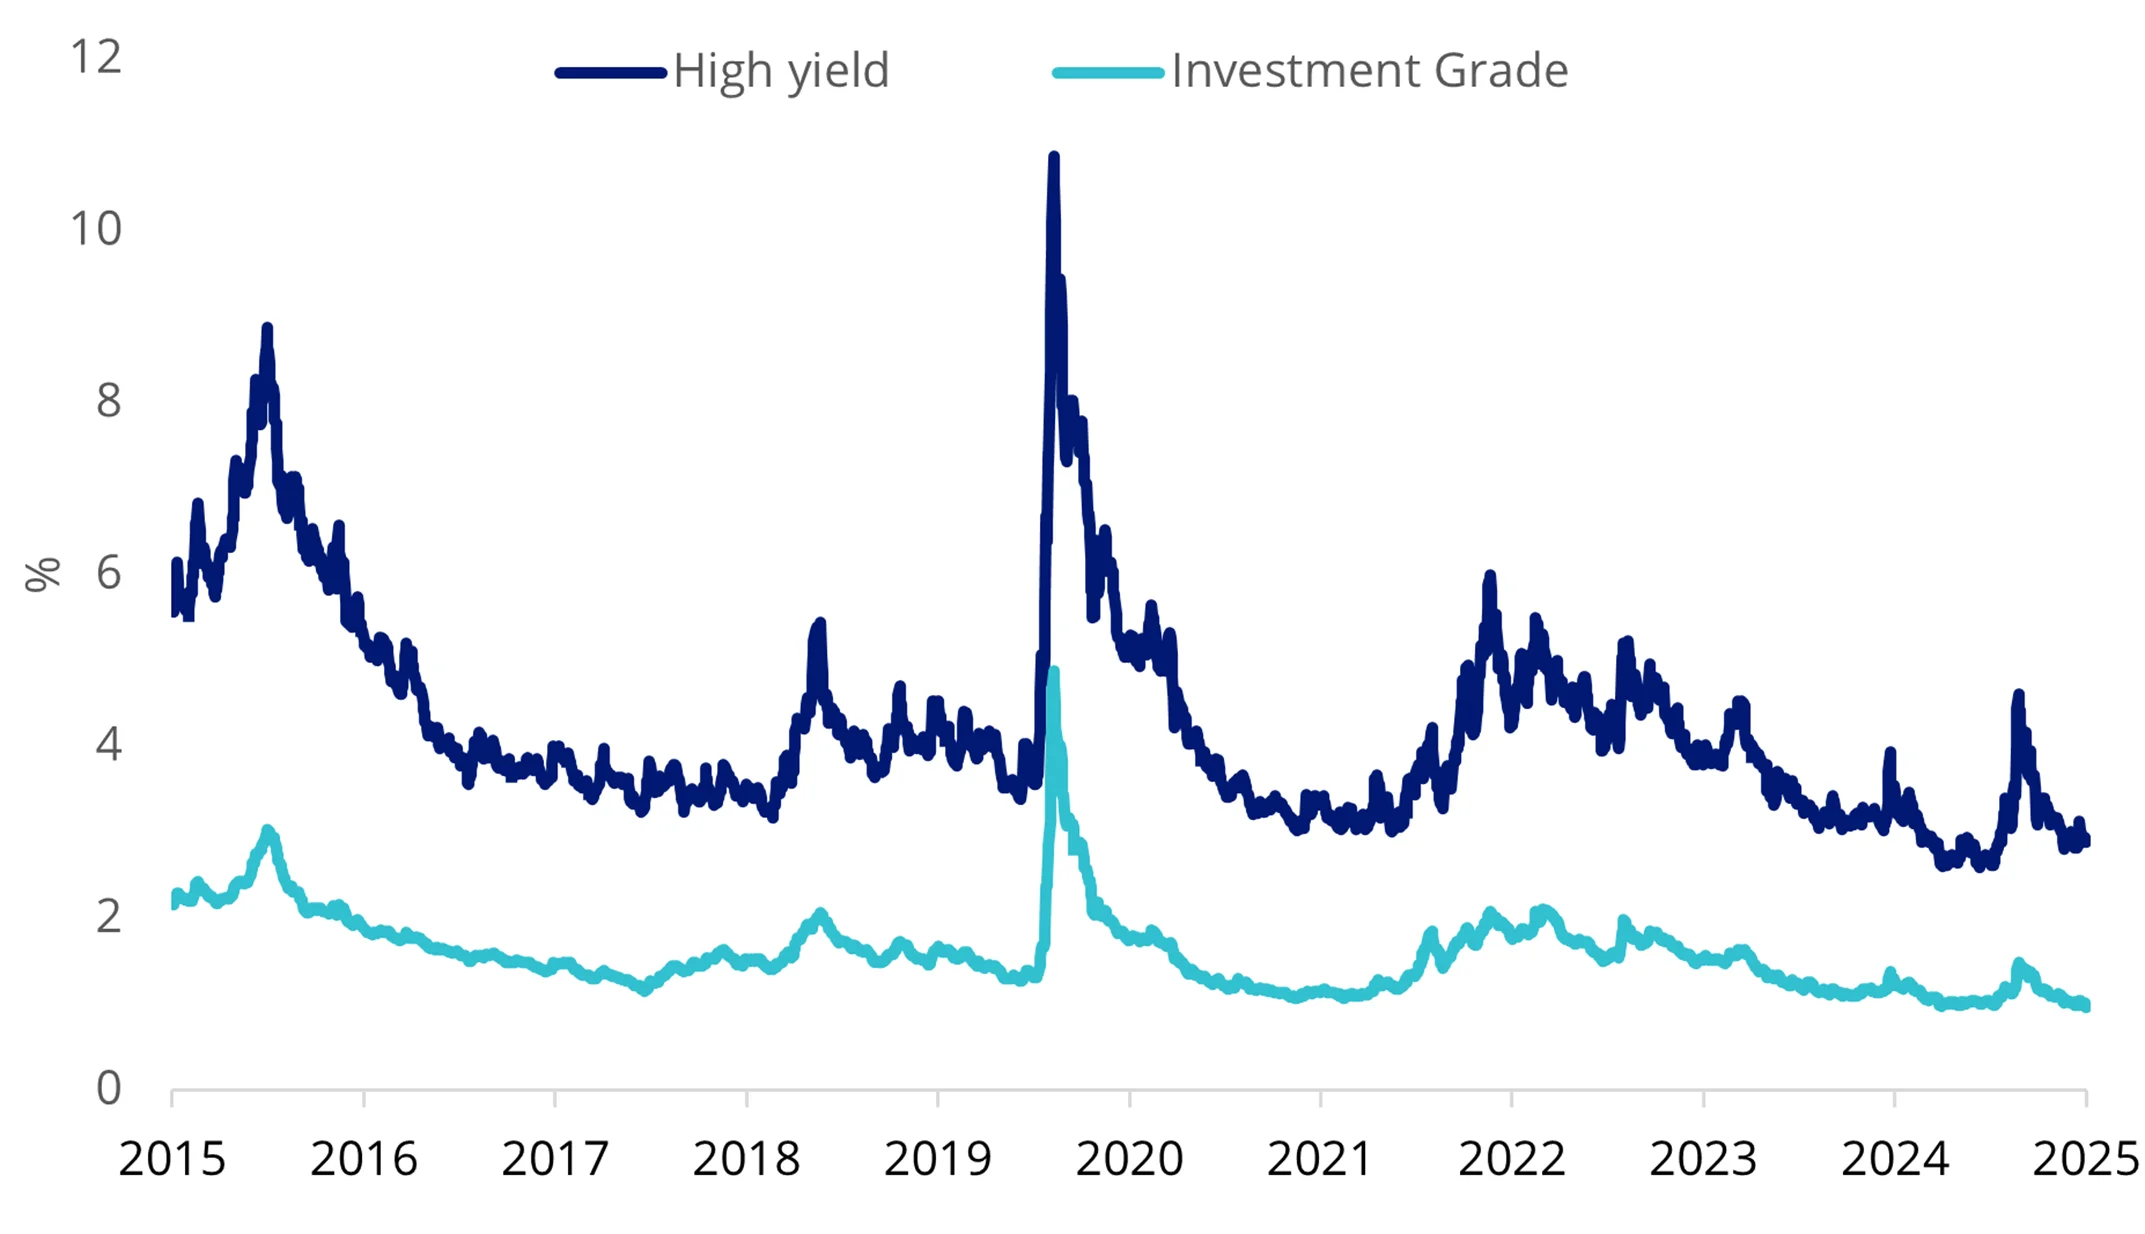
Source: Bloomberg, ICE. Investment grade is ICE BofA BBB US Corporate Index Option-Adjusted Spread, High yield is ICE BofA US High Yield Index Option-Adjusted Spread. You cannot invest in an index.
Spreads typically widen when volatility in markets increases. Many potential outcomes on the horizon could result in a spike in volatility. These include an increase in inflation (tariff-induced?), a geopolitical episode, an unforeseen default or liquidity crisis, or continued labour market weakness.
At the same time as spreads have been tightening, the share prices of companies with ‘negative earnings’ have been skyrocketing. The Goldman Sachs Non-Profitable Technology Index, often referred to as the ‘negative earnings’ company index, rose from a low in mid-April to multi-year highs in July 2025. It has since bounced, but the end of July falls, coinciding with poor US labour market numbers, should give investors time for pause.
If timing a crisis is shy of genius, then picking the next global mega tech is beyond brilliant. There is no doubt that some of the stocks in the Goldman Sachs Non-Profitable Technology Index will become profitable and successful. But many will not.
Think about the longest bull market in history following the GFC - those tech companies that drove the market’s returns were Apple, Alphabet, Microsoft and Facebook, companies with stable earnings and that weren’t burdened with debt. These are quality companies.
The more recent AI momentum has been driven by chip makers NVIDIA, ASML and Qualcomm. Again, quality companies.
Chart 2: The Goldman Sachs Non-Profitable Technology Index

Source: Goldman Sachs, Bloomberg, Three years to 18 August 2025. Cumulative figure from start date in 10 September 2014. The calculations for the above include the reinvestment of all dividends but do not include fees and other costs with an investment. You cannot invest in an index. Past performance is not a reliable indicator of future performance.
Volatility and quality
In the past, the quality factor has outperformed during periods of heightened volatility.
You may have heard the phrase ‘flight to quality’. This occurs when market risks are pronounced, and investors choose quality over non-quality assets to manage the storm. Over the past 30 years, you can see flights to quality in action. The index that QUAL tracks, the MSCI World ex Australia Quality Index (Quality Index), has been calculated by MSCI back to 1994, so its history includes the volatility spikes of the dotcom bubble, the GFC and the recent COVID crisis. In the chart below, when the dark blue line is rising, quality is outperforming. You can see that in each of the previous times the volatility index (VIX) has spiked significantly, quality has outperformed. It has also outperformed since Liberation Day.
Chart 3: Outperformance in times of volatility: Global quality equities versus equity market volatility
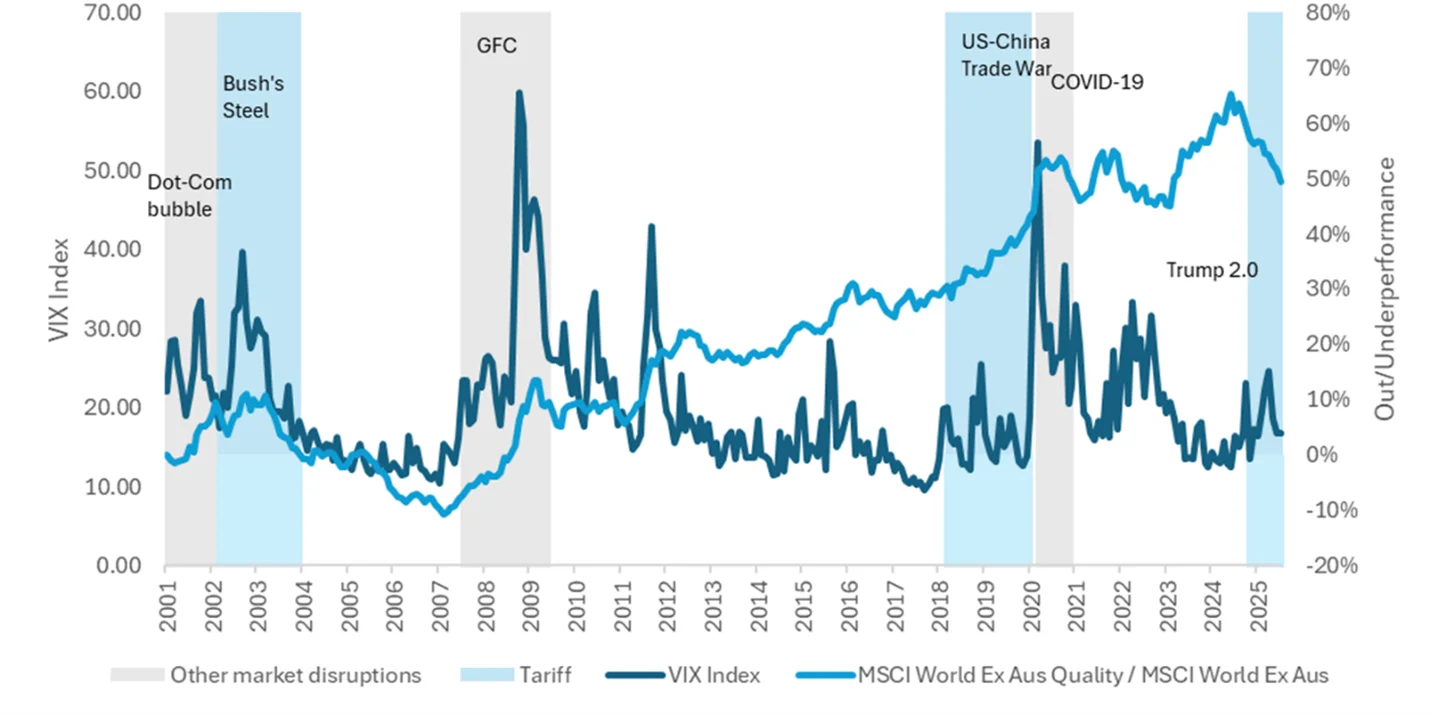
Source: VanEck Australia, Bloomberg. Data to 31 July 2025. Performance in AUD. Past performance is not a reliable indicator of future performance. Index performance is not illustrative of fund performance. You cannot invest in an index.
Quality may outperform
While the tight rate environment has encouraged companies to take on more risk, economic growth among developed countries isn’t matching equity market enthusiasm. The US jobs numbers, while now in the rear-view mirror, loom large. The numbers give the US Federal Reserve a reason to cut rates at its next meeting, but a rate cut is not going to stimulate high growth immediately. Economic growth for the rest of 2025 is still expected to be low. In a low growth environment, companies that traditionally do well have the following characteristics:
- Value creating return on equity (ROE) – a ROE above 15%;
- Sustainable earnings – demonstrated across multiple business cycles; and
- Strong balance sheets – gearing ratios ~50% with strong net cash positions.
Charts 4 & 5: Quality Index characteristics
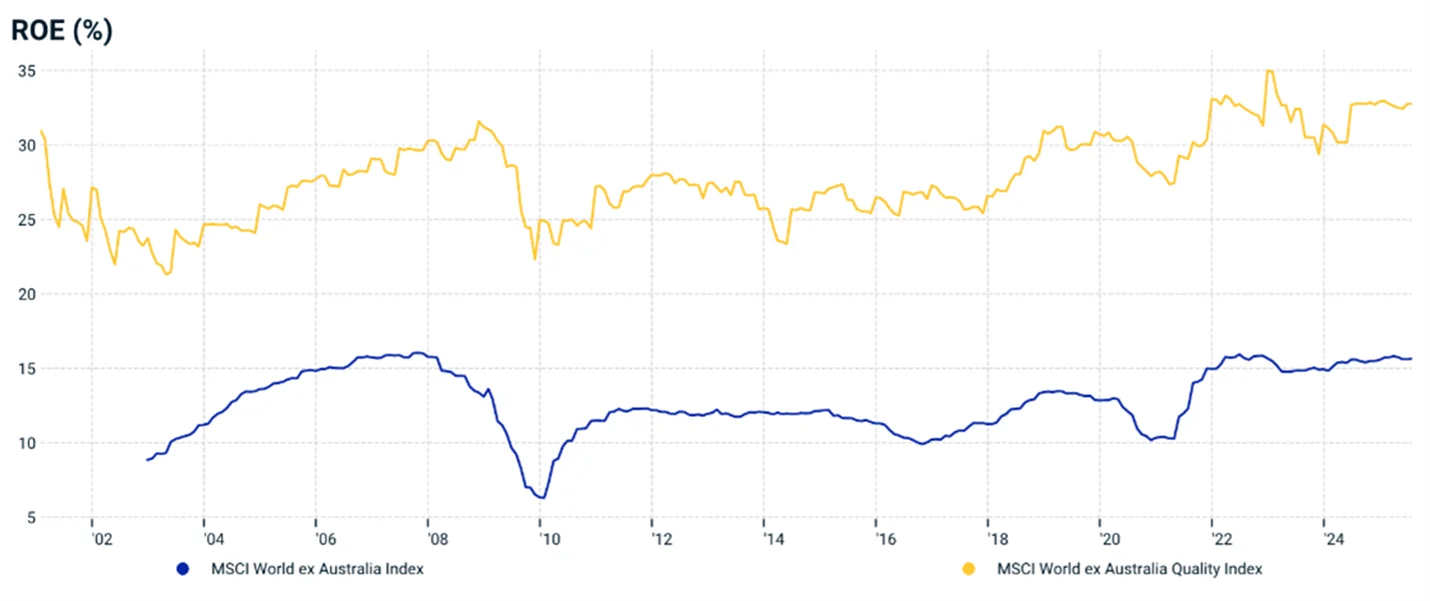
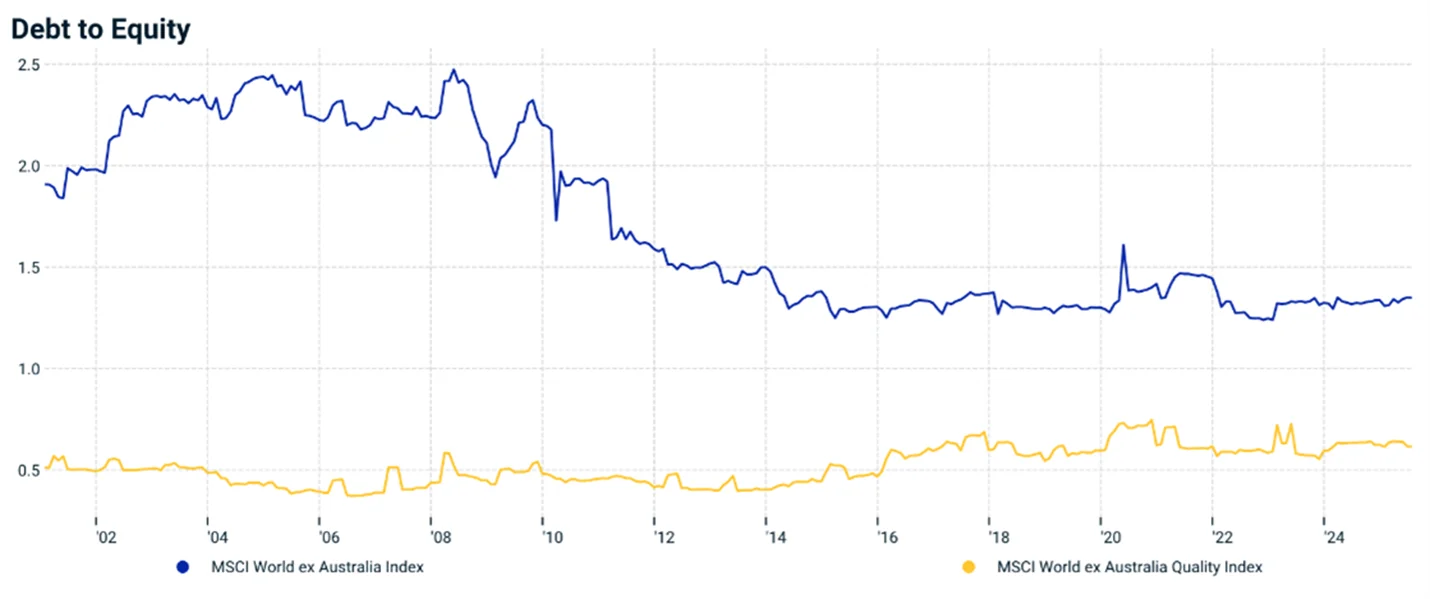
Source: MSCI, 31 December 1998 to 31 July 2025. Return on equity at an index level, calculated using the index earnings divided by the index book value, At an index level, Leverage is the sum of the most recent book value of common equity plus preferred equity plus long-term debt, divided by book value of common equity. This is free-float market capitalisation weighted. The MSCI World ex Australia Index (“MSCI World ex Aus”) is shown for comparison purposes as it is the widely recognised benchmark used to measure the performance of developed market large- and mid-cap companies, weighted by market capitalisation. QUAL’s index measures the performance of 300 companies selected from MSCI World ex Aus based on MSCI quality scores, weighted by market cap x quality score at rebalance. Consequently QUAL’s index has fewer companies and different country and industry allocations than MSCI World ex Aus. Click here for more details.
QUAL tracks the Quality Index that only includes the 300 highest quality scoring stocks determined by MSCI based on three identifiable financial characteristics:
- High ROE;
- Stable year-on-year earnings growth; and
- Low financial leverage.
In the case of quality international companies, there are still reasons to be optimistic.
Some analysts suggest the momentum in AI could continue, especially as “not-as-bad-as-anticipated” tariff outcomes continue to be announced. The market reacted positively to NVIDIA being able to distribute its H20 chips into China (and rumours of the B30A chip getting approval). On the other side of the coin, there are still many unknowns regarding Trump’s tariffs, likely impromptu changes and other new levies. If the tariffs lead to inflationary shocks or a credit event, it’s likely to weigh on markets.
There are arguments for INVESTCON 5, but there are also reasons to remain optimistic.
Performance in bull and bear markets
Over the long term, the Quality Index has demonstrated outperformance1. Notably, the Quality Index has significantly outperformed in previous down-market environments such as the GFC bear market and periods of low rates and low inflation, as the chart below shows.
Chart 6: Quality Index performance
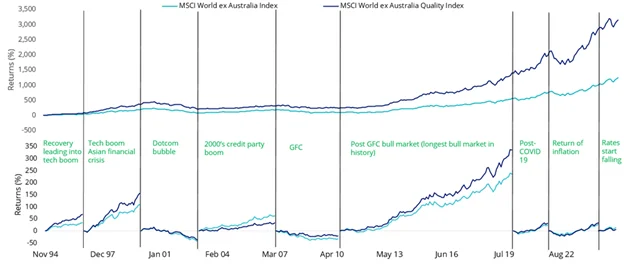
Source: Morningstar Direct, VanEck. 30 November 1994 – 31 July 2025 Source: VanEck, Morningstar Direct. The above graph is a hypothetical comparison of the performance of the Index and the parent index. Results are calculated to the last business day of the month and assume immediate reinvestment of all dividends and exclude costs associated with investing in the ETF. You cannot invest directly in the Index. The above performance information is not a reliable indicator of current or future performance of the indices or QUAL, which may be lower or higher. The MSCI World ex Australia Index (“MSCI World ex Aus”) is shown for comparison purposes as it is the widely recognised benchmark used to measure the performance of developed market large- and mid-cap companies, weighted by market capitalisation. QUAL’s index measures the performance of 300 companies selected from MSCI World ex Aus based on MSCI quality scores, weighted by market cap x quality score at rebalance. Consequently, QUAL’s index has fewer companies and different country and industry allocations than MSCI World ex Aus. Click here for more details.
For risk-aware investors, negative outcomes or the potential for losses are the ‘risks’ they consider. A measure called ‘drawdown’ is useful for investors to assess this risk. It demonstrates both the depth of a fall from a historical peak and the pace of the recovery to a new peak. The maximum drawdown is the distance from the highest peak to the deepest valley. Investments that fall less and recover faster are more desirable.
In the table below, we have highlighted the dot-com bubble, GFC and the COVID-19 market meltdown. In all these episodes, Quality International companies lost less and recovered faster. The table below compares the drawdowns of the Quality Index versus the market benchmark, MSCI World ex Australia Index.
Table 1: Significant drawdown events, 2000 to 2025
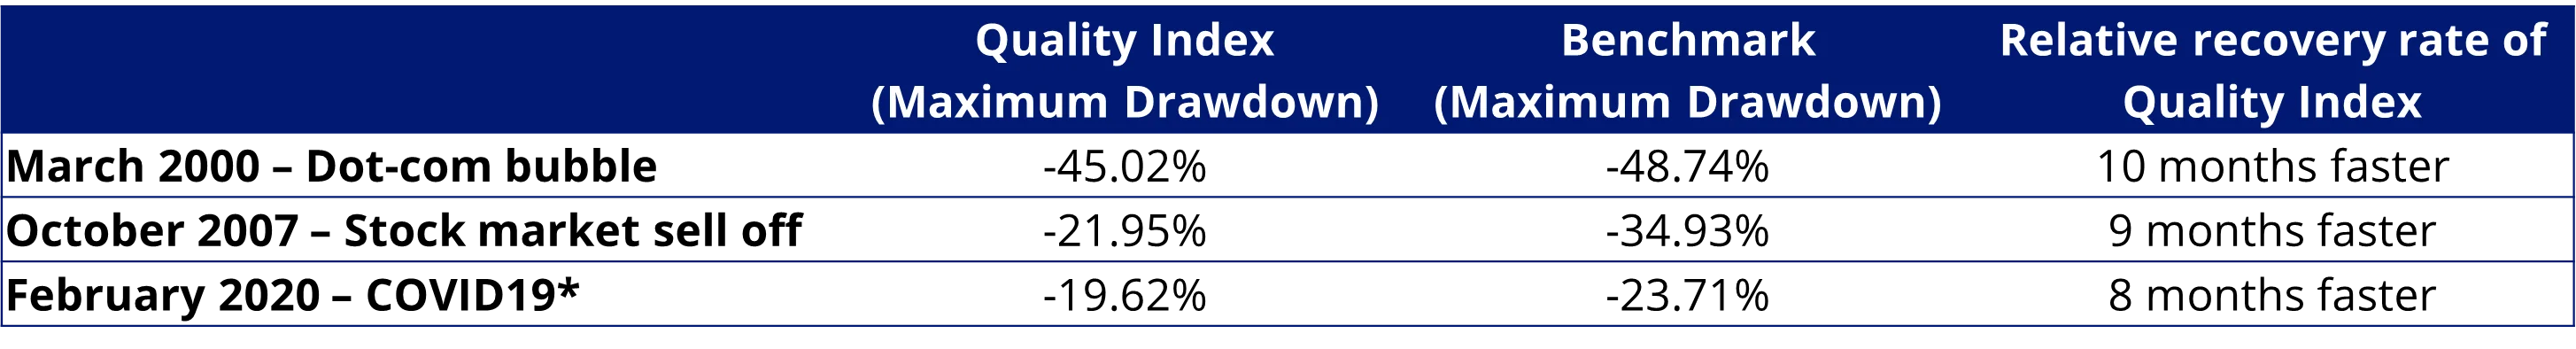
Source: MSCI, VanEck, Morningstar Direct. Comparison of drawdown between the MSCI World ex Australia Quality Index (‘Quality Index’) versus the MSCI World ex Australia Index (‘Benchmark’). Maximum drawdown is the peak to trough decline from the start of the month specified to the recovery date, expressed as a percentage. The rate of recovery is the number of periods taken to recover from the trough to peak incline. The calculations for the above include the reinvestment of all dividends but do not include fees and other costs associated with an investment in QUAL. You cannot invest in an index. Past performance is not a reliable indicator of future performance of the index or QUAL.
Whether you are bearish and considering INVESTCON 5, we think it’s important to stay diversified and invested.
The best offence, we think, is a good defence.
Within VanEck’s Quality-factor family we also have the following ETFs:
- International A$ hedged – VanEck MSCI International Quality (AUD Hedged) ETF (QHAL)
- International small companies - VanEck MSCI International Small Companies Quality ETF (QSML)
- International small companies A$ hedged - VanEck MSCI International Small Companies Quality (AUD Hedged) ETF (QHSM)
For more information on the Quality factor, click here.
Key risks: An investment in the Funds carry risks associated with: ASX trading time differences, financial markets generally, individual company management, industry sectors, foreign currency, hedging (QHAL, QHSM), country or sector concentration, political, regulatory and tax risks, fund operations and tracking an index. See the PDS and TMD for more details.


Published: 03 September 2025
Any views expressed are opinions of the author at the time of writing and is not a recommendation to act.
VanEck Investments Limited (ACN 146 596 116 AFSL 416755) (VanEck) is the issuer and responsible entity of all VanEck exchange traded funds (Funds) trading on the ASX. This is general advice only and does not take into account any person’s financial objectives, situation or needs. The product disclosure statement (PDS) and the target market determination (TMD) for all Funds are available at vaneck.com.au. You should consider whether or not any Fund is appropriate for you. Investments in a Fund involve risks associated with financial markets. These risks vary depending on a Fund’s investment objective. Refer to the applicable PDS and TMD for more details on risks. Investment returns and capital are not guaranteed.