The flight to quality is now boarding
The protectionist policies implemented by President Trump have had an immediate impact on markets when they were announced. Earlier this month, when Trump declared he would impose an additional 100% tariff on Chinese goods from 1 November in response to what he called "extraordinarily aggressive" new export curbs on China's rare-earth industry, volatility spiked. You can also see it spiked after ‘liberation day’ earlier in the year.
These are volatility levels not seen since the COVID lockdowns.
Chart 1: Market Volatility Index
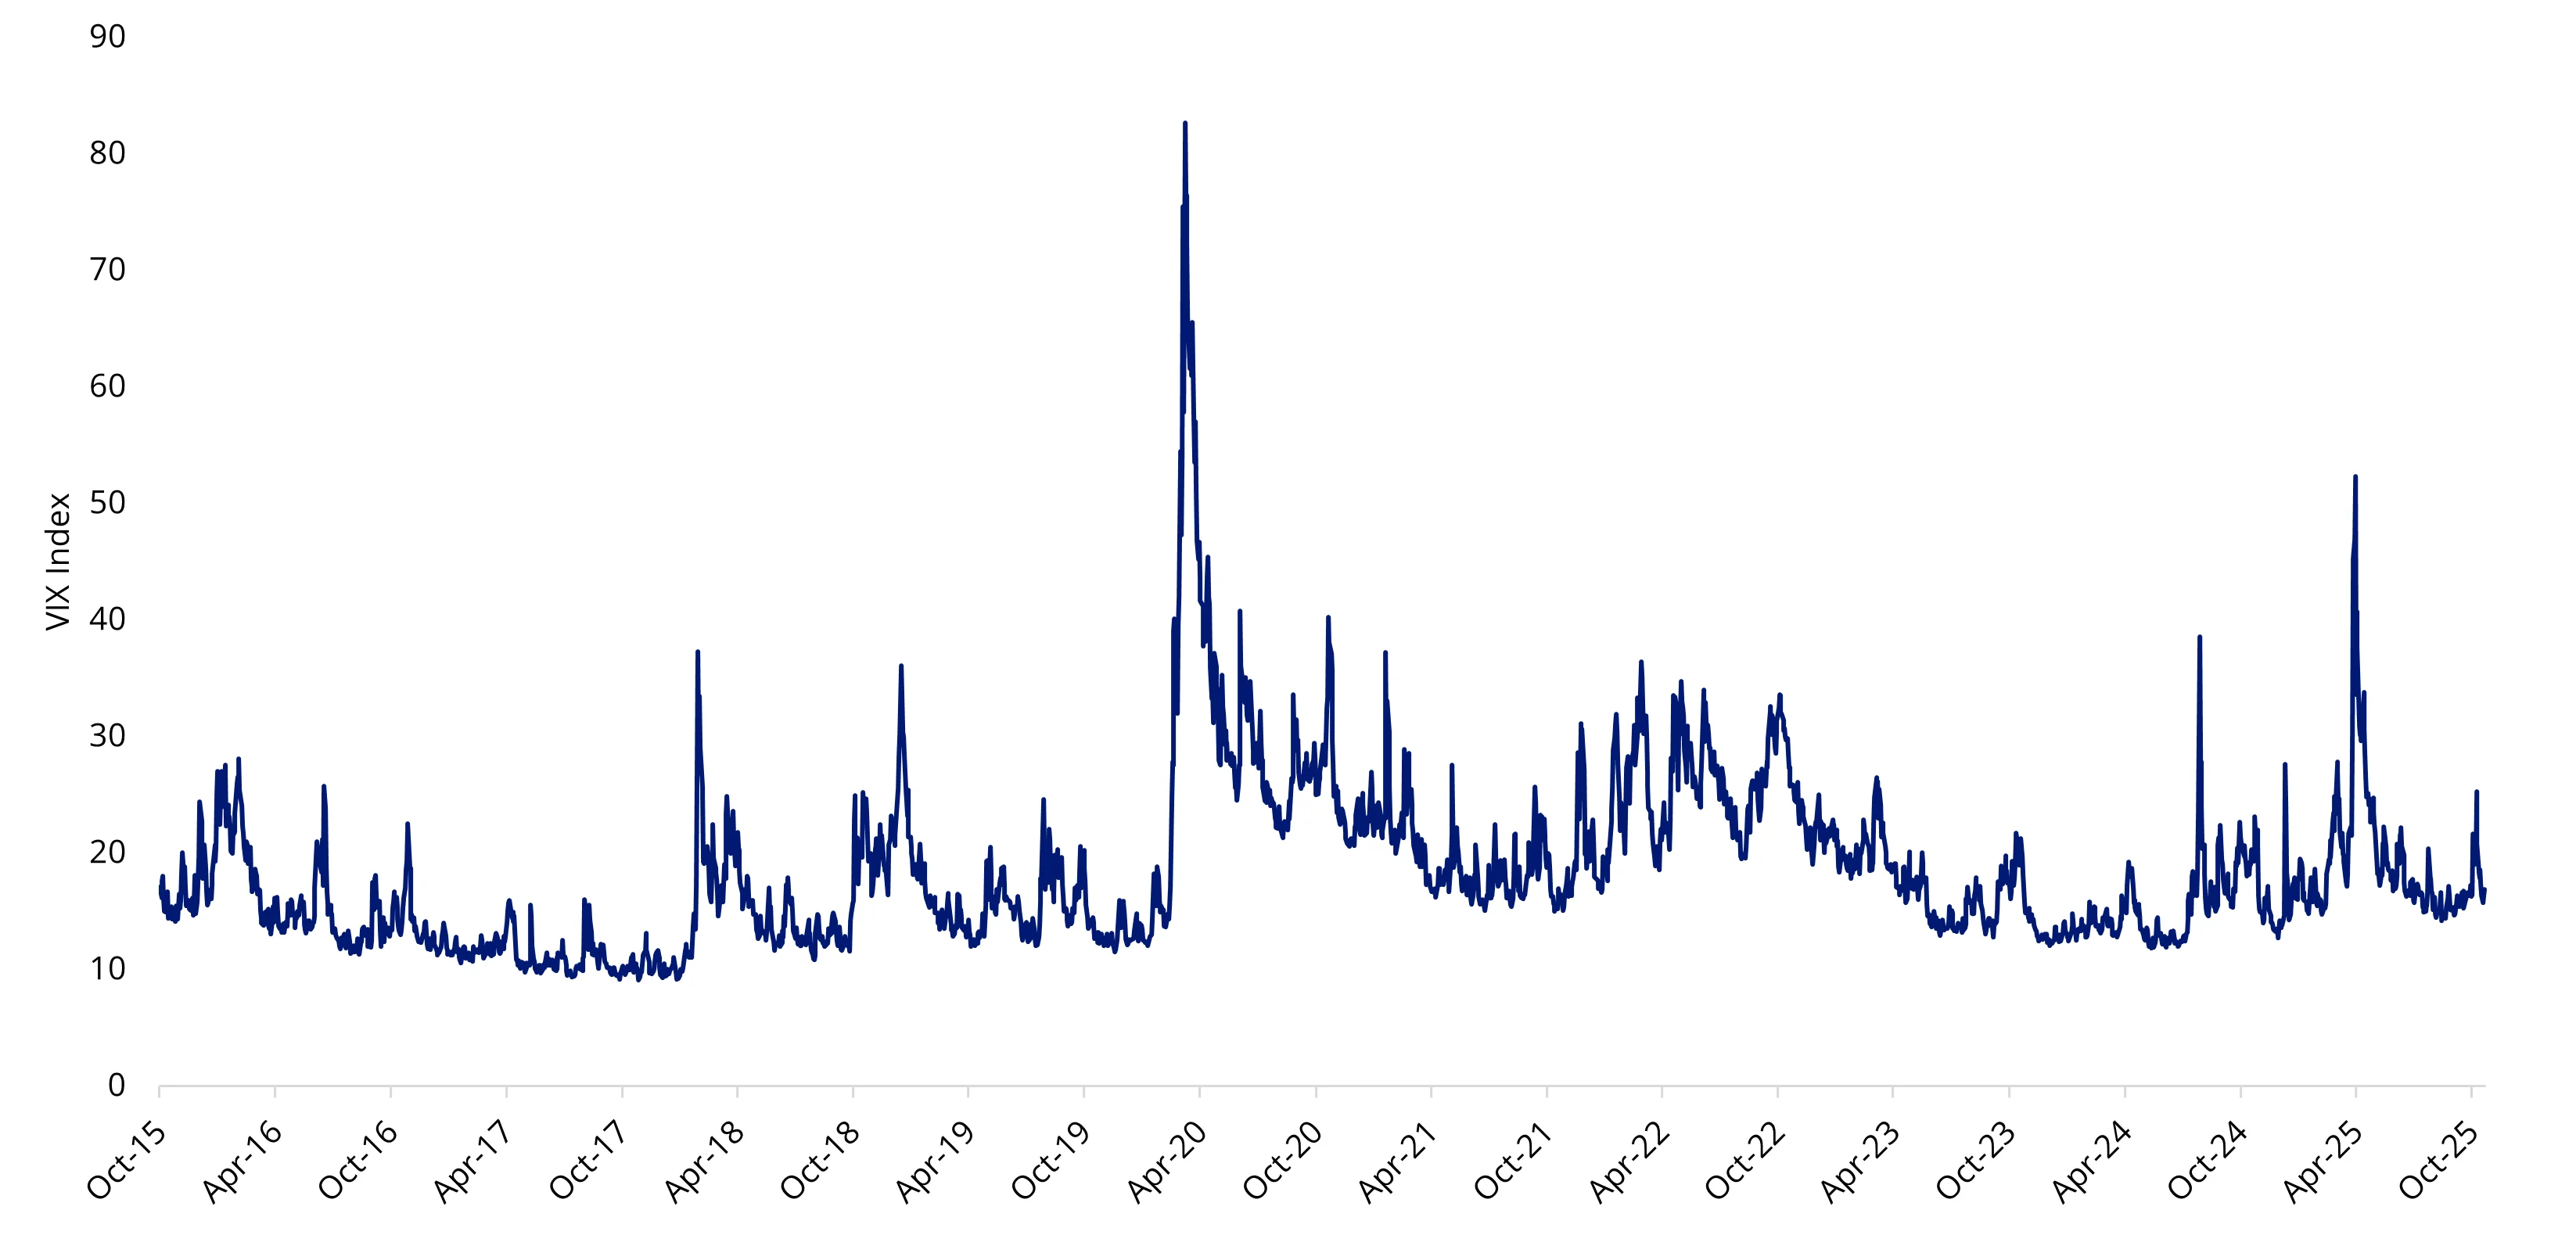
Source: Bloomberg. 10 years to 30 October 2025. Index is VIX Index.
It’s worth noting that when spikes of the magnitude experienced earlier this month occur, volatility rarely dissipates immediately; rather, it typically takes a while for it to ease. This is because, while the outcome of the trade wars is not known, we do know that tariffs have the impact of raising prices, which in turn slows spending.
In our last ViewPoint, The selective path, we explained that the evidence indicated the costs of the anti-China tariffs in the trade war during Trump’s first Presidency were borne by US companies and US consumers (over 90%). And so far, at least, with the latest round of tariffs, the evidence is no different.
The other dynamic in the US is its labour force, and the numbers recently have not been strong.
An economic slowdown is predicted. The Fed cut rates for the second time this year in late October. They did this to help the economy, despite high inflation. What this means, we think, is that we are headed for a period of equity market volatility, as participants confront the impact of rising inflation and economic weakness.
The ‘flight to quality’
In the past, the quality factor has outperformed during periods of heightened volatility and periods of stagflation.
You may have heard the phrase ‘flight to quality’. This occurs when market risks are pronounced and investors choose quality over non-quality assets to manage the storm. Over the past 30 years, you can see flights to quality in action. The index that VanEck MSCI International Quality ETF (QUAL) tracks, the MSCI World ex Australia Quality Index, has been calculated by MSCI back to 1994, so its history includes the volatility spikes of dotcom, the GFC and the recent COVID crisis. In the chart below, when the light blue line is rising, quality has outperformed. You can see that in each of the previous times the volatility index (VIX) has spiked significantly, quality has outperformed. It has also outperformed since Liberation Day.
Chart 2: Outperformance in times of volatility: Global quality equities versus equity market volatility
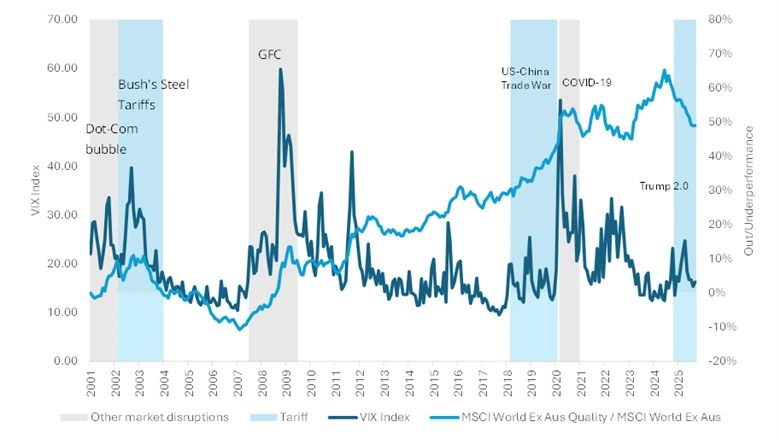
Source: VanEck Australia, Bloomberg. Performance in AUD, 1 Jan 2001 to 30 September 2025. Past performance is not a reliable indicator of future performance. Index performance is not illustrative of fund performance.
The market capitulations in 2000, 2008-2009 and 2020 were followed by economic slowdowns, with recessions following each of these stock market falls.
While not every pundit is calling a recession following Trump’s tariffs announcements and subsequent 90-day reprieve, a slowdown may be the base case.
Chart 3: Recession risk: US Recession Probability Forecast
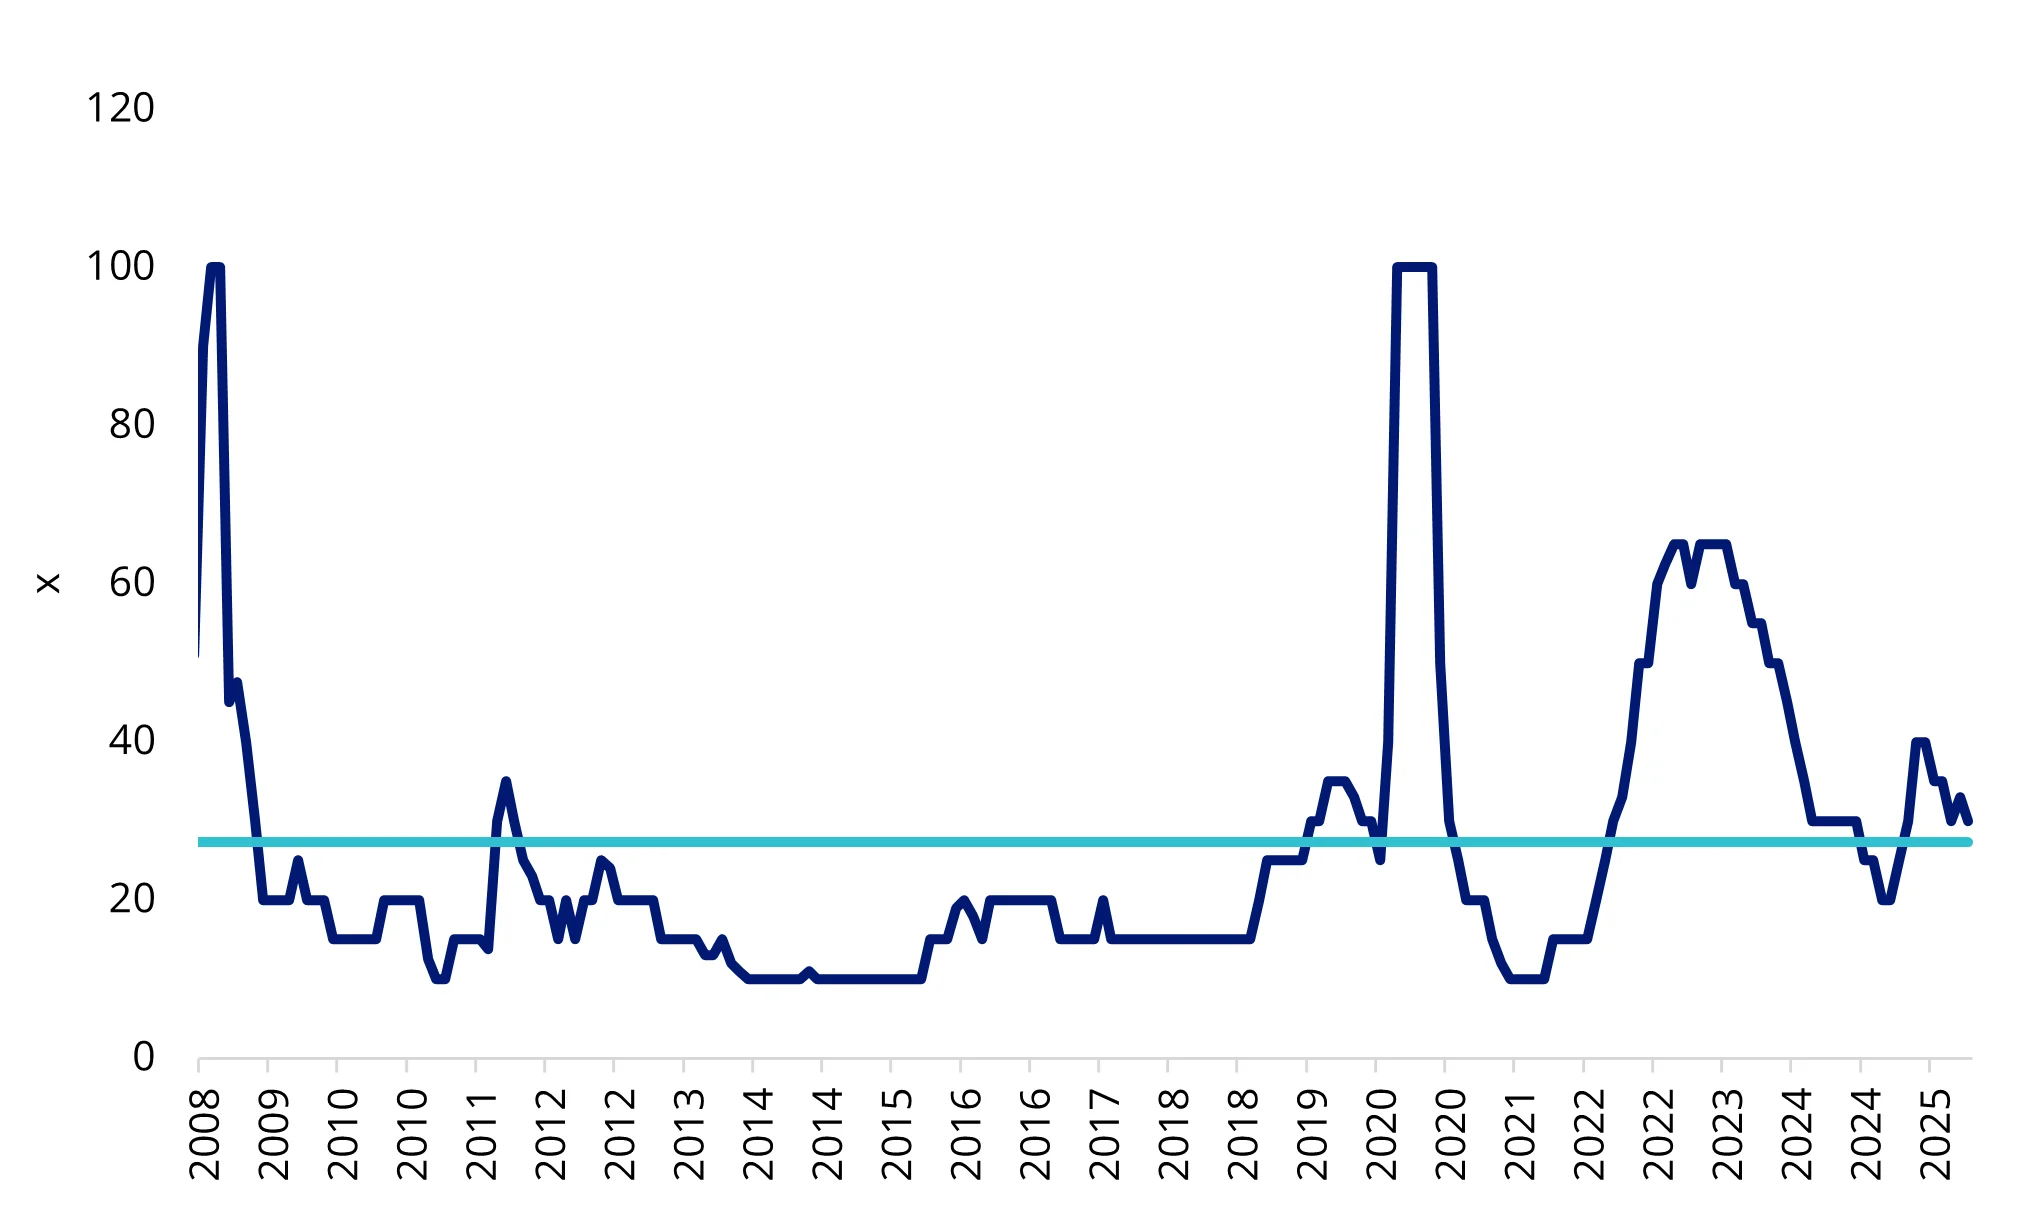
Source: Bloomberg, to 30 October 2025.
Historically, quality companies have lost less and recovered faster during periods associated with market falls and deteriorating economic conditions. In the table below, we have highlighted the dot-com bubble, GFC and the COVID-19 market meltdown. In all these episodes, quality international companies lost less and recovered faster. The table below compares the drawdowns of the MSCI World ex Australia Quality Index, versus the market benchmark, MSCI World ex Australia Index.
Table 1: Significant drawdowns events, 2000 to 2024
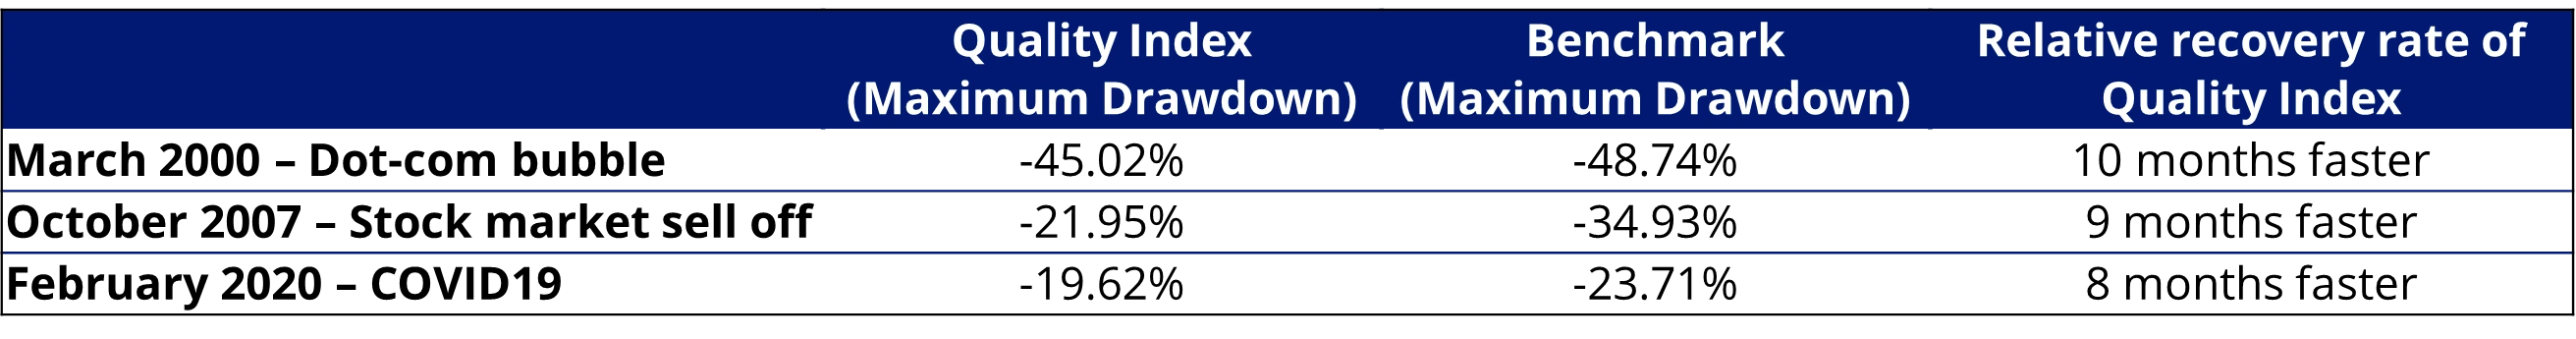
Source: MSCI, VanEck, Morningstar Direct. Comparison of drawdown between the MSCI World ex Australia Quality Index (‘Quality Index’) versus the MSCI World ex Australia Index (‘Benchmark’). Maximum drawdown is the peak to trough decline from the start of the month specified to the recovery date, expressed as a percentage. The rate of recovery is the number of periods taken to recover from the trough to peak incline. You cannot invest in an index. Past performance is not a reliable indicator of future performance of the index or QUAL.
If the global economy falters and we enter a recession, it could benefit quality companies, as they tend to offer investors relative protection during weaker economic environments and heightened market volatility.
QUAL has delivered long-term outperformance
Last week Qual had its 11th birthday on ASX. Since its inception on 29 October 2014 through to 29 October 2025, QUAL has returned 16.16% p.a., outstripping the MSCI World ex Australia Index, by 1.85% p.a. As always past performance is not a reliable indicator of future performance.
Chart 4: QUAL vs International Equity Index, from QUAL’s inception date to 29 October 2025
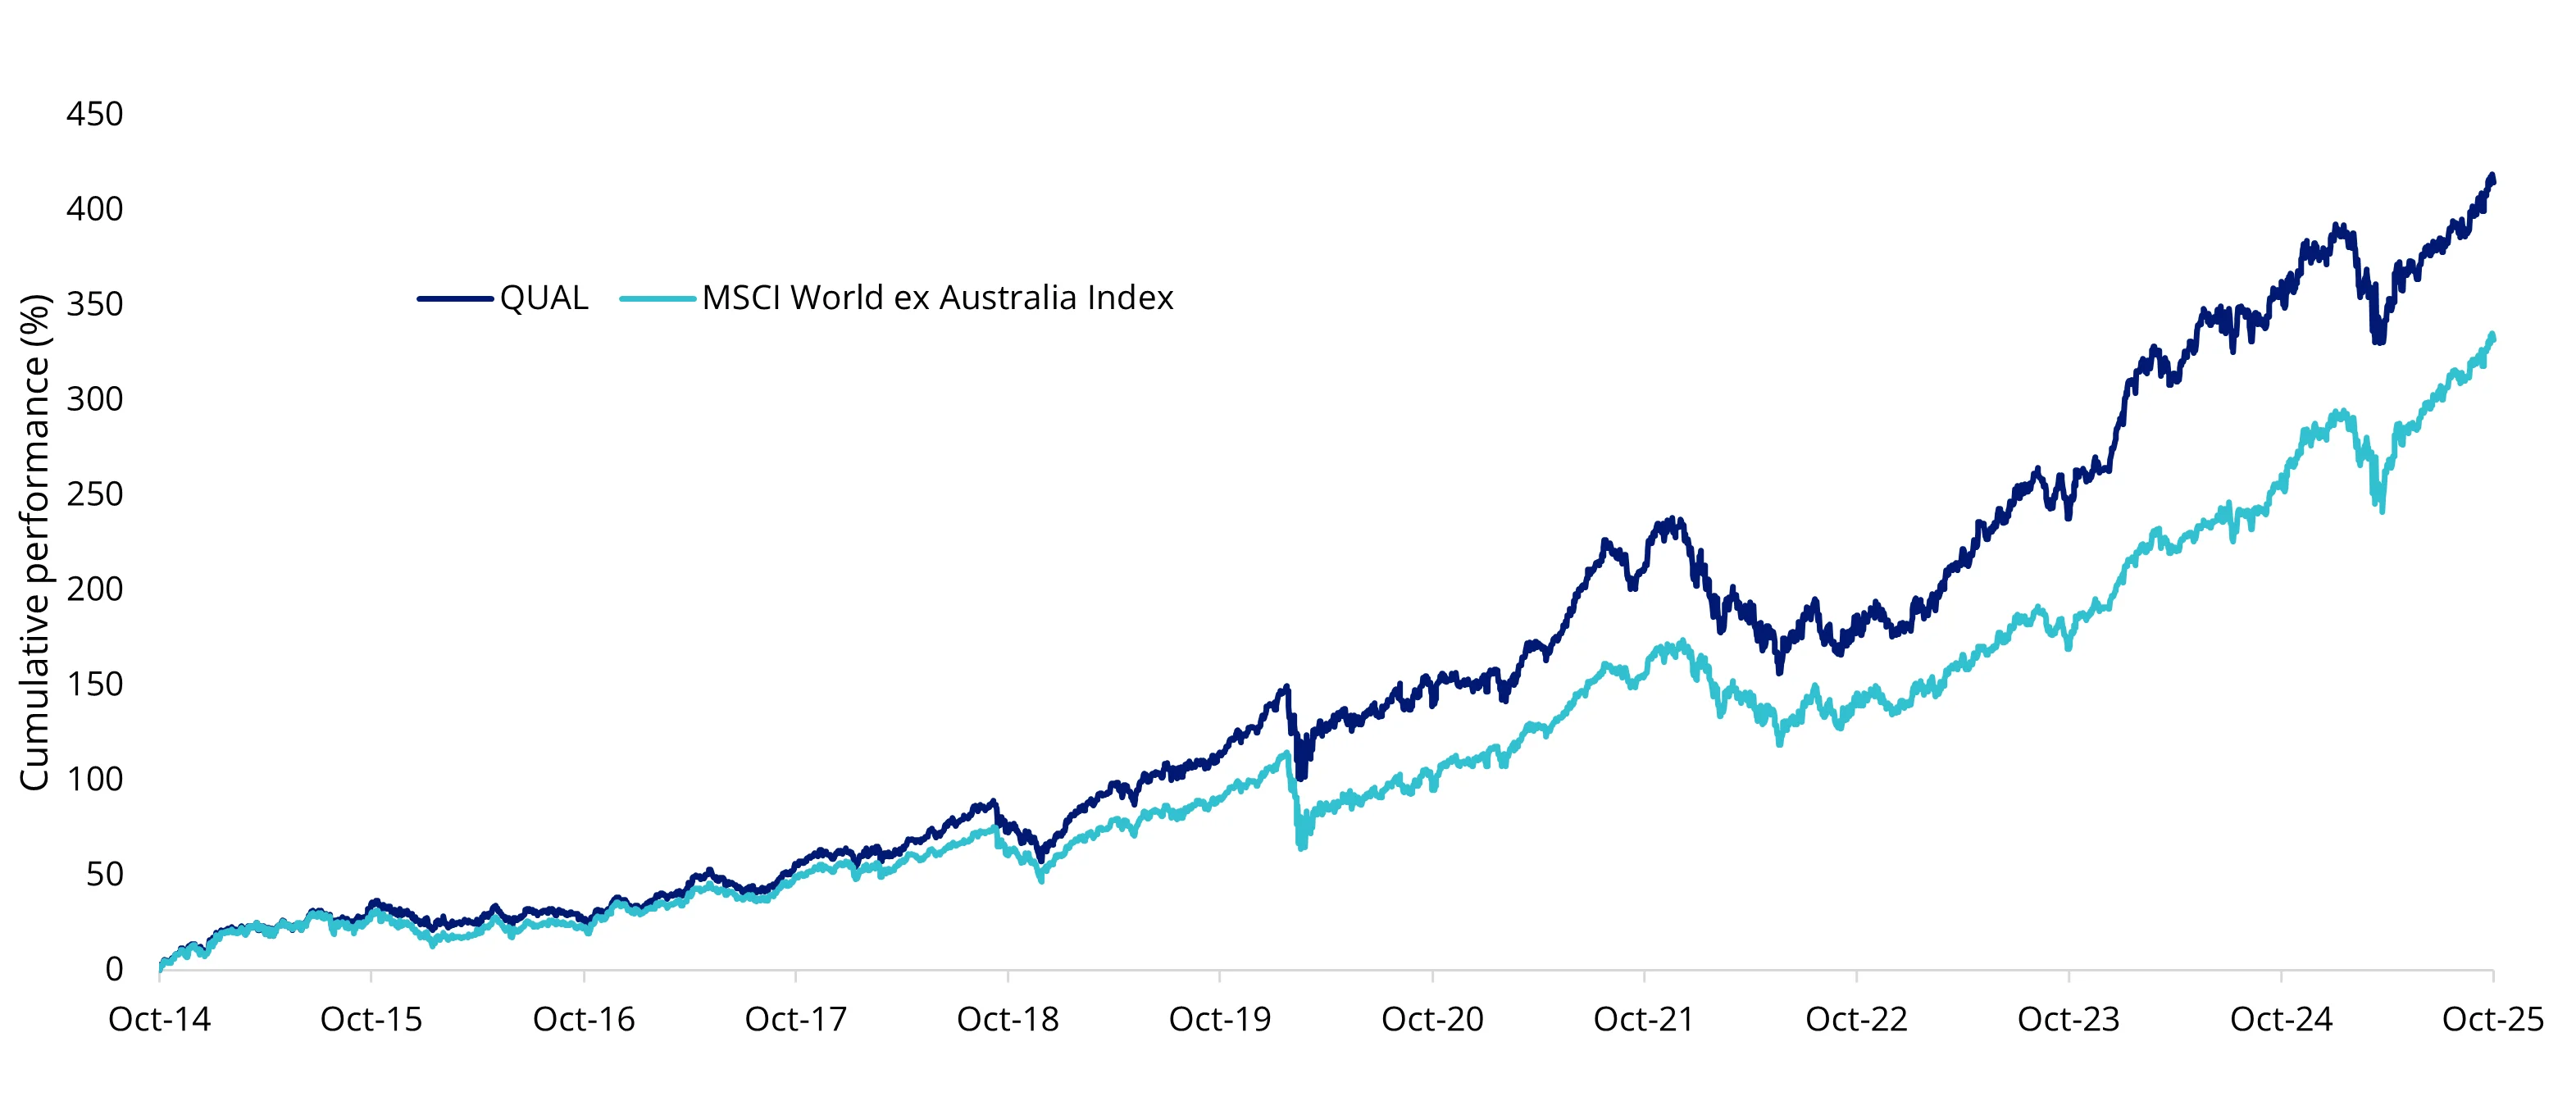
Table 2: Trailing performance to 29 October 2025
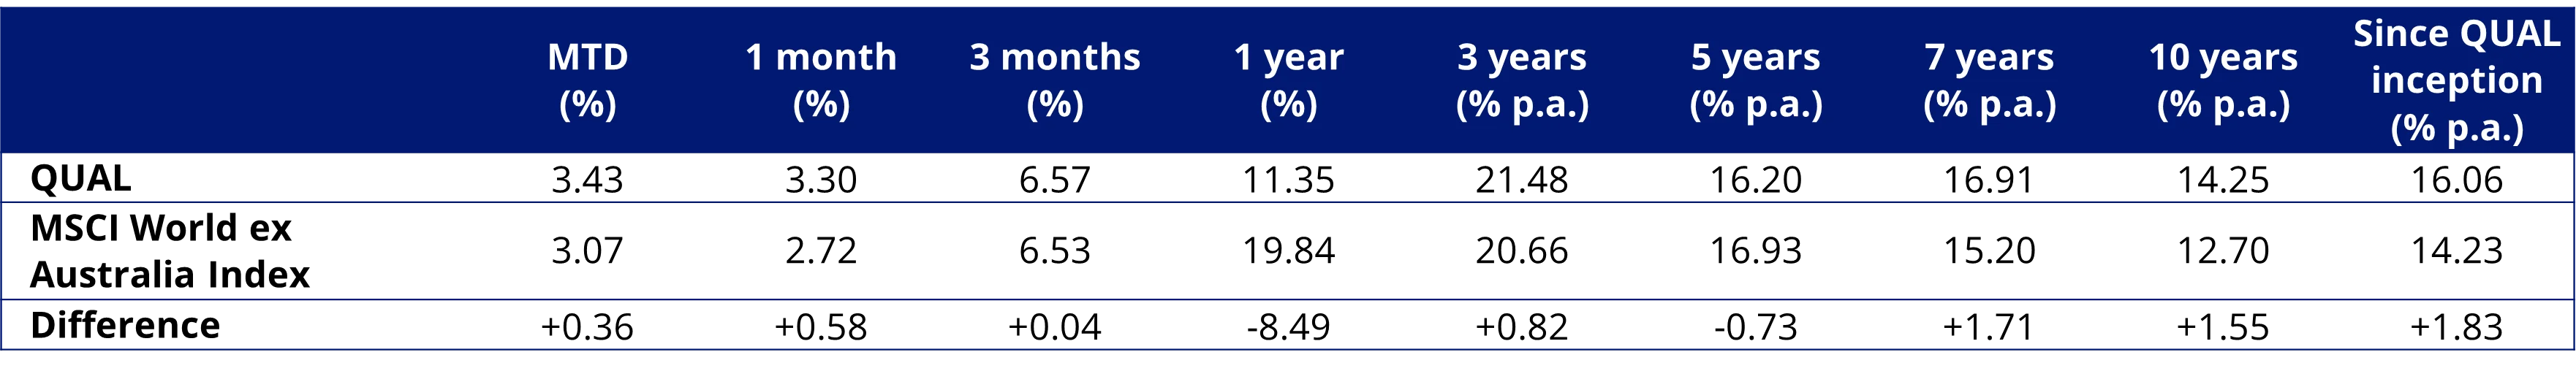
*Inception date is 29 October 2014
Chart 4 and Table 2 source: Morningstar Direct. The chart and table above show the past performance of QUAL and of the MSCI World ex Australia Index. You cannot invest directly in an index. Results are calculated to the last business day of the month and assume immediate reinvestment of distributions. QUAL results are net of management fees and other costs incurred in the fund, but before brokerage fees and bid/ask spreads incurred when investors buy/sell on the ASX. Returns for periods longer than one year are annualised. Past performance is not a reliable indicator of future performance. The MSCI World ex Australia Index (“MSCI World ex Aus”) is shown for comparison purposes, as it is the widely recognised benchmark used to measure the performance of developed market large- and mid-cap companies, weighted by market capitalisation. QUAL’s index measures the performance of 300 companies selected from MSCI World ex Aus based on MSCI quality scores, weighted by market cap x quality score at rebalance. Consequently, QUAL’s index has fewer companies and different country and industry allocations than MSCI World ex Aus. Click here for more details.
QHAL is an Australian dollar hedged version of QUAL so you can now also manage your desired currency exposure.
Key risks: An investment in the QUAL and QHAL carries risks associated with ASX trading time differences, financial markets generally, individual company management, industry sectors, foreign currency, currency hedging (QHAL), country or sector concentration, political, regulatory and tax risks, fund operations and tracking an index. See the PDS and TMD for details.
QUAL and QHAL are likely to be appropriate for a consumer who is seeking capital growth, is intending to use the product as a major, core, minor or satellite allocation within a portfolio, has an investment timeframe of at least 5 years, and a high risk/return profile.


Published: 29 October 2025
Any views expressed are opinions of the author at the time of writing and is not a recommendation to act.
VanEck Investments Limited (ACN 146 596 116 AFSL 416755) (VanEck) is the issuer and responsible entity of all VanEck exchange traded funds (Funds) trading on the ASX. This information is general in nature and not personal advice, it does not take into account any person’s financial objectives, situation or needs. The product disclosure statement (PDS) and the target market determination (TMD) for all Funds are available at vaneck.com.au. You should consider whether or not an investment in any Fund is appropriate for you. Investments in a Fund involve risks associated with financial markets. These risks vary depending on a Fund’s investment objective. Refer to the applicable PDS and TMD for more details on risks. Investment returns and capital are not guaranteed.