Three undervalued asset classes
If you think the market is overpriced, we think there are pockets of value. Here are three undervalued asset classes.
The euphoria around the strength of the US’ Magnificent 7 stocks and increasing hopes of avoiding recession in 2024 has taken the market by storm with the S&P 500 returning 24.69% over 12 months1. The standout has been chipmaker NVIDIA which surged following a substantial uplift in earnings guidance and excitement over the company’s broader involvement in the artificial intelligence (AI) revolution.
While strong performance is supported by a bounce back in earnings growth, share price growth has grown at a faster pace resulting in S&P 500 valuations reaching the upper bound of its historical average.
Chart 1: S&P 500 valuation z-score (12m forward PE, 12m forward PB, 12m forward PS, CAPE)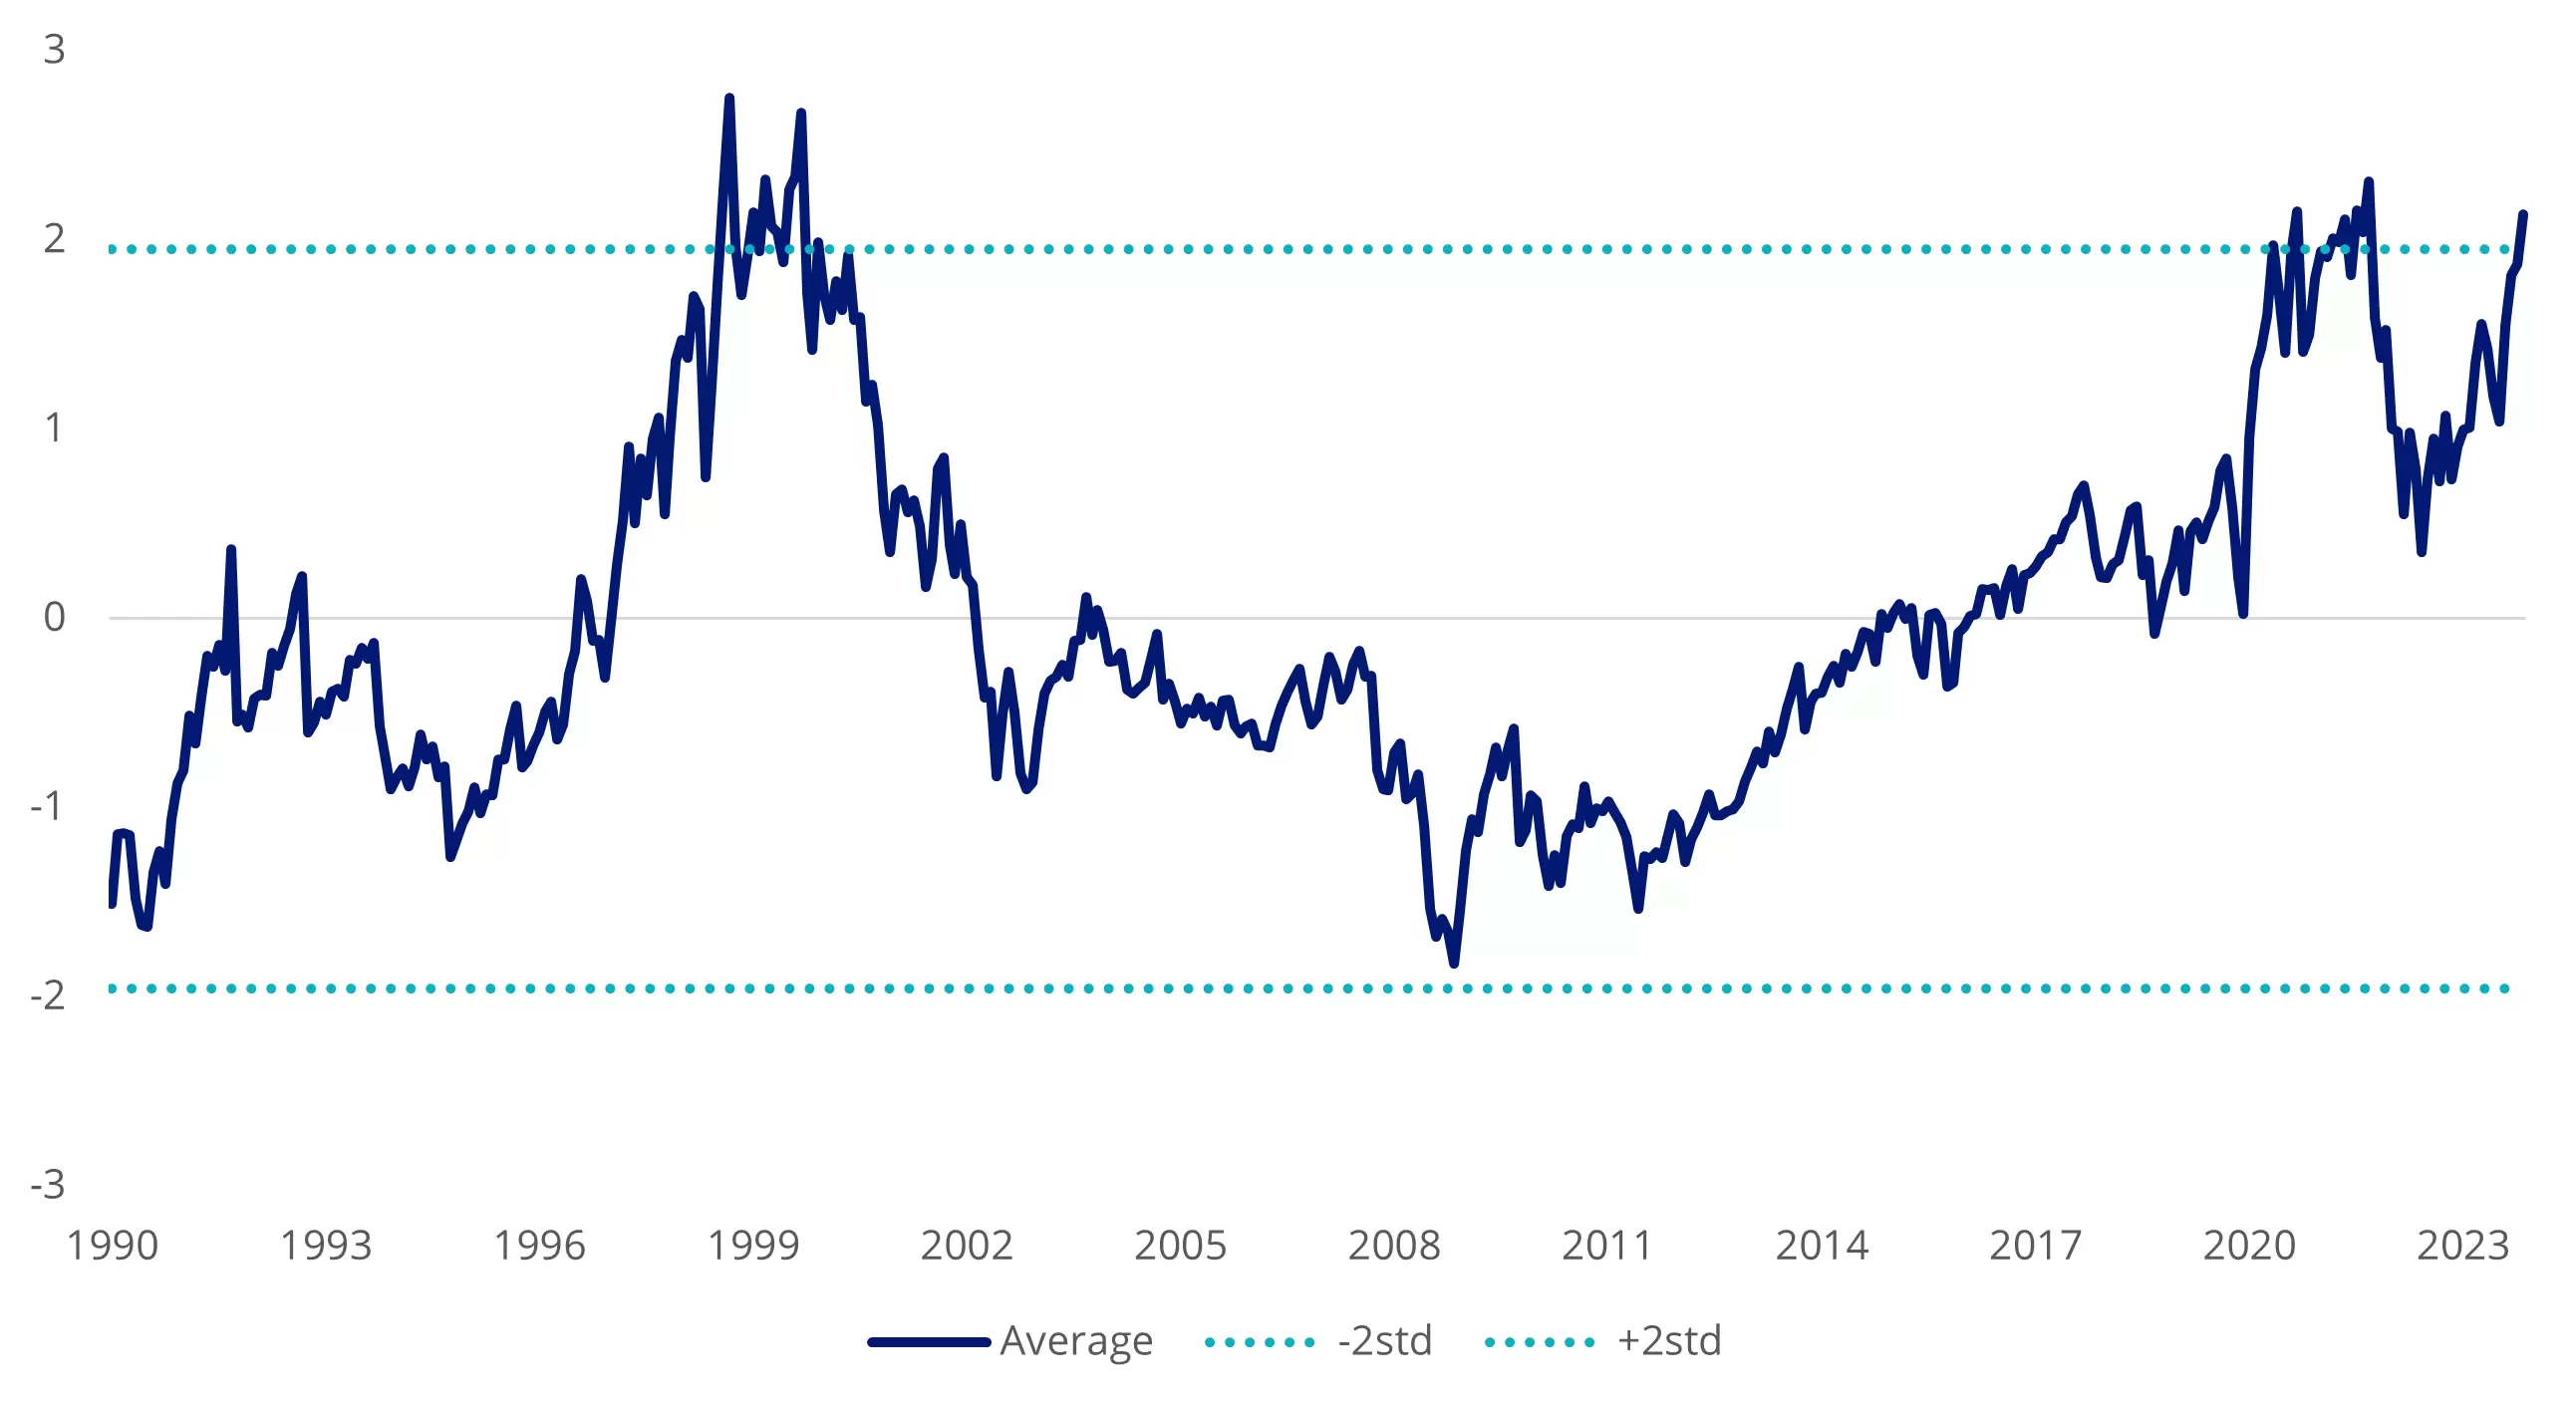
Source: Bloomberg, as at 16 February 2023.
Z-score quantifies how many standard deviations valuations are different to the historical average. The graph above shows the average z-score by 12 month forward price to earnings, 12 month forward price to book, 12 month forward price to sales. Latest value is 2 standard deviations above the historical average.
Investors seeking diversification away from US large caps to ‘undervalued’ asset classes should consider global small caps, china equities and listed private equity as they could be set to shine in 2024.
Undervalued asset class 1: Global small caps
The size premium, defined as investing in smaller market cap companies relative to their larger counterparts, has been shown to harvest excess returns relative to market beta. However, over the last 12 months, small caps have been overshadowed by the strength of the magnificent seven. Looking ahead, 2024 could be the year for global small caps for two reasons. Valuations are attractive. Global small-cap valuations relative to large caps are near 25-year lows. Global small cap valuation z-score is also below its historical average. If we do see a prolonged market recovery, small caps typically outperform large caps. Below is the cumulative performance of small caps versus large caps during previous market recoveries.
Chart 2: Global small less large cap valuation z-score (12m forward PE, 12m forward PB, 12m forward PS, CAPE)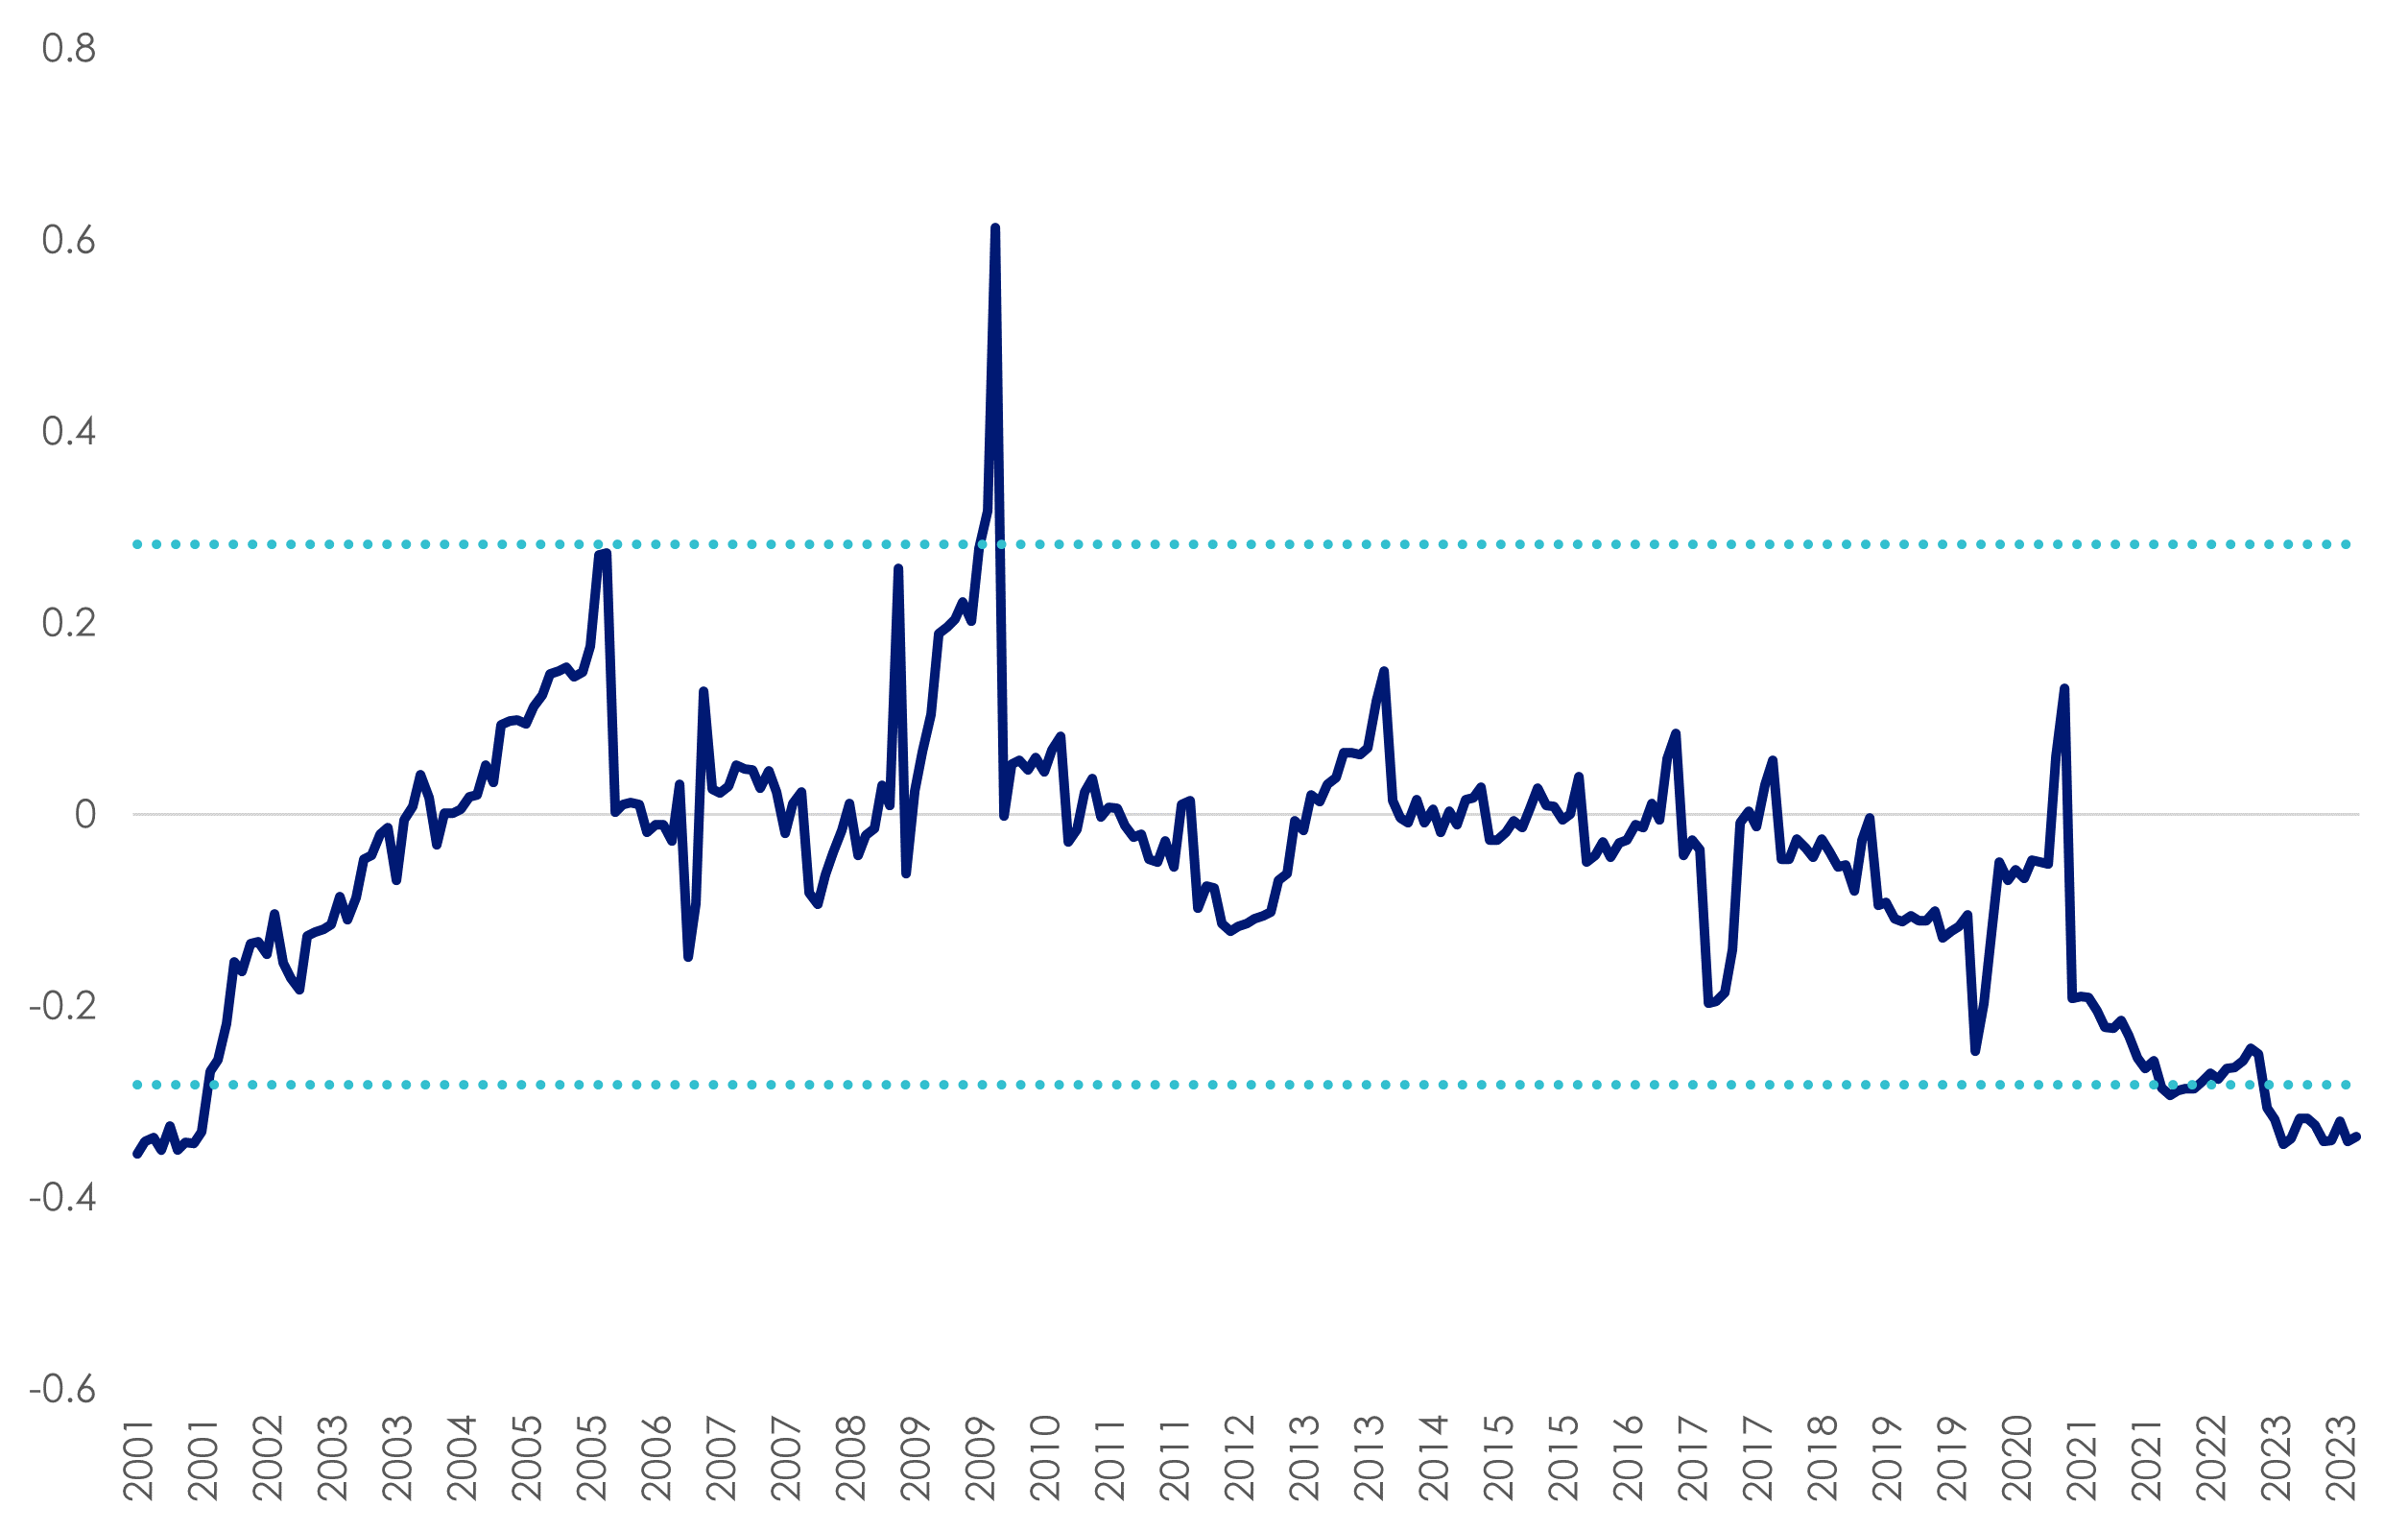
Source: Bloomberg, as at 19 February 2023.
Chart 3: Global small cap valuation z-score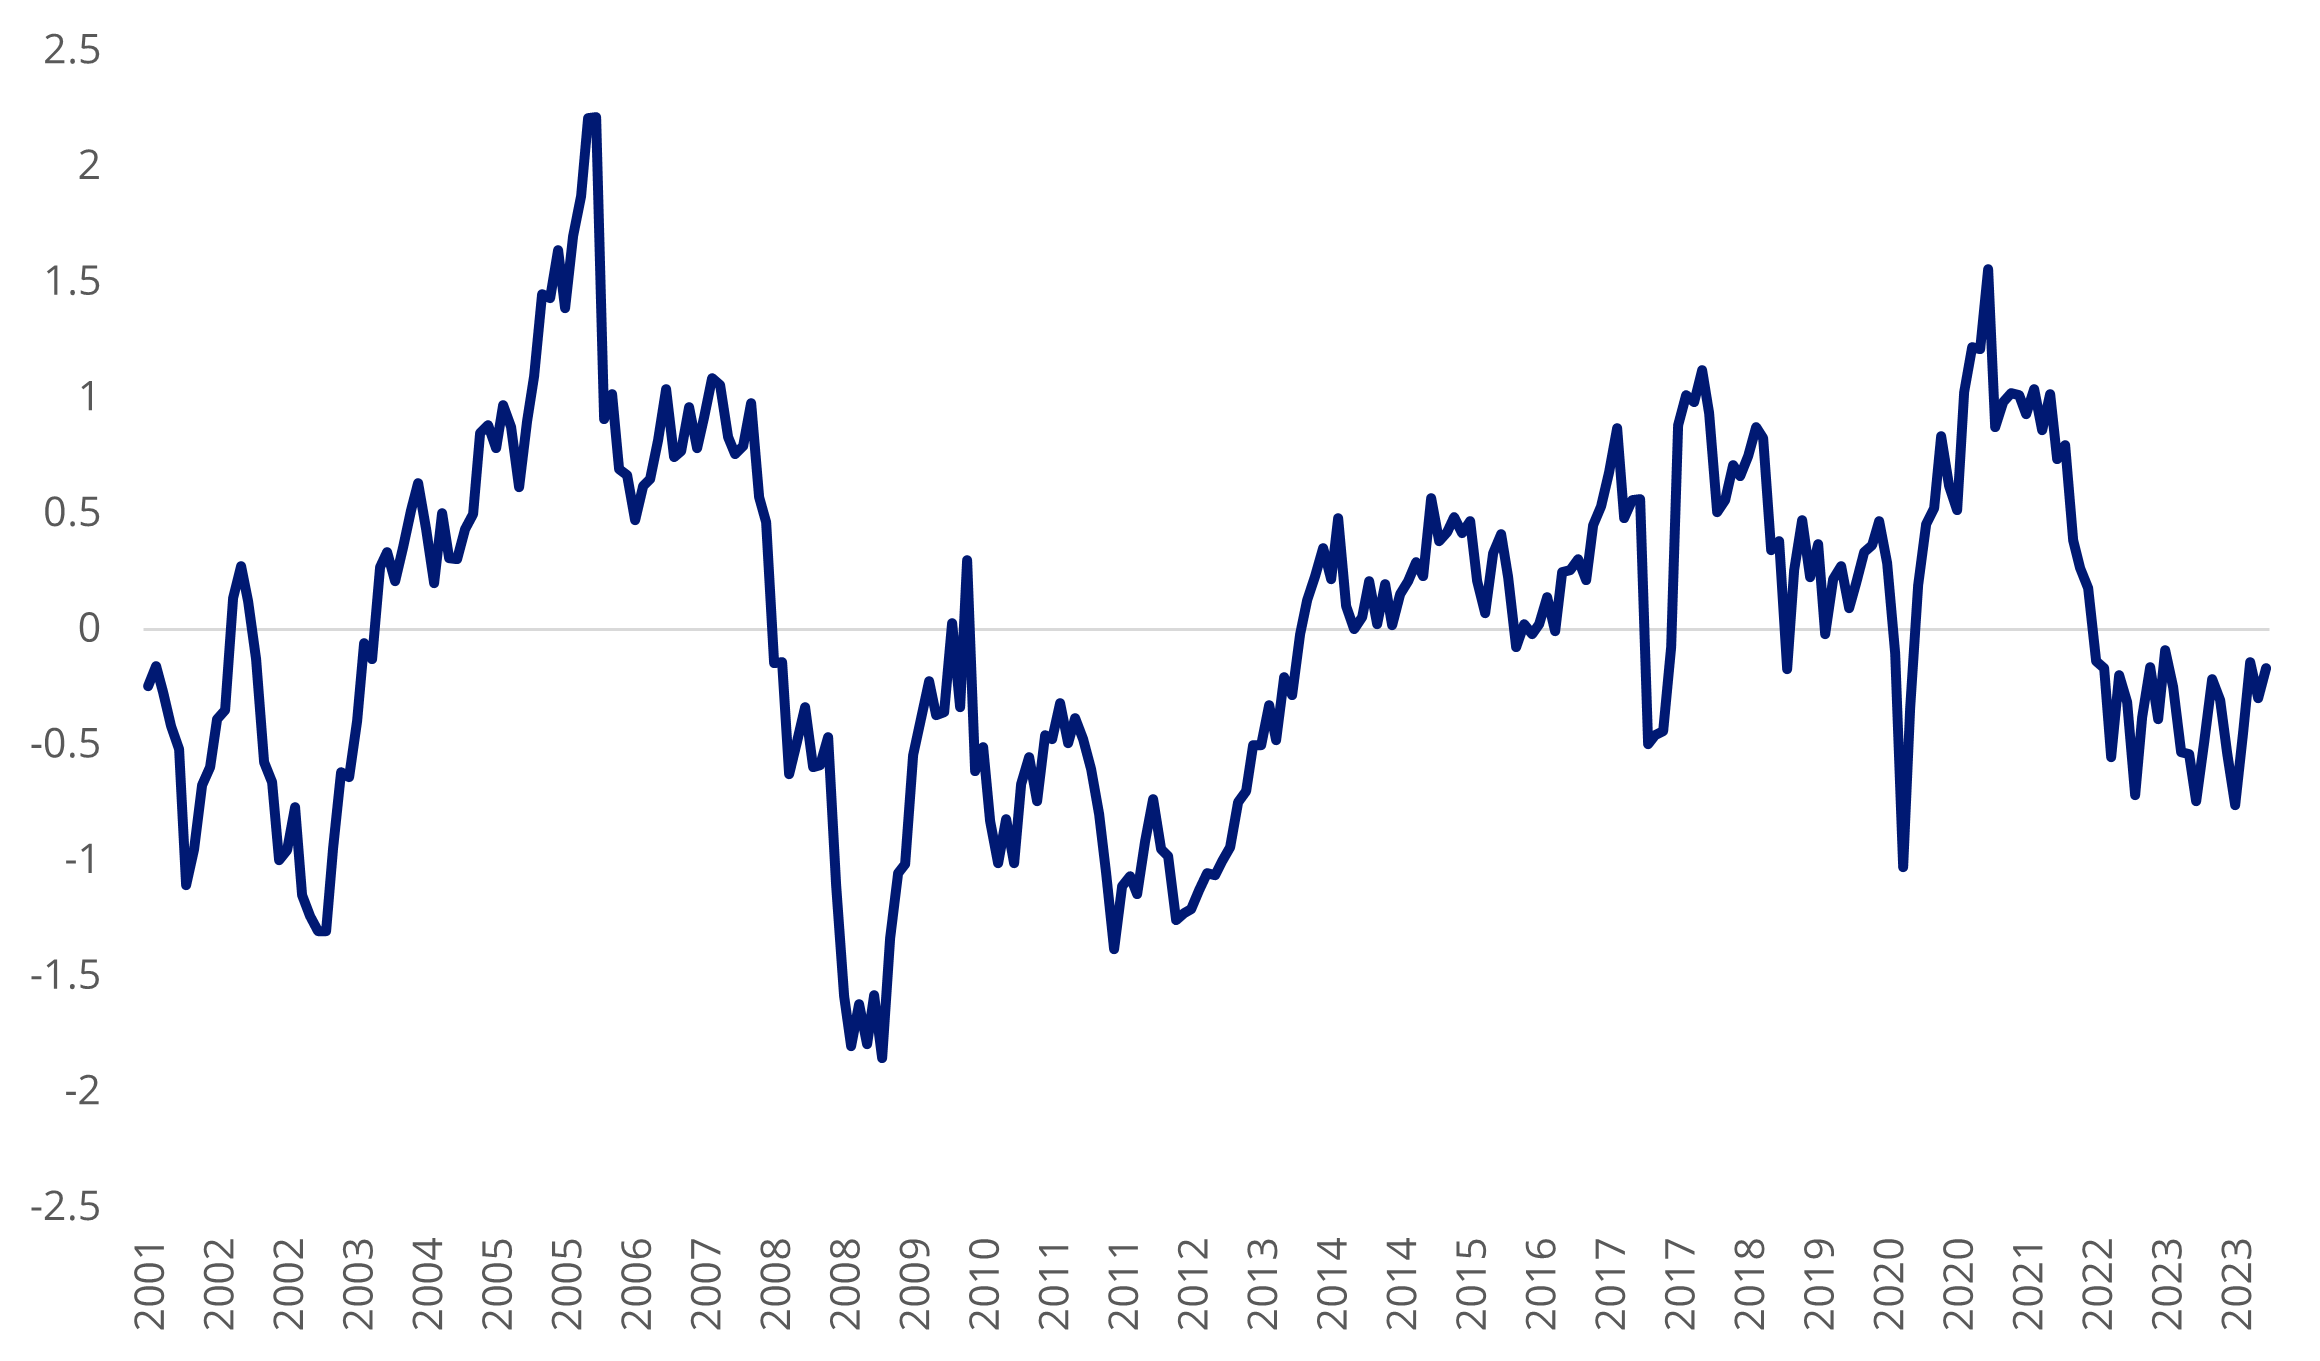
Source: Bloomberg, as at 19 February 2023.
Chart 4: Performance during market recoveries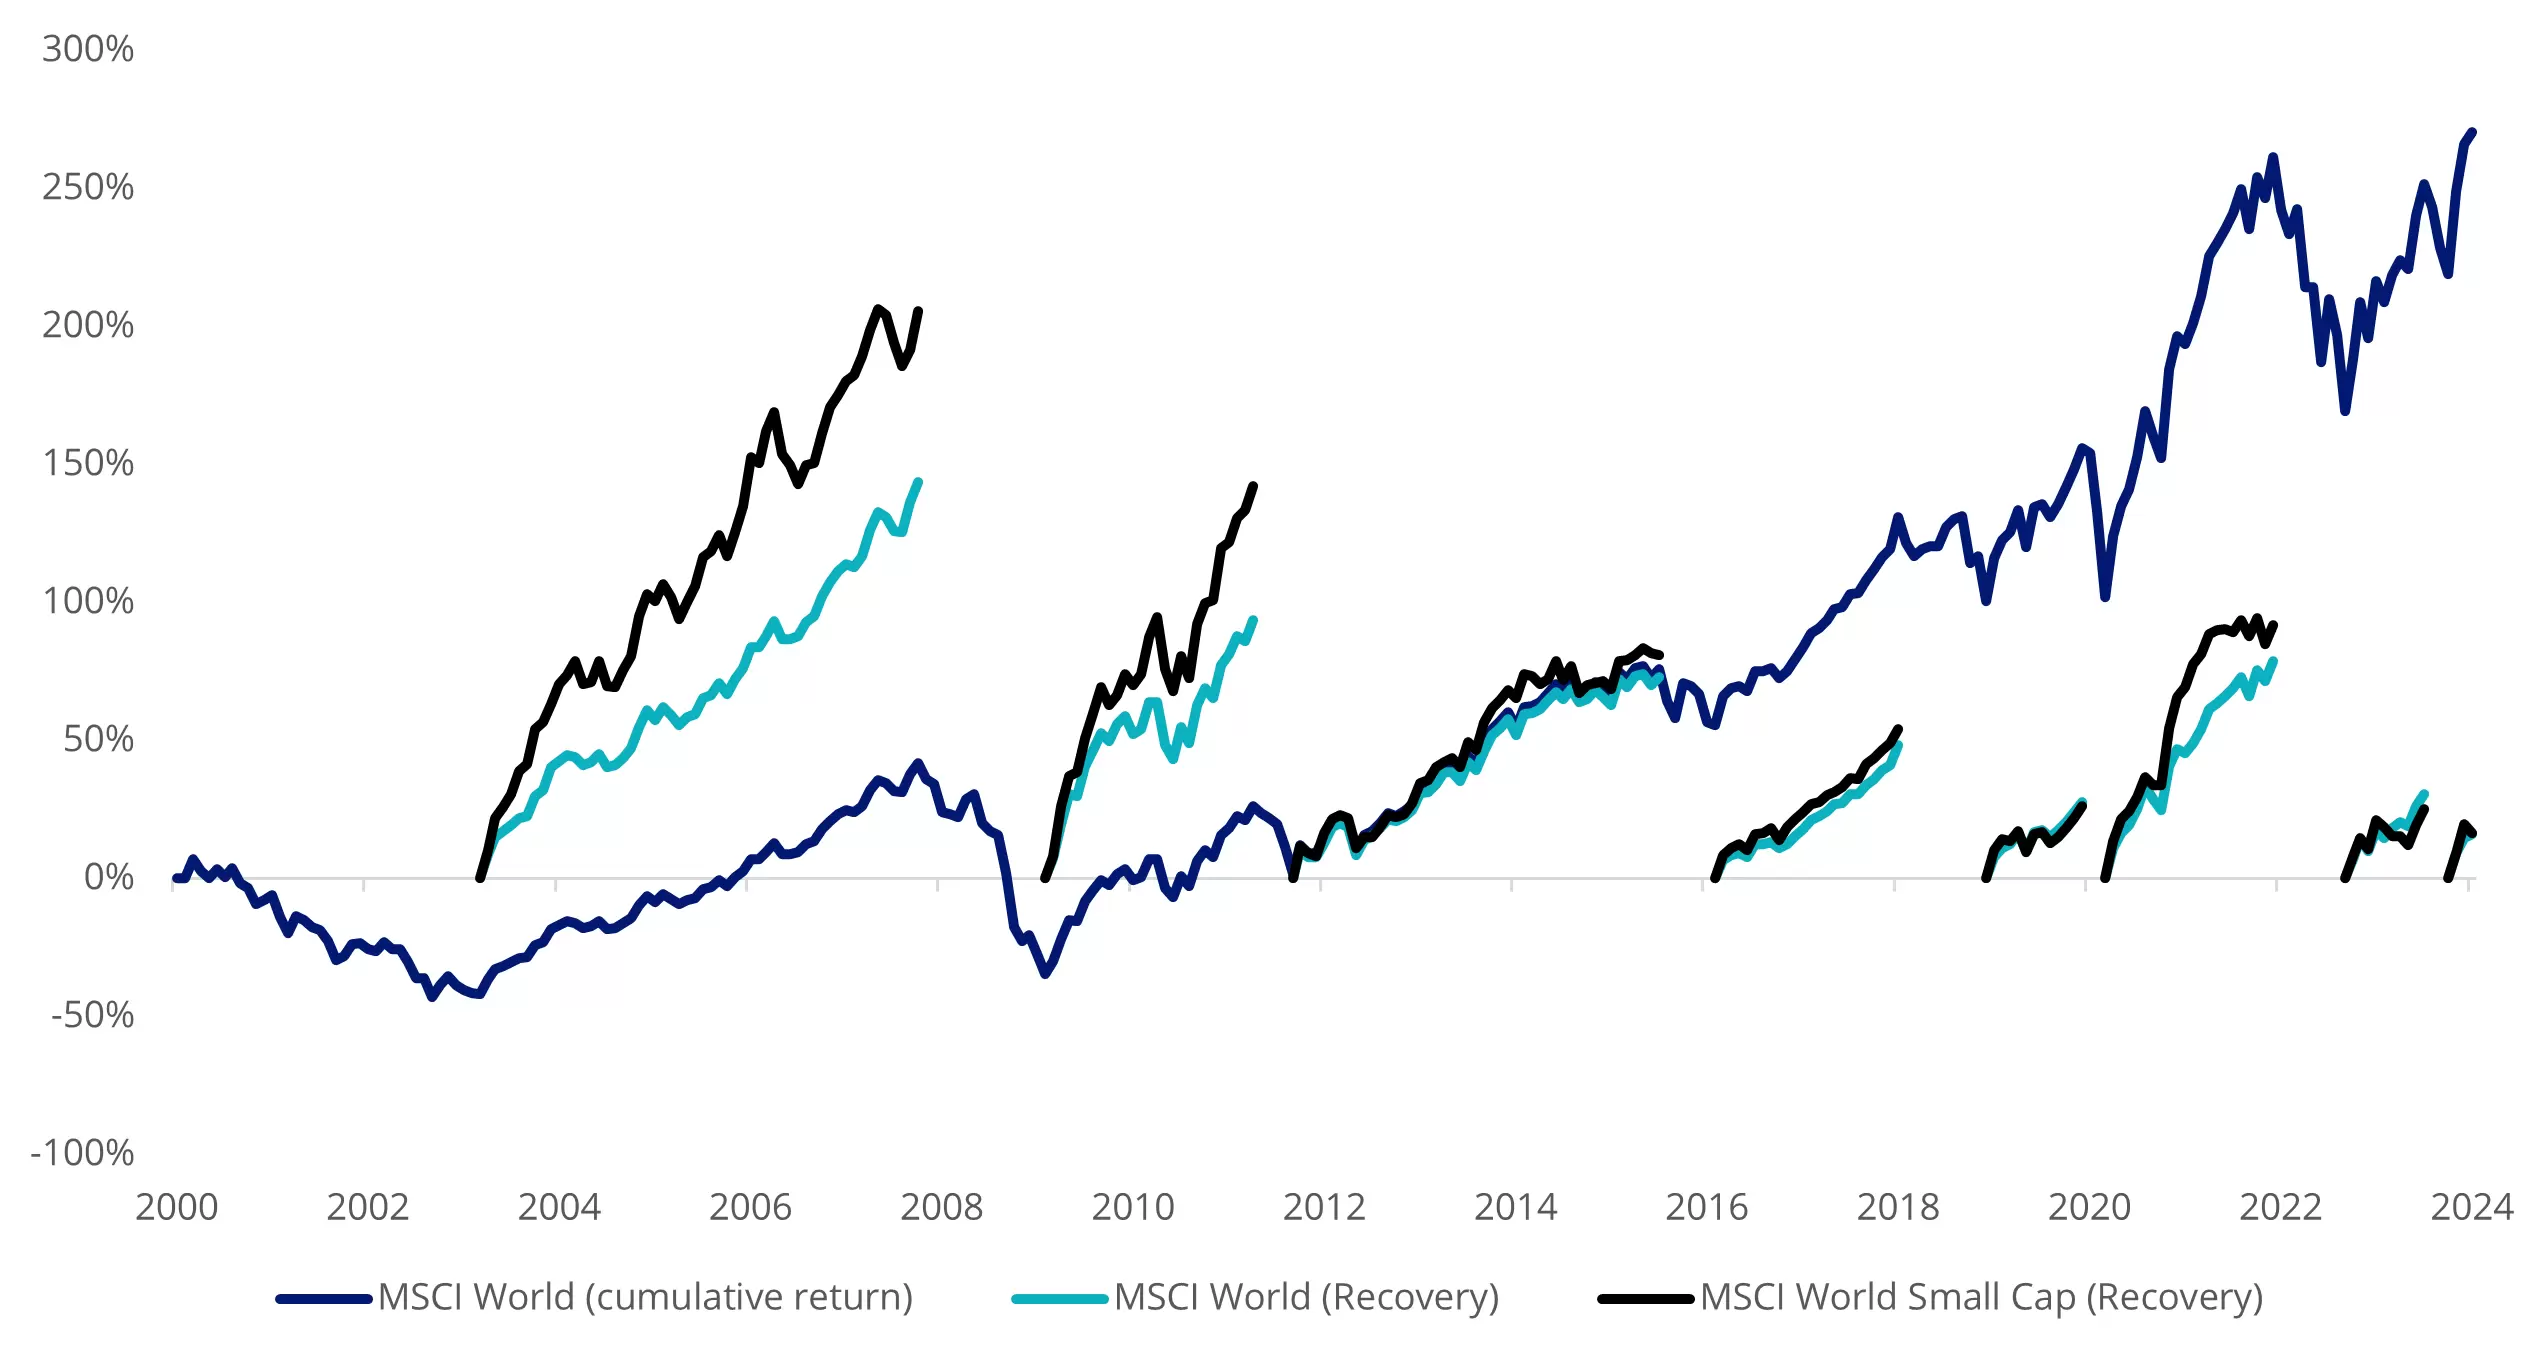
Access to Global Small Caps
Australian investors can access small companies via the VanEck MSCI International Small Companies Quality ETF (ASX: QSML). The ETF gives investors a diversified portfolio of 150 international developed market small-cap quality growth securities.
VanEck’s white paper Global small-caps: An overlooked opportunity demonstrates that small-cap quality investing has delivered more alpha relative to large-caps and exhibits defensive characteristics.
Undervalued asset class 2: China equities
It has been well noted that China’s mainland stocks have been punished by investors wary of slowing growth. China’s equity benchmark, CSI 300 is trading at the lower bound of its historical average by price to forward earnings, book and sales. To improve confidence, there are murmurs locally that Chinese authorities are considering expanding fiscal stimulus measures. Regulators reportedly briefed China’s President Xi Jinping on suggested measures earlier in February. Given the depressed state of Chinese share valuations and the looming potential injection of fiscal stimulus, a rally could be on the cards.
Chart 5: CSI 300 valuation z-score (12m forward PE, 12m forward PB, 12m forward PS, CAPE)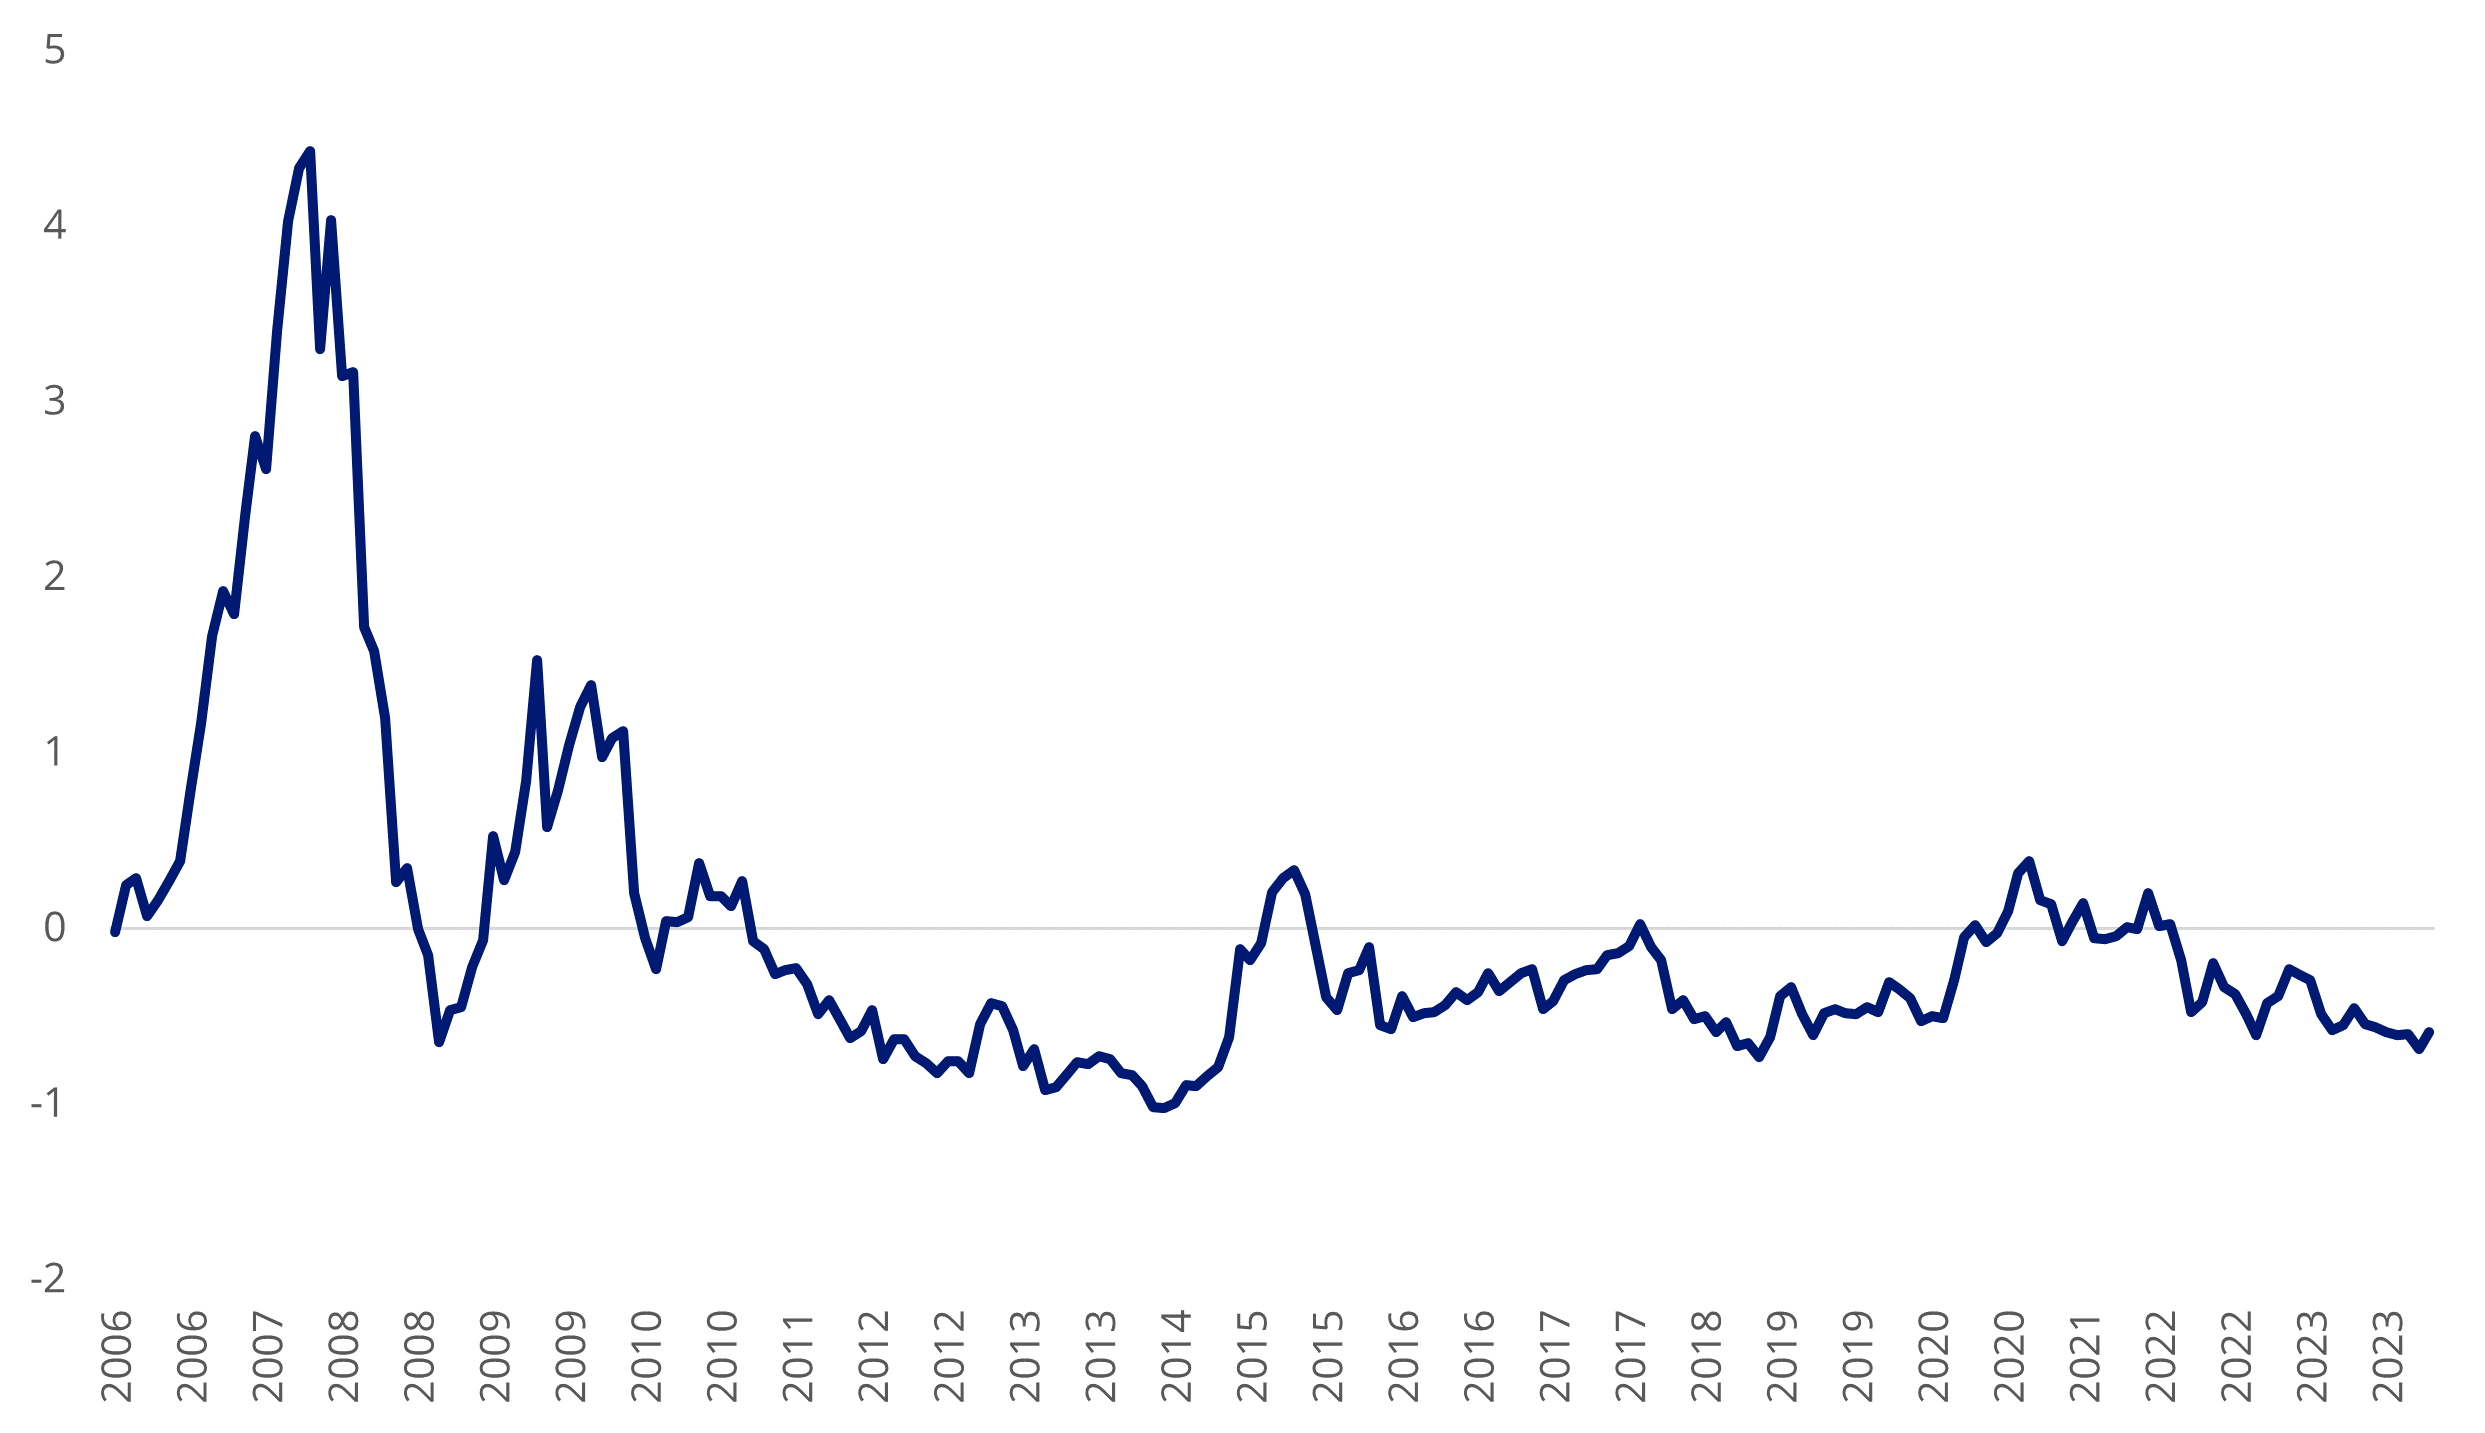
Source: Bloomberg, as at 16 February 2023.
Access to China equities
There are limited ways though in which Australian investors can acquire mainland China A-shares. VanEck has two ETFs that provide investors a way to participate in what may be the next growth phase for A-share investments.
Should fiscal measures be announced, it would likely target the most economically critical sectors, banking, property and industrials. We saw this following the global financial crisis. Policy support could trigger a rally in these sectors and lead to a cyclical recovery. The FTSE China A50 Index which the VanEck FTSE China A50 ETF (ASX: CETF) tracks provides exposure to the largest 50 mainland China listed companies. Approximately 45% of companies are involved in these sectors. It is the most cost-effective beta ETF exposure to China A-shares in the Asian region.
When policy support subsequently improves broader economic confidence, companies involved in China’s new economy sectors would likely be key beneficiaries. Sectors include technology, healthcare, consumer discretionary and consumer staples. VanEck China New Economy ETF (ASX: CNEW) gives investors easy access to China A-shares involved in these sectors.
Undervalued asset class 3: Listed private equities
Listed private equities was one of the best performers in 2023 returning 42.34%2and could be a standout again in 2024. Despite the strong performance (and as we always caution, past performance is not indicative of future results), listed private equity is still trading at an 18% discount to the net asset value of the underlying investments. To capitalise on the discount, private equity managers have been buying back shares, saying to the market that they perceive listed prices to be undervalued.
Chart 6: Listed Private Equity Price to Net Asset Value (NAV)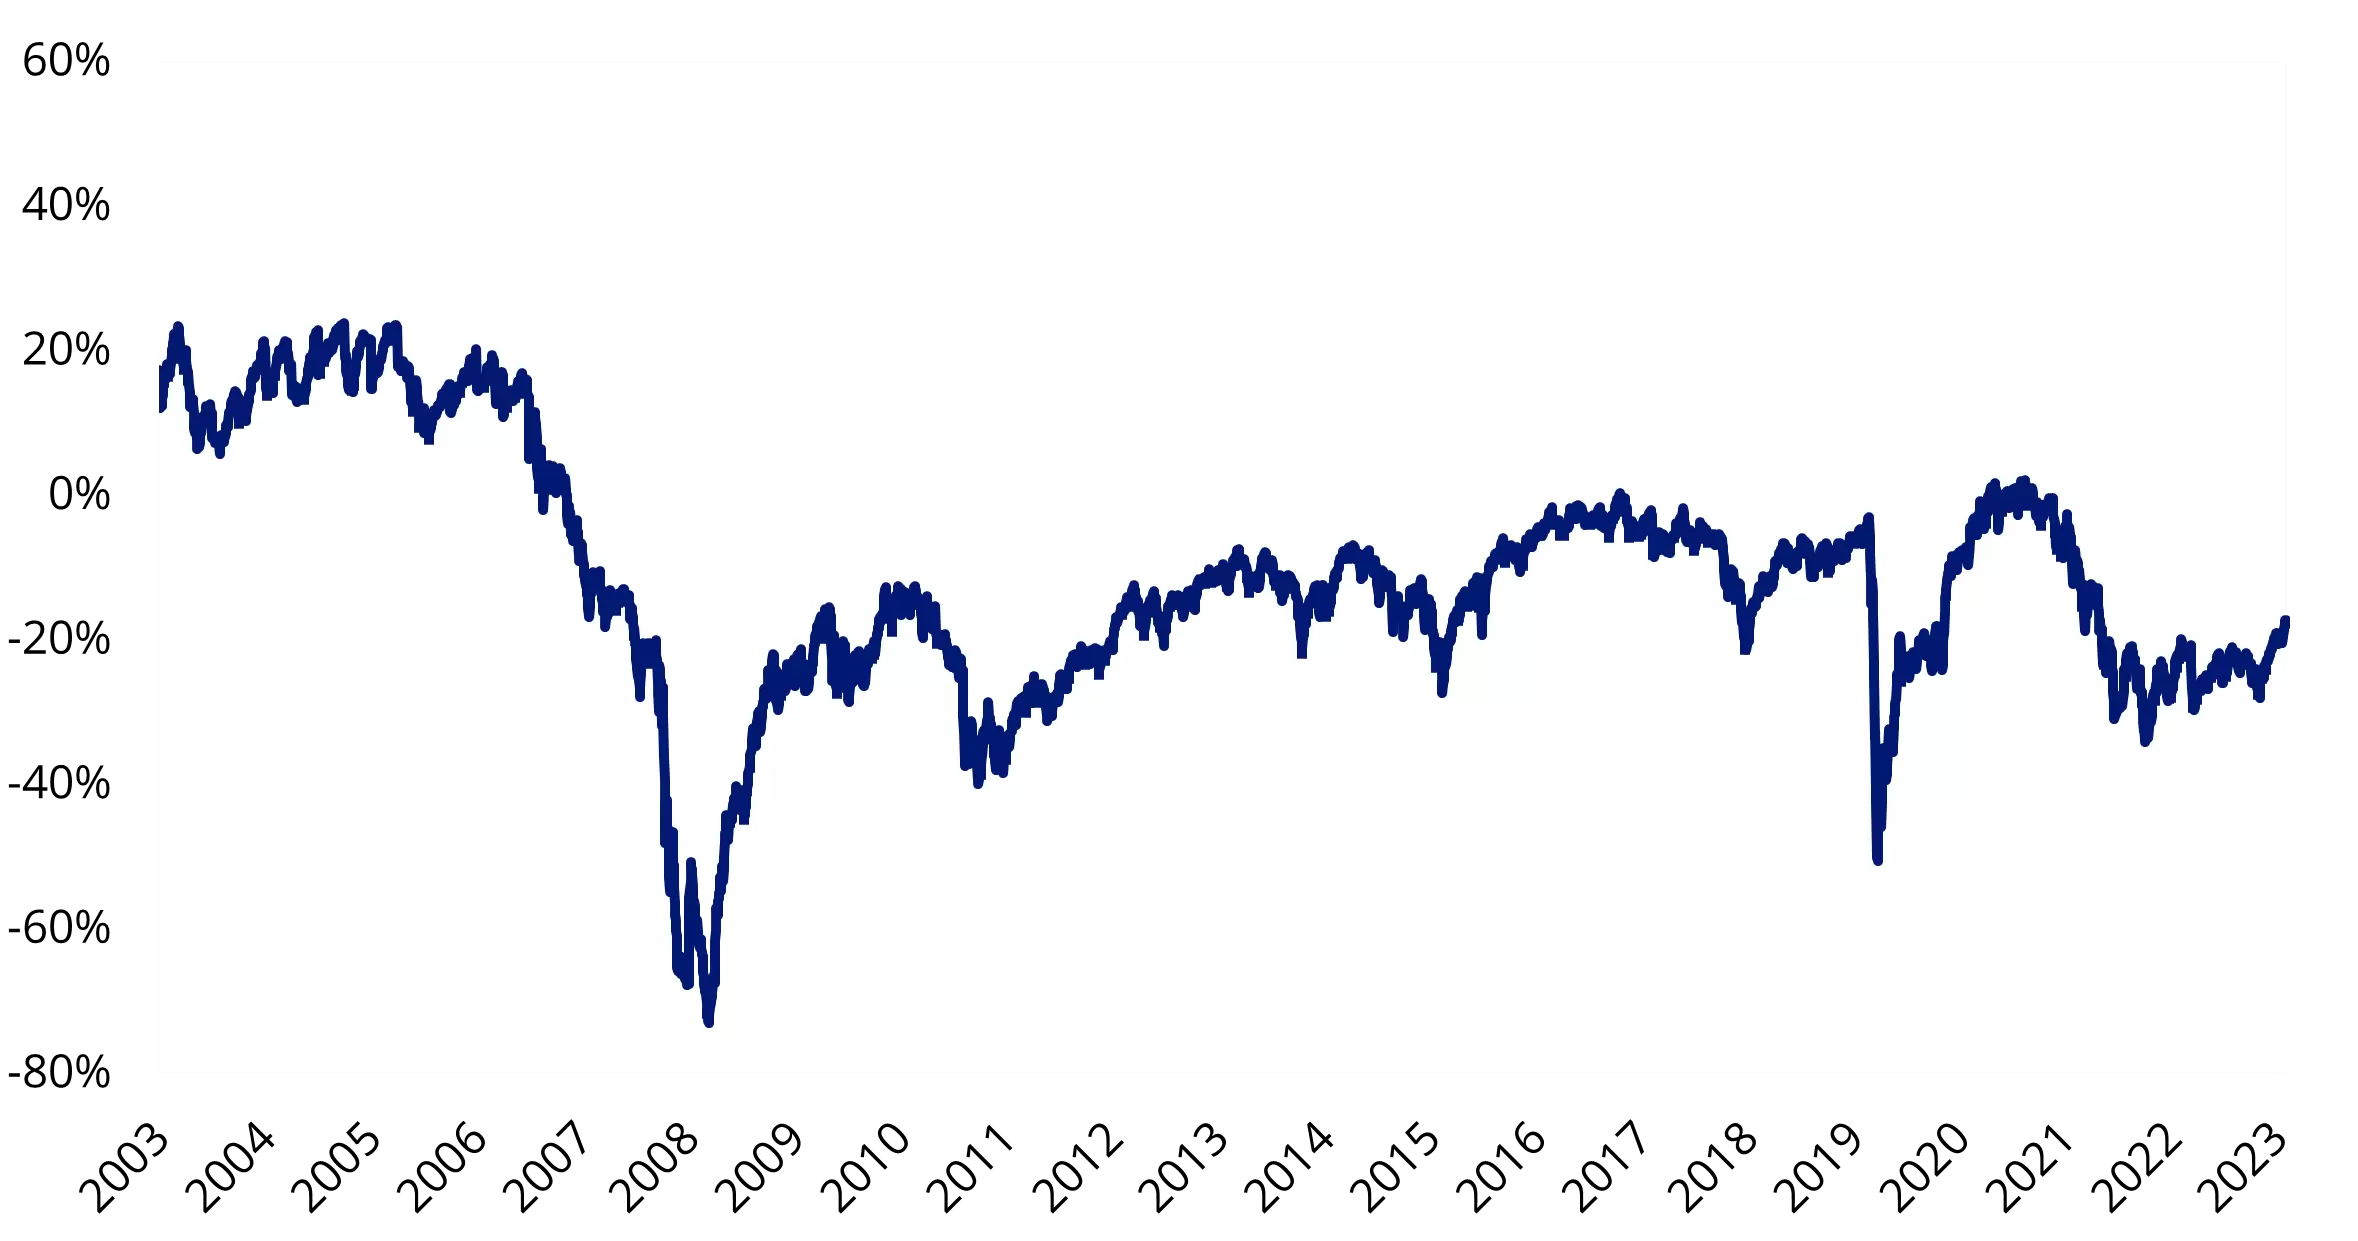
Source: LPX, as at 31 January 2024. Index used is LPX50 Index. Past performance is not indicative of future results. You cannot invest directly in an index.
Access to listed private credit
The VanEck Global Listed Private Equity ETF (ASX Ticker: GPEQ) tracks the LPX50 Index and includes the largest and most liquid 50 listed private equity companies with exposure to venture, growth and buy-out opportunities.
GPEQ provides immediate access to a highly diversified private equity portfolio diversified across regions, private equity investment styles and categories, vintages & currencies. Indirectly, GPEQ provides access to more than 4,500 private equity investments and 550 private equity funds.
GPEQ aims to provide investors with private equity returns, but with share market liquidity.
Key risks
An investment in the funds mentioned may carries risks associated with: ASX trading time differences, China, listed private equity, financial markets generally, individual company management, industry sectors, foreign currency, sector concentration, political, regulatory and tax risks, fund operations, liquidity and tracking an index. See the PDS for details.
Sources
1 As at 19 February 2024
2 As measured by the VanEck Global Listed Private Equity ETF as at 31 December 2023


Published: 28 February 2024