The disruption of active - UPDATE
Case study: Using a Quality Factor smart beta ETF
We’ve talked extensively about the rise of smart beta ETFs and the disruption of unlisted actively managed funds. One argument active fund managers put forward to justify their typically higher fees compared to ETFs, is that only they can protect investors in volatile markets.2020 has given us an ideal environment to test this.

Case study: Using a Quality Factor smart beta ETF
We’ve talked extensively about the rise of smart beta ETFs and the disruption of unlisted actively managed funds, as well as the consistent inability of these active funds to outperform the benchmark. One argument active fund managers put forward to justify their typically higher fees compared to ETFs, is that only they can protect investors in volatile markets. This is because, they say, they have the ability to select stocks that can better withstand shocks because they are not compelled to hold ‘the index’.
2020 has given us an ideal environment to test this.
Quality investing
The recent market volatility around the coronavirus has raised investor concerns of an impending Australian economic slowdown recession and, by extension, weak domestic equity growth. Investors are pondering their approach to risk assets and looking to diversify beyond Australia, but are still mindful of the impact of a coronavirus led global slowdown in an ultra-low interest rate environment in which central banks can do little but resort to unconventional monetary policy.
Quality investing, defined by investing in stocks which have higher return on equity (ROE), sustainable earnings and low financial leverage, has historically been a go to strategy for those astute investors seeking long-term outperformance, due to the fact quality companies have historically demonstrated lower drawdown and faster recovery.
When volatility occurs, like the ups and downs we have seen on markets over the past few months, quality investing has served as an important defensive factor in portfolio construction.
Quality shines during lock-down
History has persistently shown that in times of volatility, quality companies have outperformed: when markets fall they lose less and recover faster. This crisis has, so far, been no different. In the chart below, when the purple line is rising, quality is outperforming. In the five most recent periods of increased volatility, quality has outperformed the market benchmark and it has outperformed so far in 2020 when much of the world has been in lockdown.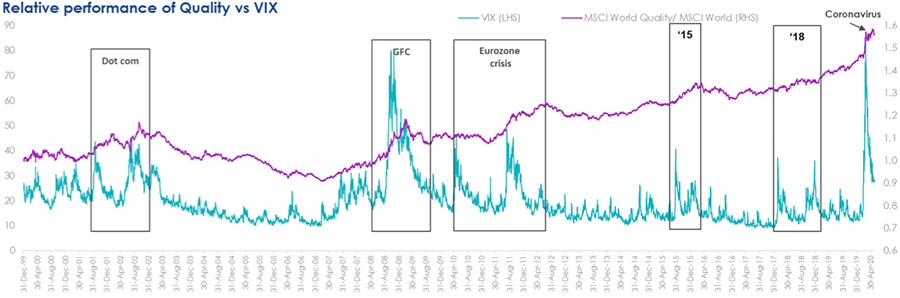
Source: MSCI Data/Calculations, Bloomberg, 31 December 1999 to 31 May 2020. Chart shows performance of MSCI World ex Australia Quality Index relative to MSCI World ex Australia Index compared to VIX Index. Results include the reinvestment of all dividends, but exclude fees and other costs associated with an investment in QUAL. You cannot invest in an index. Past performance is not a reliable indicator of future performance of the index or QUAL.
A QUALity ETF
The VanEck Vectors MSCI World ex Australia Quality ETF (ASX: QUAL) invests in approximately 300 quality companies, across geographies and sectors. The ETF seeks to track the performance of the MSCI World ex Australia Quality Index.
Since its inception on 29 October 2014, QUAL has returned 16.75% p.a., outstripping the standard industry benchmark, the MSCI World Ex Australia Index, by 4.35% p.a.
QUAL Performance to 31 May 2020
|
1 Mth (%) |
3 Mths (%) |
CYTD (%) |
6 Mths (%) |
1 Year (%) |
3 Years (% p.a.) |
5 Years (% p.a.) |
Since QUAL Inception (% p.a.) |
|
|
QUAL |
4.23 |
4.51 |
5.54 |
5.27 |
25.54 |
16.30 |
13.71 |
16.75 |
|
MSCI World Ex Australia Index |
3.40 |
-1.77 |
-2.51 |
-3.34 |
11.98 |
10.19 |
9.03 |
12.40 |
|
Difference |
+0.83 |
+6.28 |
+8.05 |
+8.61 |
+13.56 |
+6.11 |
+4.68 |
+4.35 |
*Inception date is 29 October 2014. Source: Morningstar Direct, VanEck. The chart above shows past performance of QUAL and of the MSCI World ex Australia Index. Results are calculated to the last business day of the month and assume immediate reinvestment of distributions. QUAL results are net of management fees and other costs incurred in the fund, but before brokerage fees and bid/ask spreads incurred when investors buy/sell on the ASX. Returns for periods longer than one year are annualised. Past performance is not a reliable indicator of future performance.
This performance puts QUAL, relative to its peers, in the top five percent over one and five years and since its inception in October 2014, and in the top quartile over the current calendar year and for the three years ending 31 March 2020.
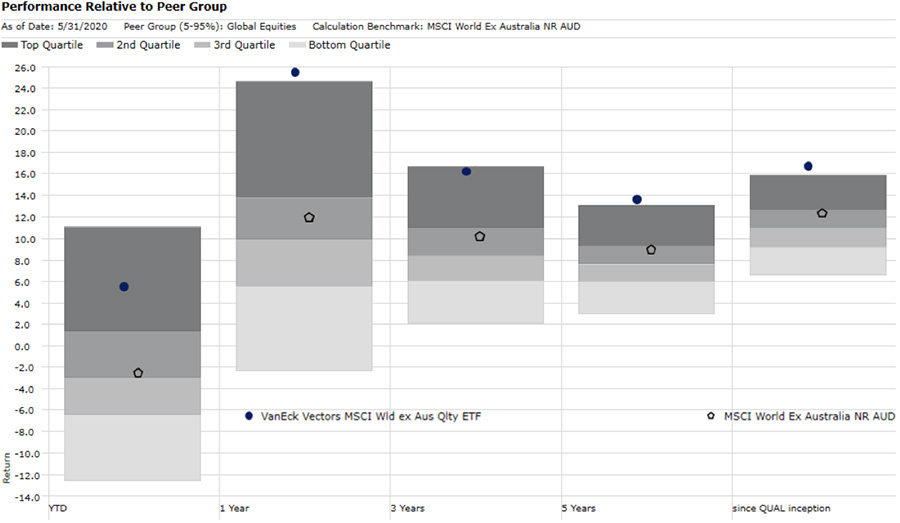
Source: Morningstar, as at 31 March 2020. Past performance is not a reliable indicator of future performance. The peer group of Global Equities includes Morningstar’s Open Ended Global Equity Blend Category, Morningstar’s Open Ended Global Equity Growth Category and Morningstar’s Open Ended Global Equity Value Category which are based on the defined Australian universe of funds that invest primarily in large global companies.
Fees matter: QUAL versus active managers
QUAL’s impressive performance has been achieved at approximately a third of the cost of most active managers. Most actively managed funds charge much higher fees, generally between 1% and 1.5%, and that’s not including performance fees charged by many active managers. Despite these higher fees, most of these active funds have underperformed their benchmarks. QUAL demonstrates that passive smart beta strategies can deliver superior investment outcomes for low fees. Below, we showcase the total 5-year annualised return compared to their fees for all active fund managers in Australia, as well as QUAL, which is shown in dark blue. The purple line represents the return of the MSCI World Ex Australia Index. Despite QUAL’s lower fee it outperforms the majority of active fund managers, most of which have underperformed the benchmark.
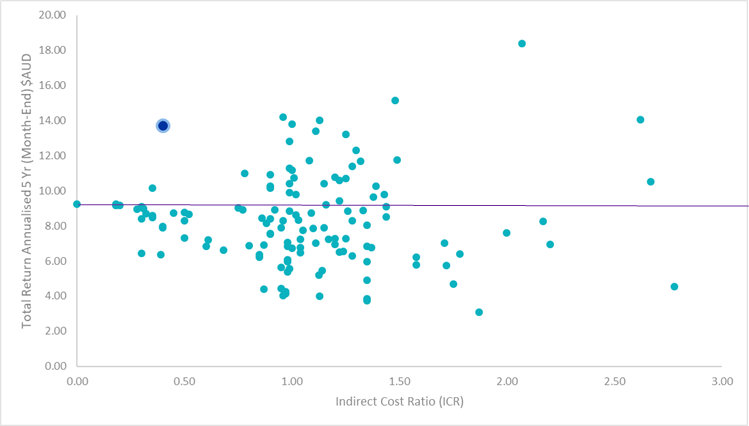
Source: Relevant Product Disclosure Statements, Morningstar Direct, VanEck.
What this means is that by investing with QUAL, you are putting more of your money to work generating returns. Not only could you potentially save over 1% per annum in fees, but also deliver improved returns because active managers will have to outperform QUAL by at least the difference between their total fees (many including performance fees) and QUAL’s lower fees, just to match QUAL’s performance. As you can see above not many active managers have succeeded in doing that over the last 5 years. The same is true over the last 1, 2, 3 and 4 years.
QUAL’s smart beta approach should be considered alongside some of these excellent managers who can illustrate expertise and differentiation beyond the quality factor.
Find out more about QUAL or the VanEck Vectors MSCI World ex Australia Quality (Hedged) ETF (ASX: QHAL), which is an Australian dollar hedged version of QUAL so you can manage your desired currency exposure.
IMPORTANT NOTICE: This information is issued by VanEck Investments Limited ABN 22 146 596 116 AFSL 416755 (‘VanEck’) as responsible entity and issuer of the VanEck Vectors MSCI World ex Australia Quality ETF and VanEck Vectors MSCI World ex Australia Quality (Hedged) ETF. This is general information about financial products only and not personal financial advice. It does not take into account any person’s individual objectives, financial situation or needs. Before making an investment decision in relation to an ETF, you should read the relevant PDS and with the assistance of a financial adviser consider if it is appropriate for your circumstances. The PDSs are available at www.vaneck.com.au or by calling 1300 68 38 37. The funds are subject to investment risk, including possible loss of capital invested. Past performance is not a reliable indicator of future performance. No member of the VanEck group of companies gives any guarantee or assurance as to the repayment of capital, the payment of income, the performance, or any particular rate of return from any ETF.
QUAL and QHAL invest in international markets. An investment in QUAL or QHAL has specific and heightened risks that are in addition to the typical risks associated with investing in the Australian market. These include currency risks from foreign exchange fluctuations, ASX trading time differences and changes in foreign laws and regulations including taxation.
QUAL and QHAL are indexed to a MSCI index. The ETFs are not sponsored, endorsed, or promoted by MSCI, and MSCI bears no liability with respect to QUAL or QHAL or the MSCI Index. The PDSs contain a more detailed description of the limited relationship MSCI has with VanEck and the ETFs.
© 2020 VanEck Australia Pty Ltd. All rights reserved.


Published: 11 June 2020