Don't leave out a central character
You can’t tell the story of the three little pigs without including the third little pig who built the house of bricks. However almost every article on active and passive management neglects to mention an all-important third central character. It’s time to tell the full story.

So much has been written about active and passive management. In the majority of this literature passive management is accepted as investment portfolios which aim to track the performance of a market capitalisation benchmark index, before fees. Active management are those investments managed by a fund manager based on research and analysis, with a specific investment objective in mind, often to outperform a market capitalisation benchmark index.
These two players are not the only key characters in the investment management world and the debates as to which is the better approach is redundant because there is another character whose inclusion fundamentally alters the analysis in these articles.
Smart beta is the other central character and it is fast becoming the most important. Smart beta is the term given to a financial market index that uses a rules-based methodology that differs from market capitalisation based weightings and has been designed with a specific objective in mind, often to outperform a market capitalisation index. Smart beta combines the advantages of passive and active management.
Passive management is known for its advantages of low costs and its ability to provide market returns less these low costs. Recently, passive investing has been great for Australian, US and international equity investors, as these markets have experienced significant rises since the GFC. This has been reflected in the well-documented flows to passive managers over that time. A driver of the growth in passive funds has been the lacklustre performance of active managers as evidenced by the semi-annual SPIVA report (S&P Dow Jones Indices Versus Active).
The prevailing perspective from active managers is that passive management may be okay in a rising market, but only they can protect investors in volatile markets. This is because, they say, they have the ability to select stocks that can better withstand shocks and this is active management’s biggest advantage.
Naturally sceptical investors are wary. If active managers can’t pick outperforming stocks in a rising market, why would they be able to pick outperforming stocks in a falling market?
Smart beta meanwhile is not only low cost, but provides investors with portfolios built with construction methodologies that incorporate strict stock selection rules -the very ‘stock selection’ active managers claim only they can provide.
Smart beta is becoming mainstream. Now in its fourth year, VanEck's smart beta survey was conducted in July and August 2019 among Australian financial professionals. It showed the majority of financial advisers (66%) use smart beta strategies to replace actively managed funds and most (68%) are very or extremely satisfied with their investments. This highlights that the movement towards smart beta ETFs - which deliver targeted investment outcomes through rules-based investing – is taking hold in the Australian investment market and becoming mainstream.
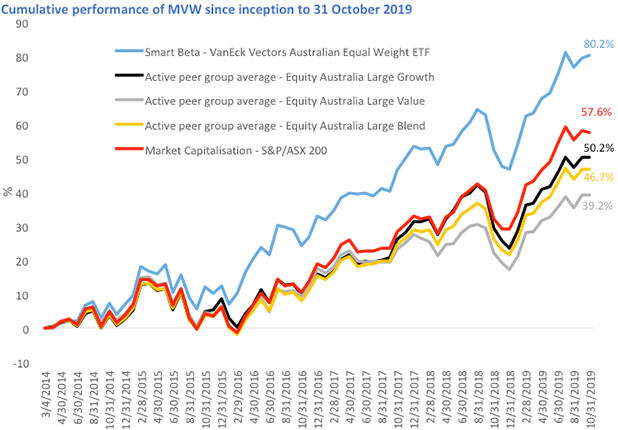
As more financial professionals are using smart beta, it’s worth assessing some of these strategies by the metric used in the active versus passive articles: performance over the medium to long term. Below we have set out comparisons between smart beta strategies, the average of the Morningstar Australia Funds peer group and market capitalisation benchmarks for Australian equities, US equities and international equities.
Australian equities
|
Performance to 31 October 2019 |
CYTD |
1 yr |
3 yrs |
5 yrs |
Since inception |
|
VanEck Vectors Australian Equal Weight ETF (MVW) |
22.91 |
18.33 |
13.47 |
11.19 |
10.97 |
|
Average Australia Large Blend |
20.81 |
8.58 |
9.91 |
7.92 |
7.01 |
|
Average Australia Large Growth |
21.64 |
7.41 |
9.98 |
8.47 |
7.46 |
|
Average Australia Large Value |
18.68 |
7.53 |
7.81 |
6.58 |
6.02 |
|
S&P/ASX 200 |
22.60 |
20.27 |
12.96 |
8.76 |
8.44 |
Inception date is 4 March, 2014
Source: Morningstar Direct, as at 31 October 2019. Best performer bolded green.
Equity Australia Large Value funds invest primarily in large Australian companies that are less expensive and/or may be growing more slowly than other large-cap companies. Equity Australia Large Growth funds invest in large Australian companies that are projected to grow faster than other large-cap stocks in the Australian market. Equity Australian Large Blend funds invest primarily in large Australian companies. Stocks in the top 70% of the capitalisation of the equities market are defined as large-cap. The average returns the mean of the returns for each fund in the respective peer universe.
Results are per annum, calculated daily to the last business day of the month and assume immediate reinvestment of all dividends. MVW results are net of management fees and other costs incurred in the fund but do not include brokerage costs and buy/sell spreads incurred when investing in MVW. Past performance is not a reliable indicator of future performance.
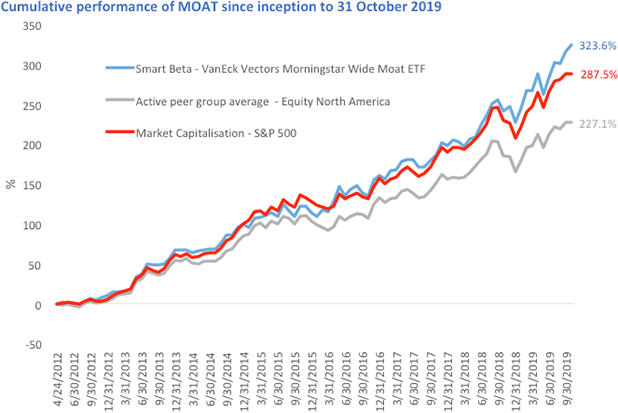
US equities
|
Performance to 31 October 2019 |
CYTD |
1 yr |
3 yrs |
5 yrs |
Since inception |
|
VanEck Vectors Morningstar Wide Moat ETF (MOAT) |
30.75 |
25.68 |
22.09 |
18.49 |
21.32 |
|
Average Equity North America |
23.01 |
8.02 |
15.73 |
14.49 |
17.08 |
|
S&P/ASX 500 |
26.54 |
19.94 |
18.86 |
16.80 |
19.84 |
Inception date is 24 April, 2012
Source: Morningstar Direct, as at 31 October 2019. Best performer bolded green.
Equity North America funds invest in the securities of companies listed in the USA and/or Canada. Securities from these countries typically account for at least 75% of the portfolio. The average returns the mean of the returns for each fund in the respective peer universe.
Results are per annum, calculated daily to the last business day of the month and assume immediate reinvestment of all dividends. MOAT results are net of management fees and other costs incurred in the fund but do not include brokerage costs and buy/sell spreads incurred when investing in MOAT. Past performance is not a reliable indicator of future performance.
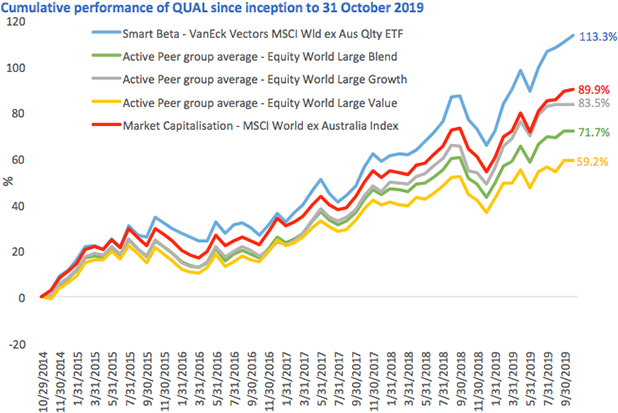
International equities
|
Performance to 31 October 2019 |
CYTD |
1 yr |
3 yrs |
5 yrs |
Since inception |
|
VanEck Vectors MSCI World ex Australia Quality ETF (QUAL) |
29.14 |
23.41 |
18.99 |
16.10 |
16.44 |
|
Average Equity World Large Blend |
19.95 |
7.13 |
13.17 |
11.42 |
11.42 |
|
Average Equity World Large Growth |
23.45 |
11.06 |
15.20 |
12.91 |
12.91 |
|
Average Equity World Large Value |
16.56 |
4.75 |
11.17 |
9.74 |
9.74 |
|
MSCI World Ex Australia NR AUD |
23.75 |
18.18 |
15.71 |
13.53 |
13.77 |
Inception date is 29 October, 2014.
Source: Morningstar Direct, as at 31 October 2019. Best performer bolded green.
Equity Region World Large Value funds invest primarily in large companies listed from around the globe Equity World Large Growth funds invest in large companies listed around the globe. Equity World Large Blend funds invest primarily in large companies listed around the globe. Stocks in the top 70% of the capitalisation of the equities market are defined as large-cap. The average returns the mean of the returns for each fund in the respective peer universe.
Source: Morningstar Direct, as at 31 October 2019. Results are per annum, calculated daily to the last business day of the month and assume immediate reinvestment of all dividends. MOAT results are net of management fees and other costs incurred in the fund but do not include brokerage costs and buy/sell spreads incurred when investing in MOAT. Past performance is not a reliable indicator of future performance.
So the next time you see an active versus passive article that doesn’t include smart beta, skip past it. You are not getting the full story.
IMPORTANT NOTICE: Issued by VanEck Investments Limited ABN 22 146 596 116 AFSL 416755 (‘VanEck’). This is general information only about financial products and not personal financial advice. It does not take into account any person’s individual objectives, financial situation or needs. Before making an investment decision, you should read the relevant PDS and with the assistance of a financial adviser consider if it is appropriate for your circumstances. PDSs are available at www.vaneck.com.au or by calling 1300 68 38 37.
No member of VanEck group of companies gives any guarantee or assurance as to the repayment of capital, the payment of income, the performance, or any particular rate of return of any VanEck funds. Past performance is not a reliable indicator of future performance.
VanEck is the responsible entity and issuer of units in the VanEck Vectors ETFs traded on ASX. All investments carry some level of risk. Investing in international markets has specific risks that are in addition to the typical risks associated with investing in the Australian market. These include currency/foreign exchange fluctuations, ASX trading time differences and changes in foreign regulatory and tax regulations.
© 2019 VanEck Australia Pty Ltd


Published: 08 November 2019