Defensive sectors win US Q3 earnings season
Headline statistics of the third quarter US earnings tell the story of another harvest season. At the time of writing, ~82% of companies on the S&P 500 had beat street estimates, with an average EPS growth of ~13%. Technology companies again smashed records, reporting an average 26% annual EPS growth.
Charts 1 & 2: Q3 2025 saw the highest earnings beat since 2021
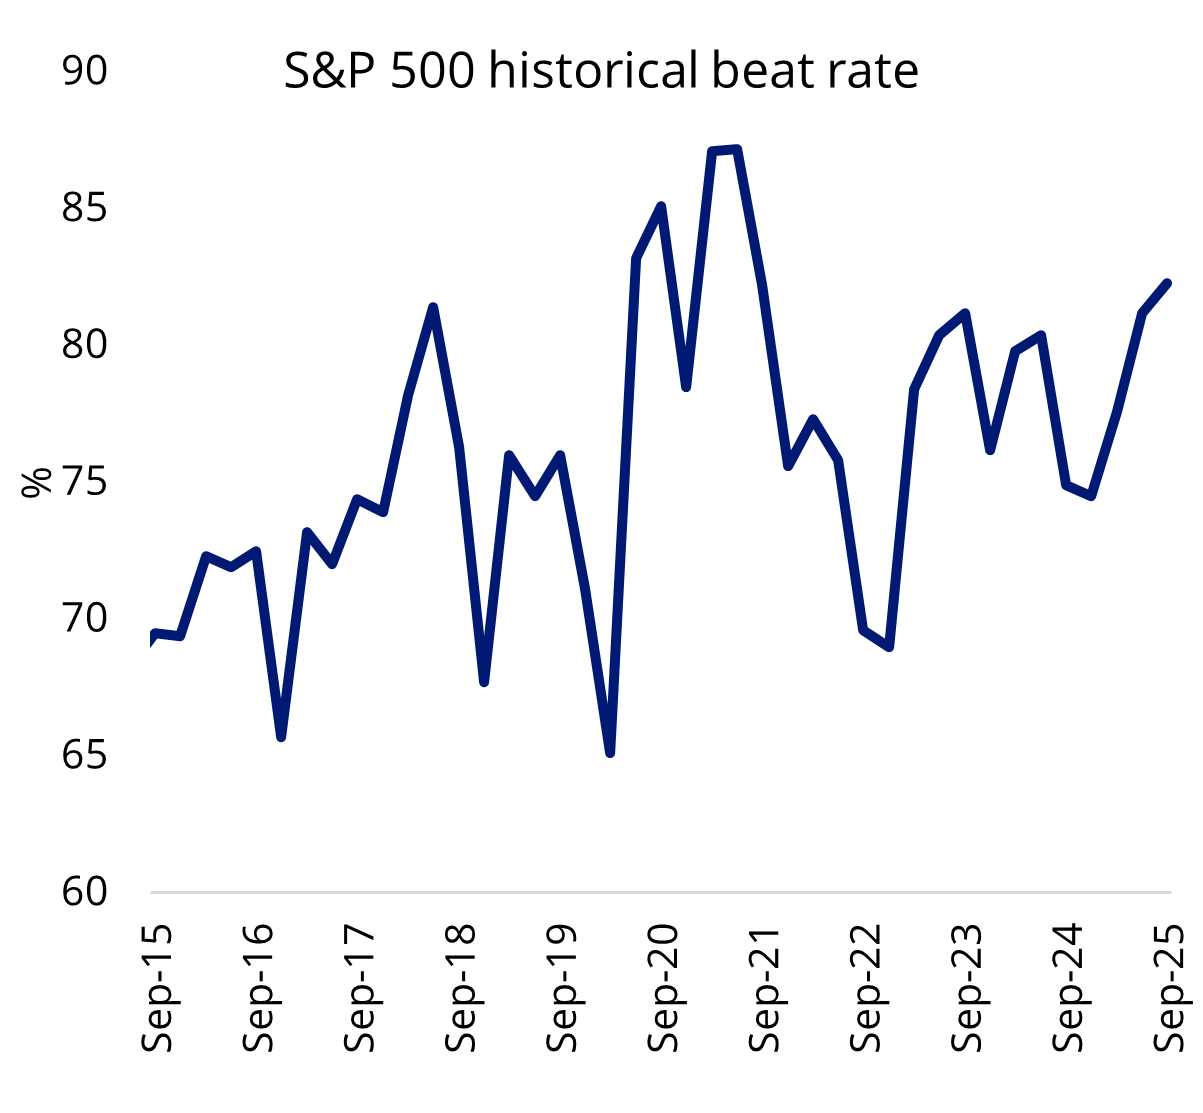
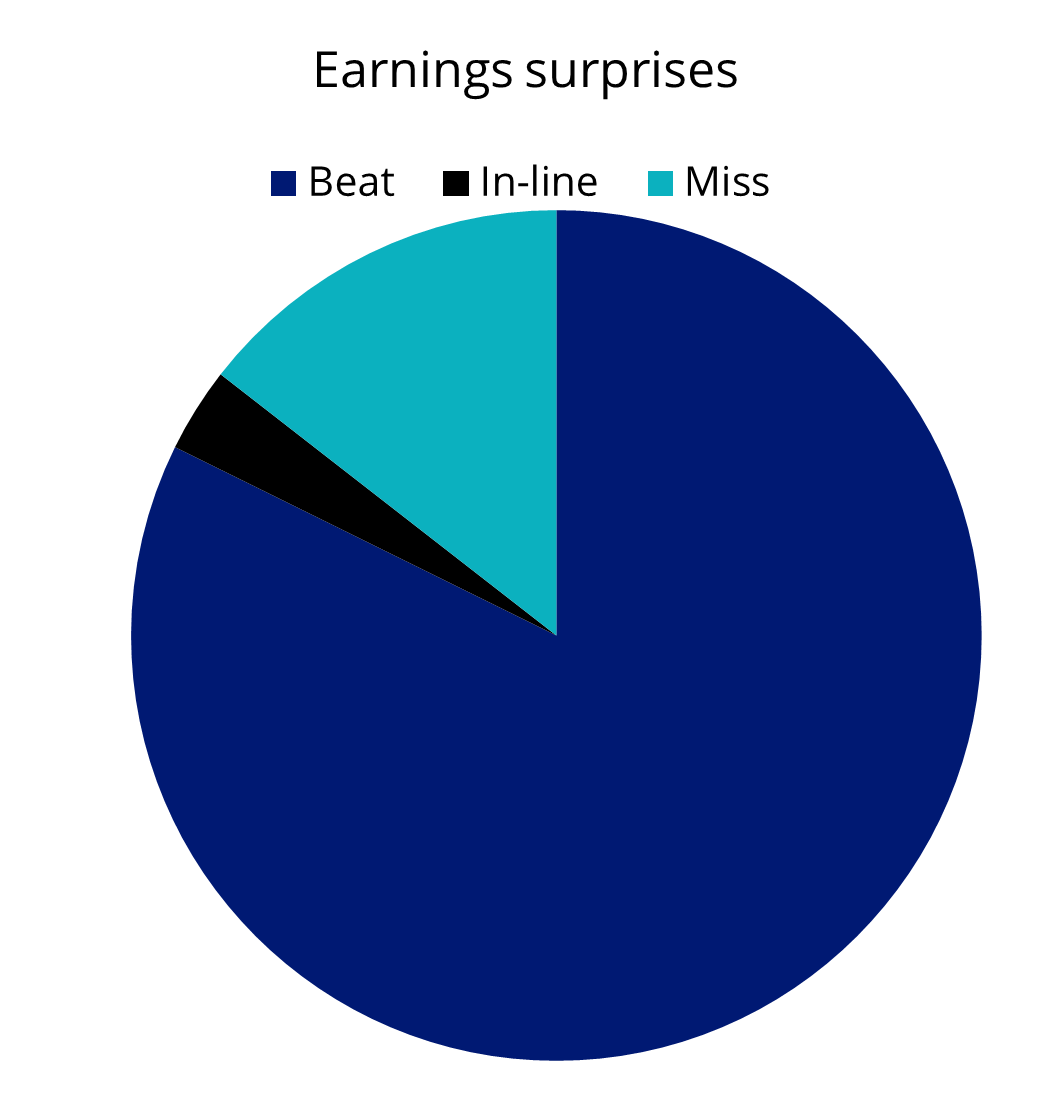
Source: VanEck. Bloomberg Intelligence. Date as of 5 November 2025.
However, it’s becoming clear that the bar for reward is rising, as investor caution grows amid stretched valuations. A modest EPS beat no longer guarantees a positive price reaction.
As shown in the chart below, while most companies have delivered upside surprises this earnings season, the S&P 500 index has on average, recorded a marginally negative one-day price reaction. Cyclical sectors such as financials and consumer discretionary have seen average price moves of around -1%, despite strong earnings surprises, reflecting a rollback of risk sentiment. Misses on EPS on average saw share prices drop more than 5%.
Chart 3: Q3 2025 earnings surprise vs 1-day price reaction - by sector
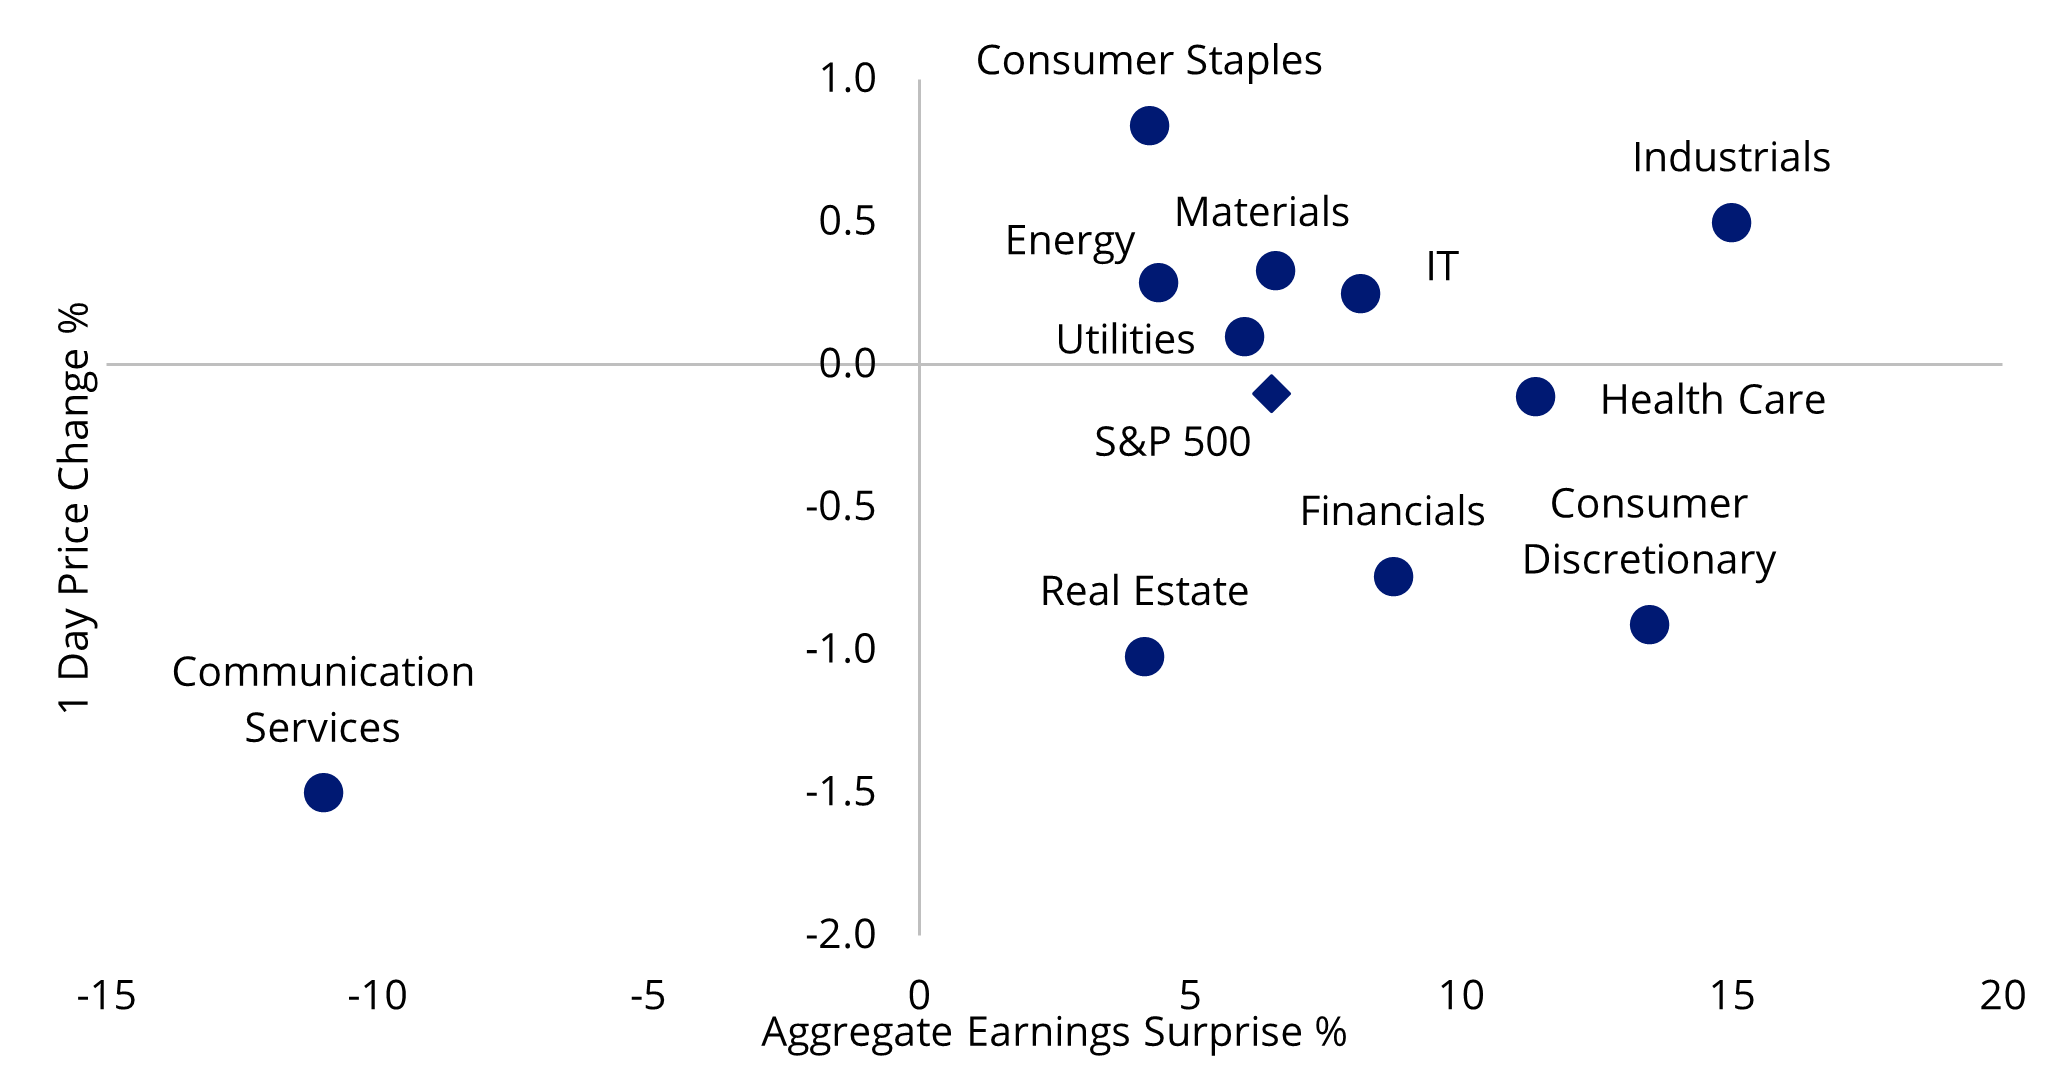
Source: VanEck. Bloomberg. Performance in USD. Sectors are represented by S&P 500 sector indices.
Chart 4: Earnings misses met with outsized price declines
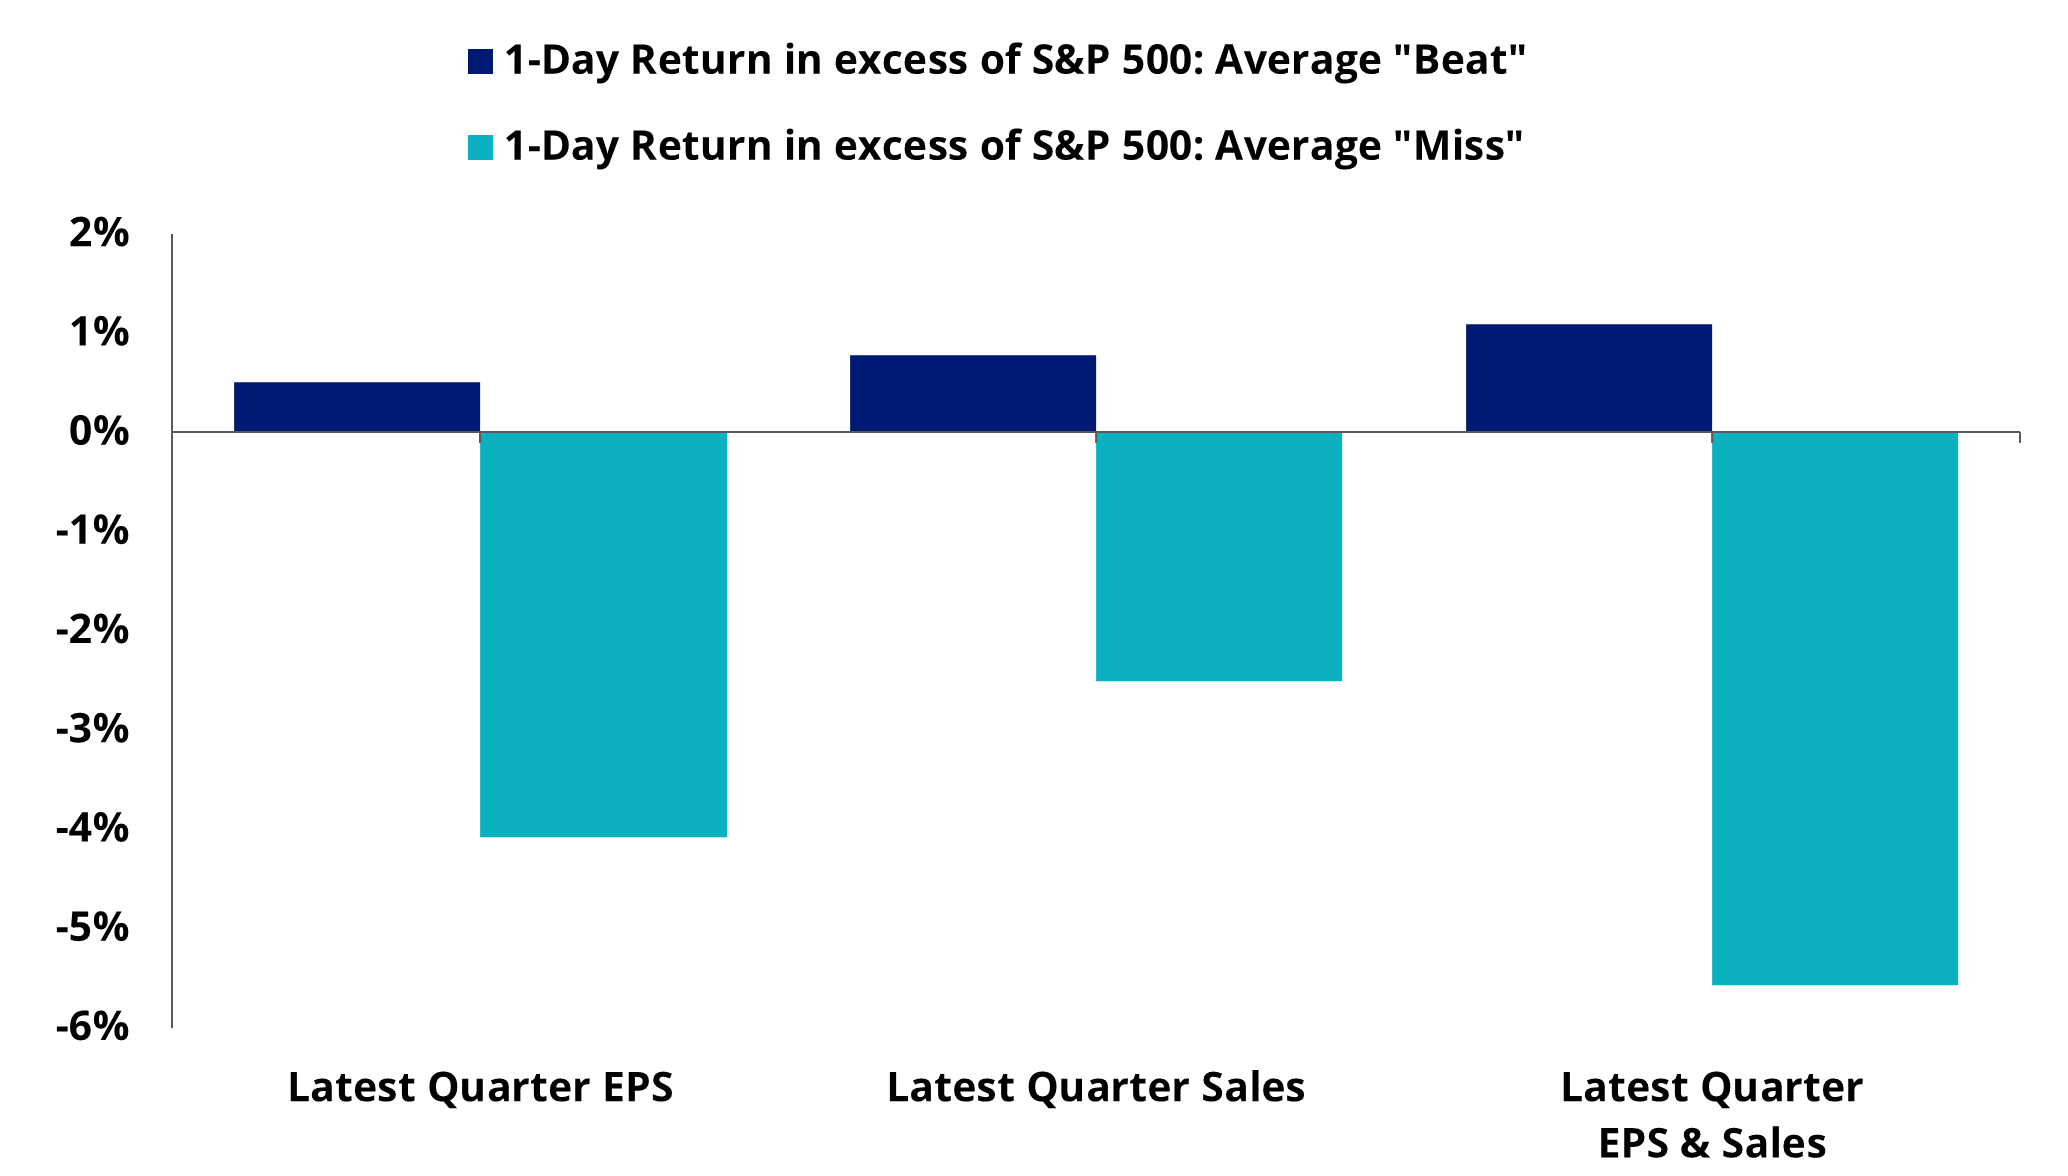
Source: VanEck. Bloomberg Intelligence. Date as of 31 October 2025. Performance in USD.
The view on AI capex has changed
Information technology was one of the standouts again, delivering a strong beat rate of ~89%, highlighting the sector’s broad-based strength driven by the ‘breakneck’ global AI race.
However, as the AI industry matures, the markets’ attitude towards AI capex appears to have shifted from ‘the more the merrier’ to ‘show me the money’. Even the most well-known companies saw share prices falling after announcing aggressive spending on AI without strong cash flows. Microsoft and Meta both reported solid results this quarter, but with a significant AI capex target for the rest of the year, investor concern over profitability outlook saw their prices fall post results by ~3% and ~11% respectively.
Chart 5: Sector breakdown of earnings
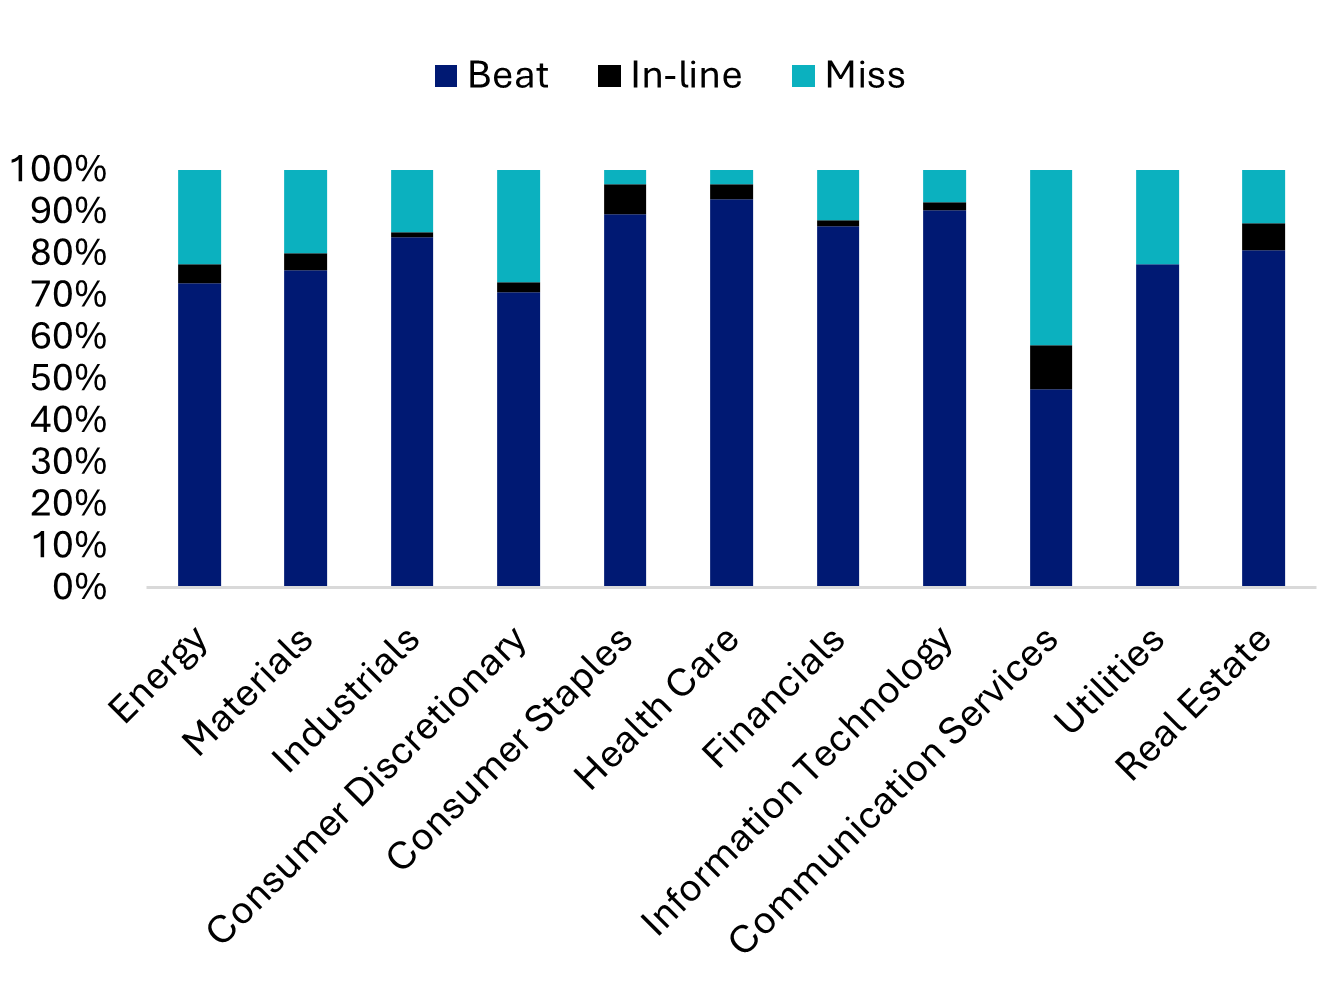
Source: VanEck. Bloomberg. Data as of 31 October 2025, in USD.
The tech rally since the tariff ‘Liberation Day’ has sent US tech valuations back to historical high levels. On a 12-month forward basis, the “Magnificent Seven” companies are trading at an average price-to-earnings (P/E) ratio of 36. Due to other names such as Palantir with stretched valuations, the S&P 500 Information Technology Index is trading at an average P/E ratio of approximately 37. This level of P/E means US tech players’ have a narrow margin of error.
Looking ahead, we see the broader AI thematic having a longer storyline, however the investment focus in markets is likely to shift toward rewarding those with ‘operational intelligence’, ie companies with high return on equity, robust earnings potential and strong balance sheets.
Chart 6: Tech valuations back to historical highs
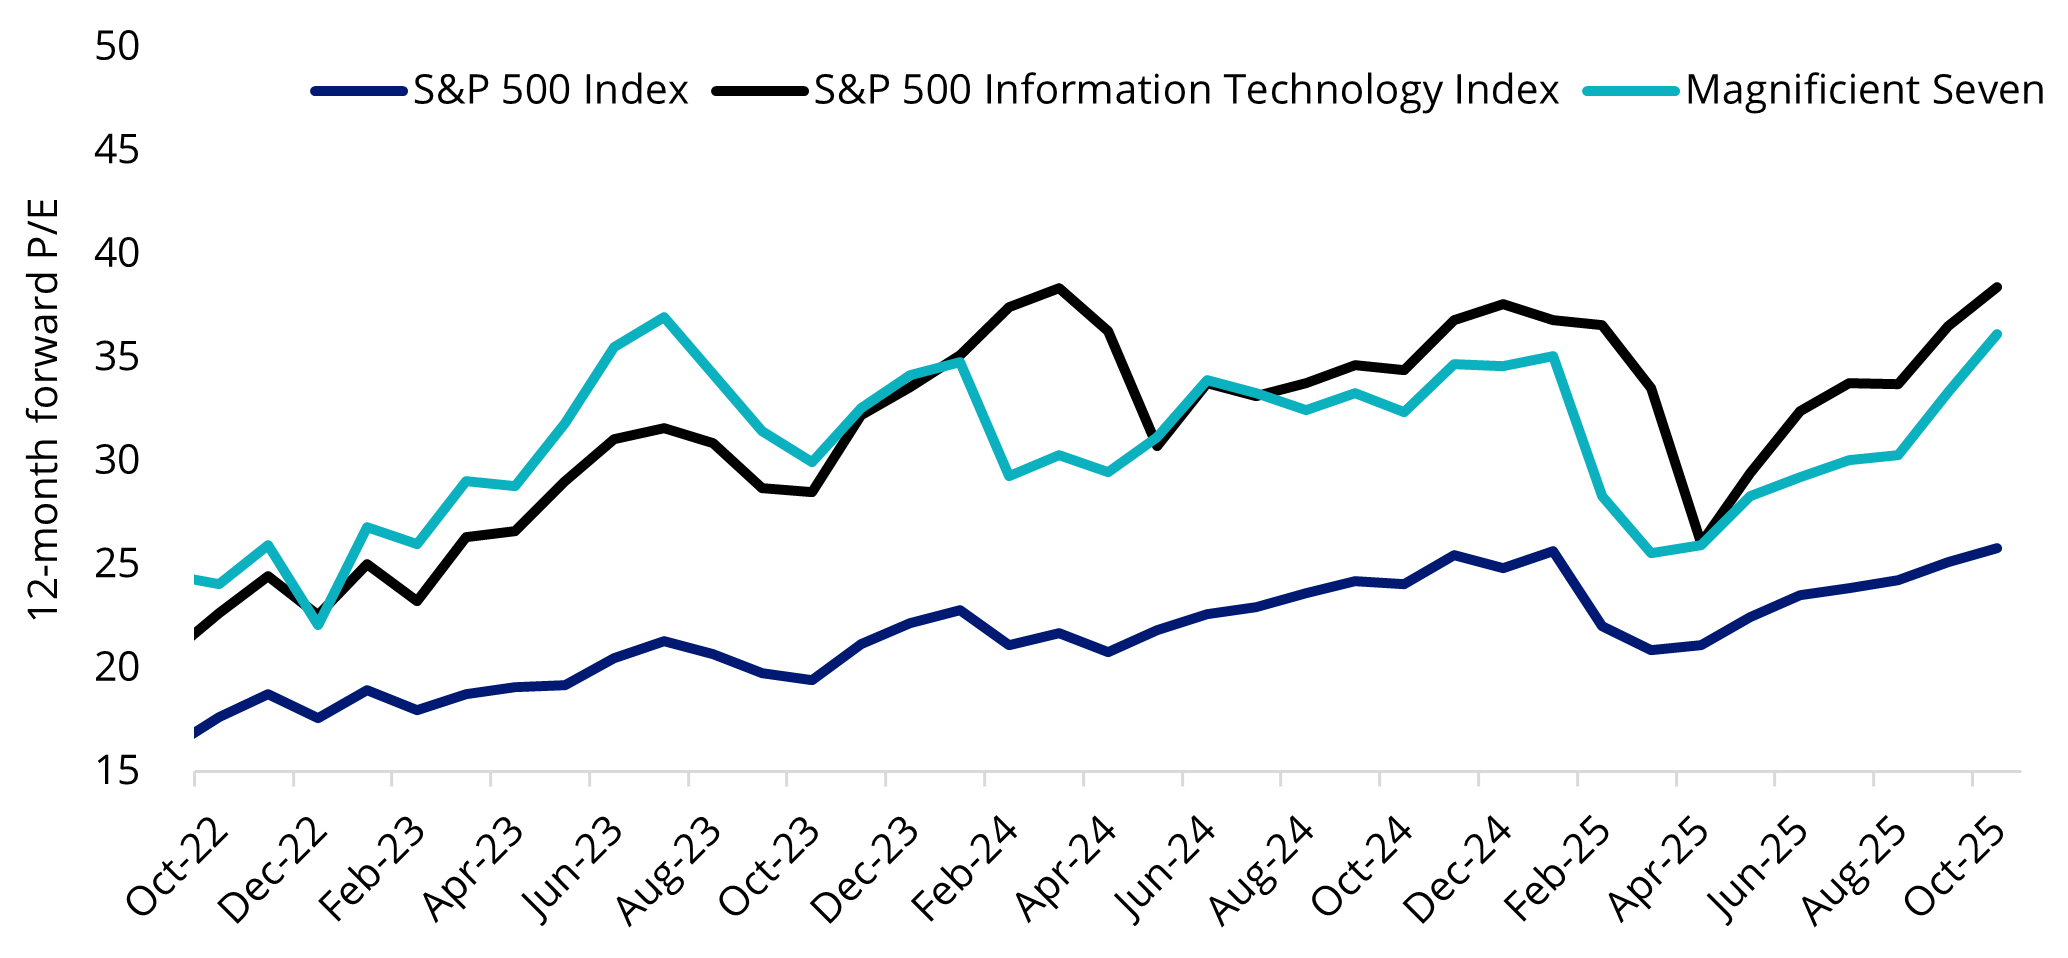
Source: Bloomberg. Magnificent Seven is Bloomberg Magnificent 7 Total Return Index. Date as of 31 October 2025.
Defensive sectors showed resilience
Despite tariff-driven headwinds, improving policy clarity and resilient demand have helped the health care sector turn a corner. With an aggregate beat rate of 93%, health care topped all sectors this earnings season.
From a price reaction standpoint, pharmaceuticals and biotech companies saw a higher average 1-day return (about 1%) post earnings compared to health care equipment makers, which may have been impacted by on-going tariffs on medical equipment.
Chart 7: Health care companies EPS surprises vs 1-day price reaction
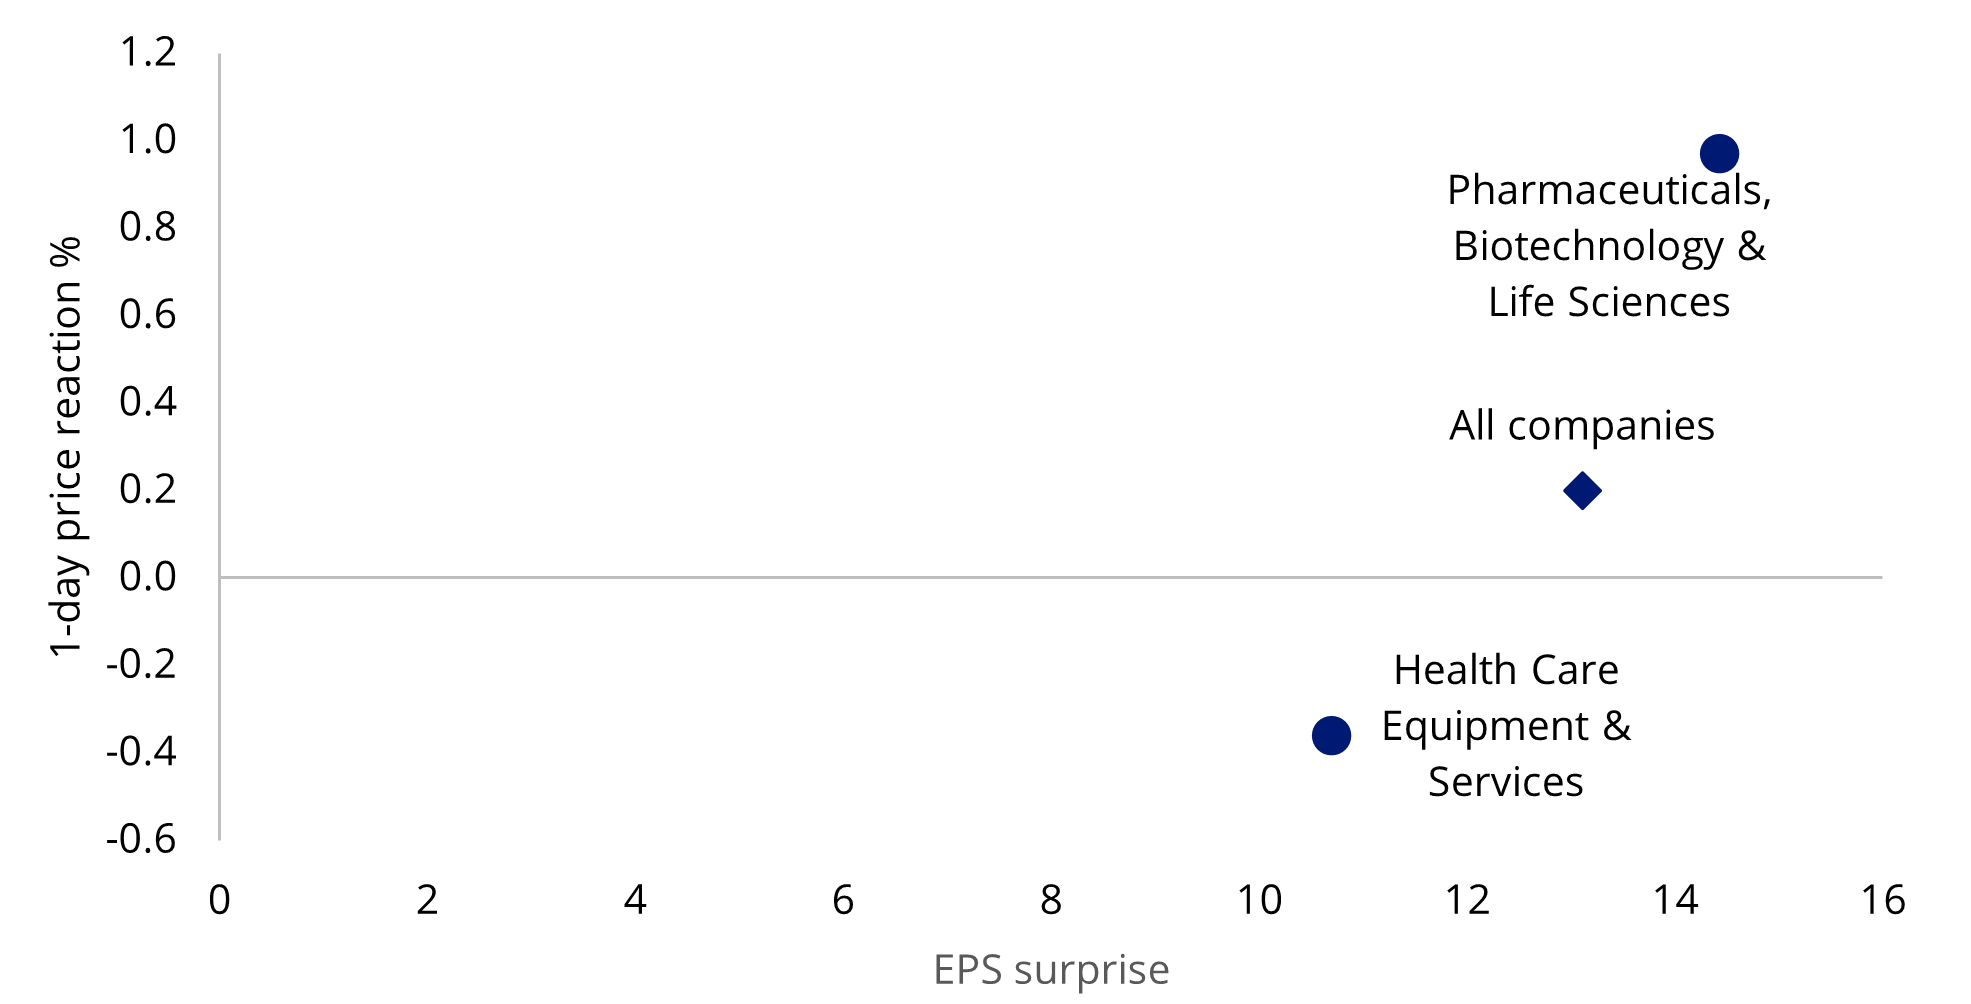
Source: VanEck. Bloomberg. Data as at 10 November 2025. In USD.
Consumer staples, also considered a defensive sector, followed health care with the second highest beat rate of ~89%.
Looking ahead – a tougher growth environment could be ahead
While earnings results overall were impressive, one area to watch closely is the potential flow-on effect of tariffs and the health of the US economy. US businesses have started to see cost pressures increase and activity slide. Additionally, with short-term inflation expectations[1] staying at levels seen in 2022 during the period of global central bank rate hikes, and with economists[2] forecasting weaker US GDP growth from 2025 to 2027, the broader US economic outlook could become less favourable for speculative assets and these elevated valuations, sparking a defensive rotation.
Chart 8: US ISM services activity vs price paid
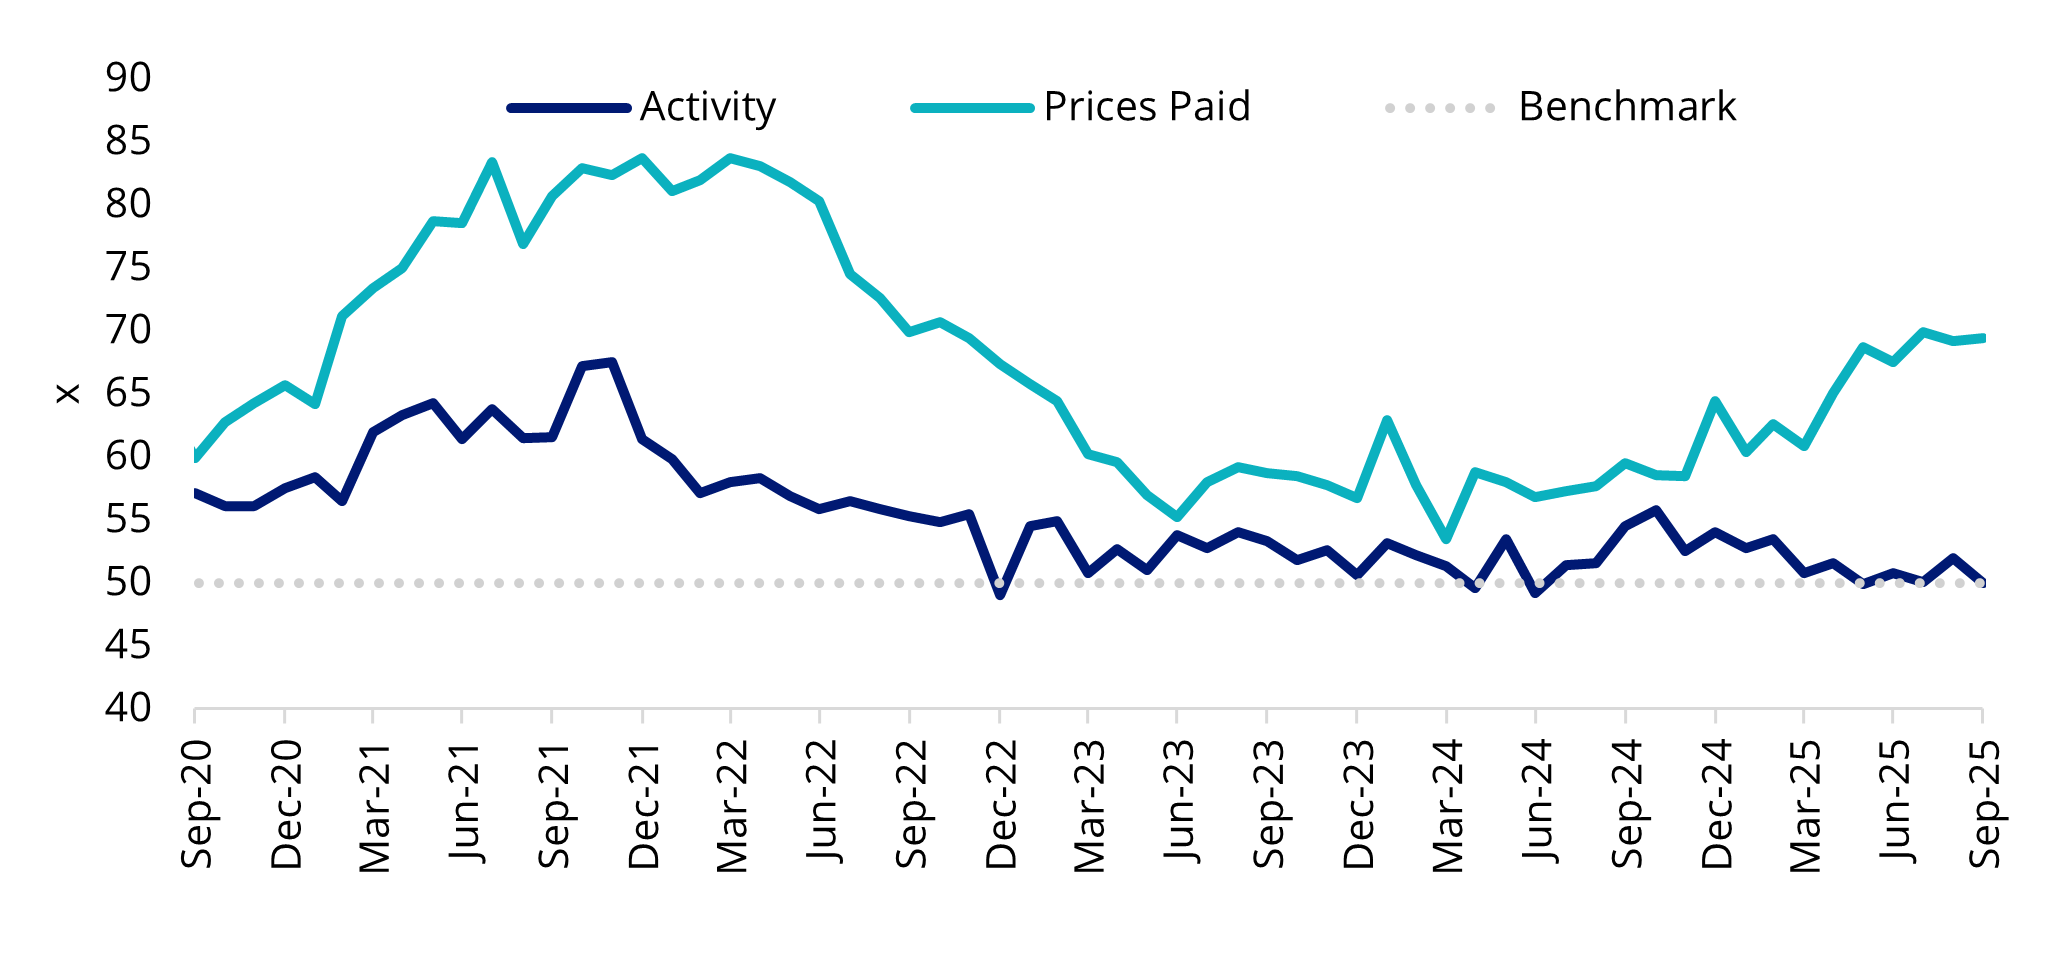
Source: VanEck. Bloomberg. ISM date as at 30 September 2025. Benchmark is the 50x neutral line, if activity index prints below 50, it indicates that economic activity is in contraction trajectory.
Savvy investors are ensuring they have quality companies in their portfolio to stabilise against potential macroeconomic turbulence. If the global economy falters and enters a recession, it could benefit quality companies, as these tend to offer investors relative protection during weaker economic environments and heightened market volatility. Additionally, research shows that quality companies show resilience by falling less in a downturn and recovering to previous highs quicker than other companies.
To prepare for the next cycle and capture international quality with one trade on the ASX, the VanEck MSCI International Quality ETF (QUAL) provides exposure to ~300 of the highest quality companies across geographies and sectors. As well as being overweight US equities relative to MSCI World ex Australia Index, QUAL is overweight health care and consumer staples relative to the US and international benchmarks.
Investors wishing to hedge their currency exposure can also consider the hedged version of QUAL, QHAL.
[1] University of Michigan 1- Year Inflation Expectations.
[2] Based on Bloomberg’s survey of as many as 84 economists conducted from 17-22 October 2025.
Key risks: An investment in our international quality ETF carries risks associated with: ASX trading time differences, financial markets generally, individual company management, industry sectors, foreign currency, country or sector concentration, political, regulatory and tax risks, fund operations and tracking an index. See the relevant PDS and TMD for more details.
QUAL and QHAL are likely to be appropriate for a consumer who is seeking capital growth, is intending to use the product as a major, core, minor or satellite allocation within a portfolio, has an investment timeframe of at least 5 years, and has a high risk/return profile.


Published: 21 November 2025
Any views expressed are opinions of the author at the time of writing and is not a recommendation to act.
VanEck Investments Limited (ACN 146 596 116 AFSL 416755) (VanEck) is the issuer and responsible entity of all VanEck exchange traded funds (Funds) trading on the ASX. This information is general in nature and not personal advice, it does not take into account any person’s financial objectives, situation or needs. The product disclosure statement (PDS) and the target market determination (TMD) for all Funds are available at vaneck.com.au. You should consider whether or not an investment in any Fund is appropriate for you. Investments in a Fund involve risks associated with financial markets. These risks vary depending on a Fund’s investment objective. Refer to the applicable PDS and TMD for more details on risks. Investment returns and capital are not guaranteed.