Growth in the AI value chain
There is no doubt that AI has been a key driver of markets since OpenAI released its ChatGPT to the public in November 2022. In 2023, the international benchmark, the MSCI World ex Australia, returned 23.87%, and in 2024, the index returned 31.77%. 2025 has also been a strong year, following a rough start, and it has returned 13.78% so far (to 31 October 2025, all performance data source: MSCI).
In the chart below, you can see that in late August and September, global equity markets pulled back marginally (not as bad as in Q1), as investors braced for this quarter's reporting season in the US, wary that valuations may not have been reflective of earnings.
Chart 1: MSCI World ex Australia Index performance 1 January 2023 to 31 October 2025
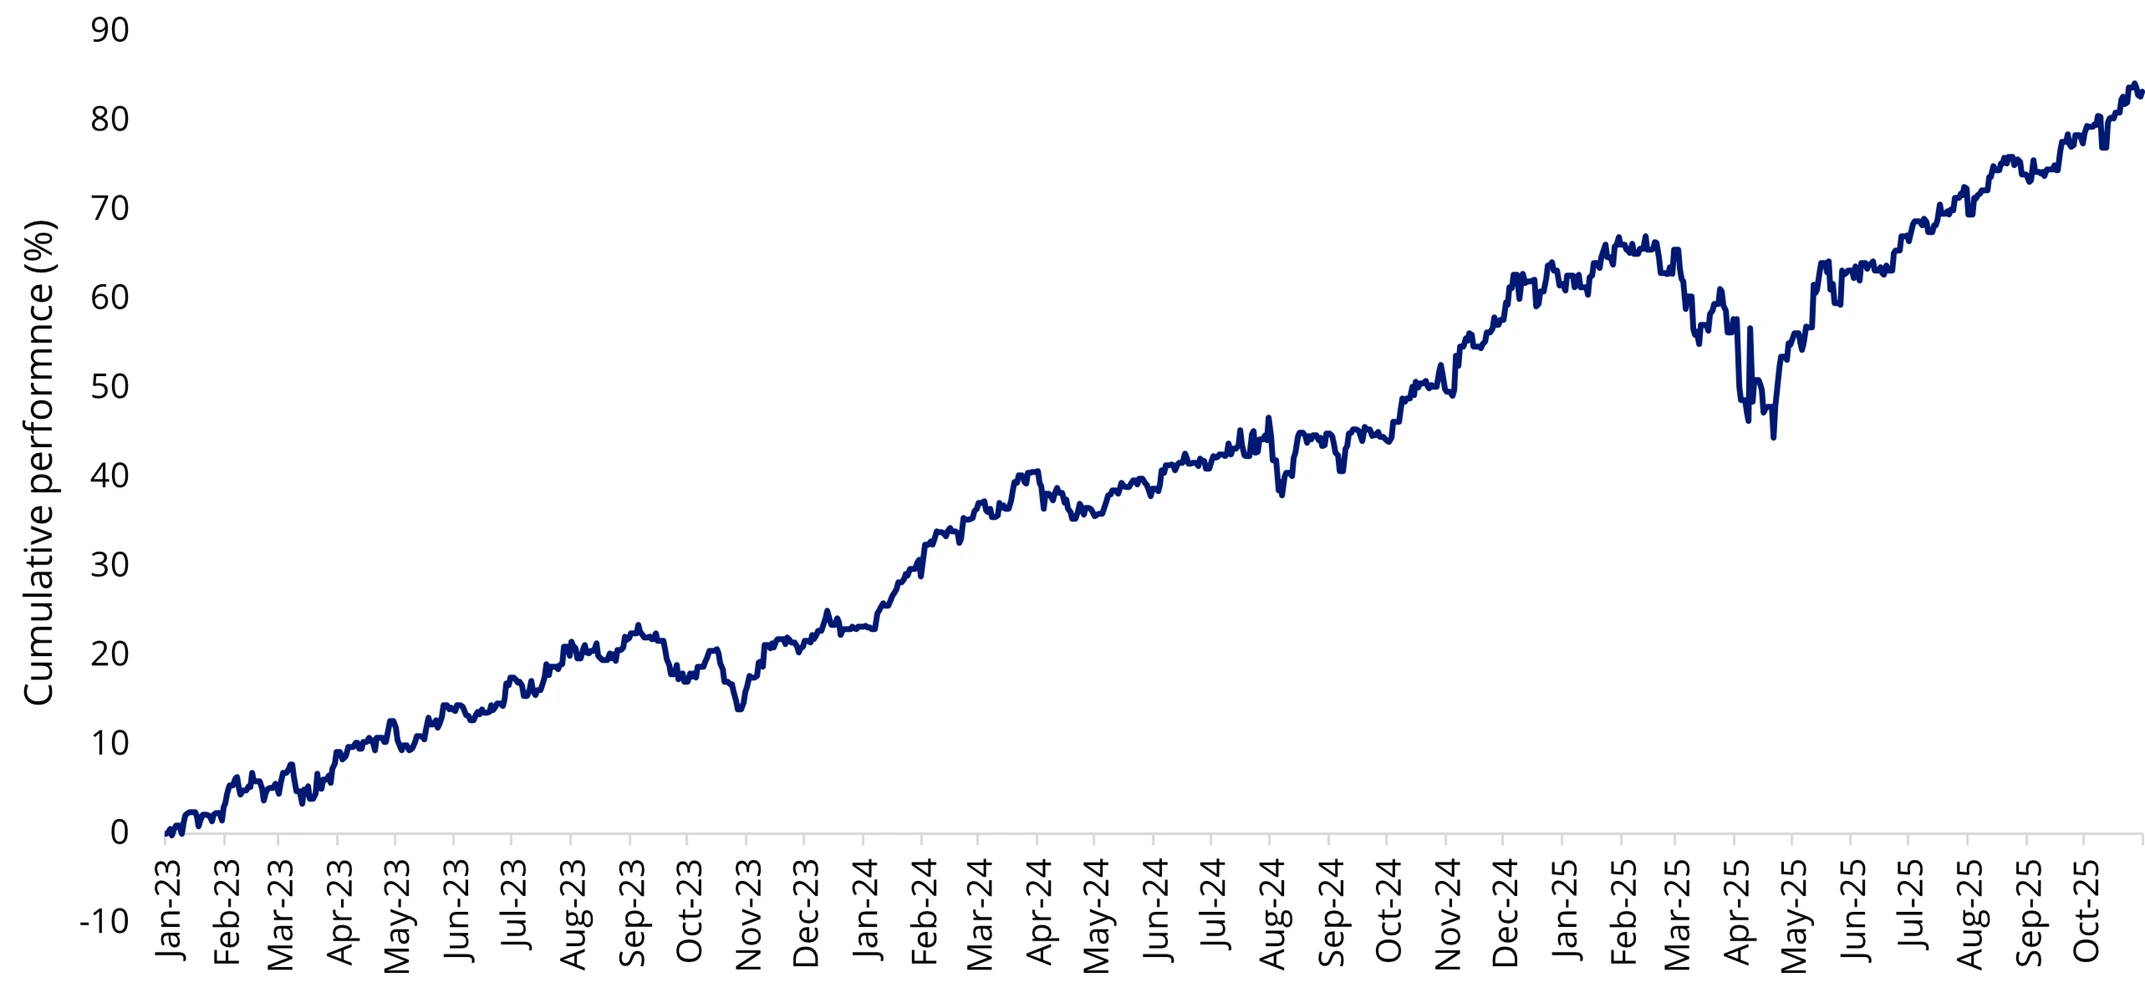
Source: Morningstar Direct. Past performance is not a reliable indicator of future performance.
Companies and industries in the AI value chain have been key beneficiaries. For example, three companies we think stood out were:
- Caterpillar, which produces engines that support the powering of intensive AI-driven operations.
- CrowdStrike, which utilises real-time AI agents to stress test its cybersecurity infrastructure.
- Vertiv Holdings, which ensures power, cooling, and monitoring of AI systems.
- Caterpillar reported record quarterly sales and revenues of $17.6 billion, up 10% year-over-year, driving shares to rise 12% after the results announcement.
- CAT is viewed as a beneficiary of the US construction cycle recovery and cost inflation, as its customers in mining and oil/gas are better off and looking to spend more on equipment.
- Additionally, it is seeing increasing demand for data centres and prime power applications, driving strong growth momentum in the Energy & Transportation segment. There was a 31% year-on-year increase in sales of power generators, mostly to AI data-centre developers, that pushed up engine-segment sales and profit.
- CrowdStrike's share price increased 4.5% on the NVIDIA partnership announcement. The company utilises real-time AI agents to stress test its cybersecurity infrastructure, powered by NVIDIA GPUs.
- Analysts believe the company can deliver FCF margins of 30% or better in the years ahead and has consistently been able to deliver fundamental improvement ahead of expectations.
- CrowdStrike's sales cycle appears to be stabilising with potential for accelerated net new annual recurring revenue growth driven by its expanded platform and AI offerings.
- Vertiv reported third quarter net sales of USD$2,676 million, an increase of 29% compared to the prior year, driven by 43% growth in Americas and 20% growth in APAC, which was received very favourably.
- Vertiv's alignment with Nvidia on 800V DC secures long-term growth, positioning it as a key enabler of AI factories.
These companies are poised, we think, for rapid earnings growth.
Chart 2: Earnings growth – high and rising
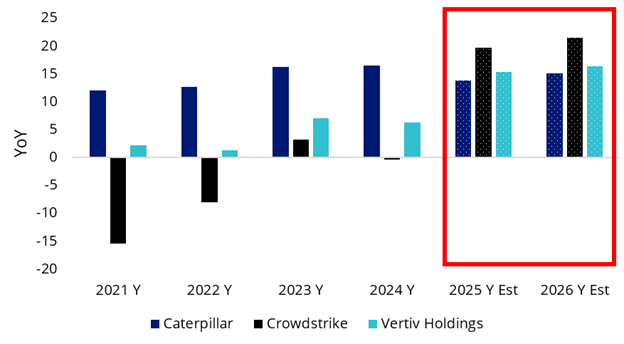
Source: Bloomberg, Growth rates for 2025-26 are estimates only and cannot be guaranteed.
AI investment has unlocked further growth potential for many companies, which is a key takeaway from the Q3 2025 US earnings update. And growth companies are beneficiaries.
Reflective of the growth market, companies in the VanEck MSCI International Growth ETF (ASX: GWTH) have reported more net beats. They have also reported higher trailing and forward EPS growth.
Chart 3: Net beats
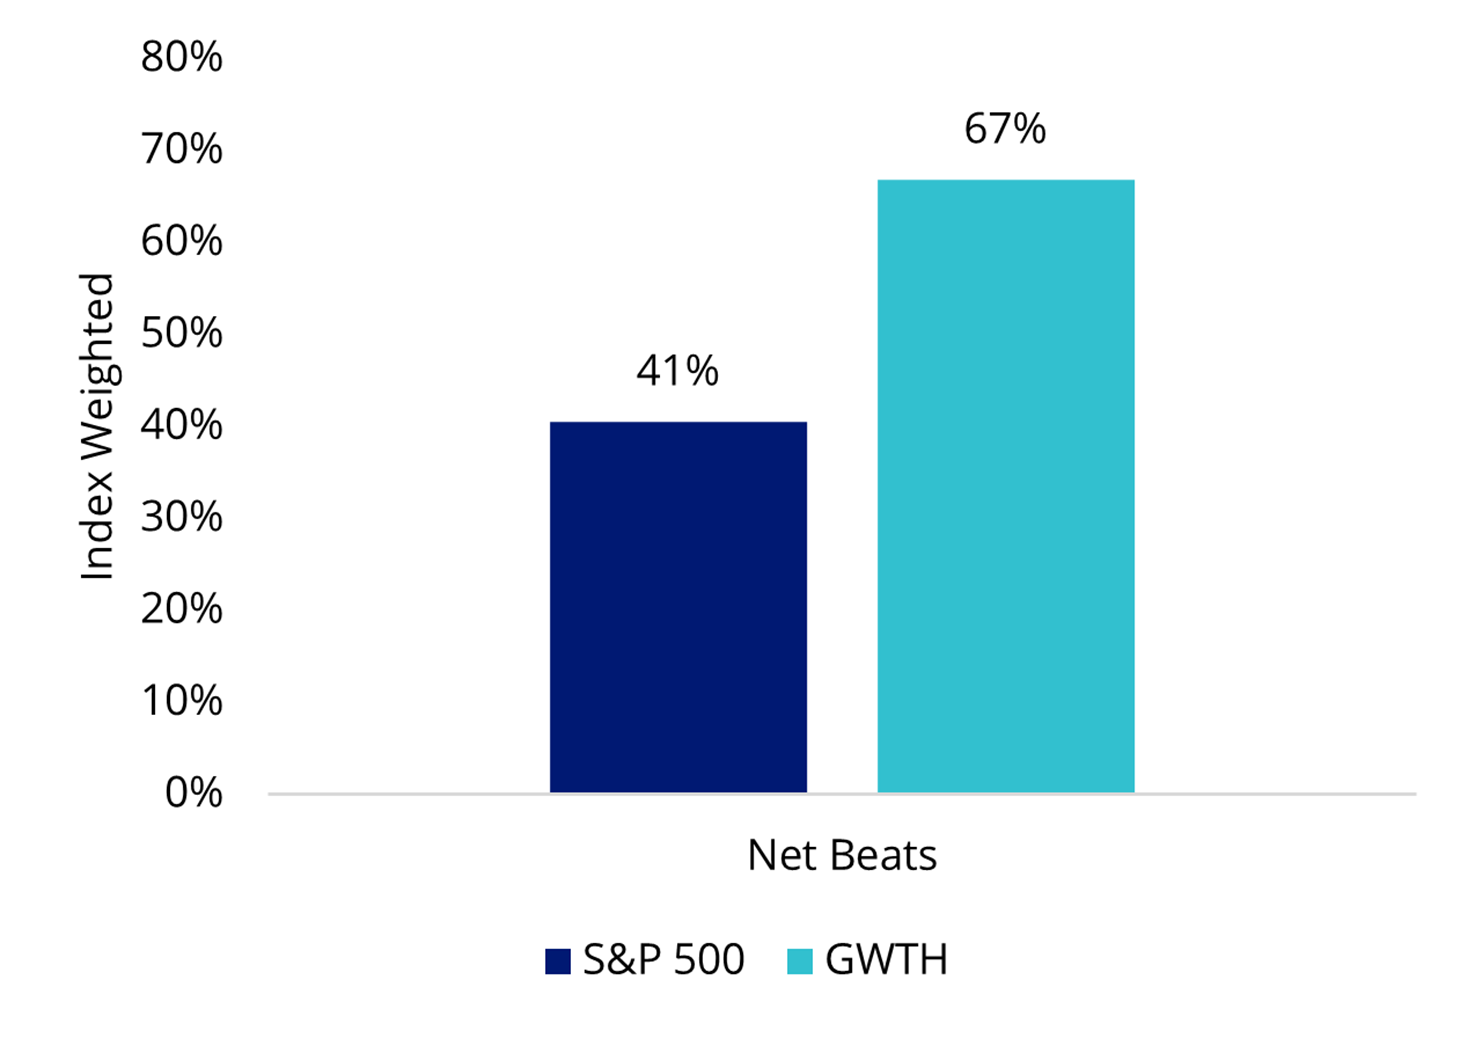
Source: Bloomberg, MSCI, VanEck, 4 November 2025.
Table 1: Fundamental growth data
| GWTH | MSCI World ex Aus | |
| Return on equity (ROE) | 22.01 | 16.11 |
| Long-term historical earnings per share (EPS) growth | 40.04 | 18.30 |
| Short-term forward EPS growth | 21.21 | 12.06 |
| Long-term forward EPS growth | 23.76 | 14.41 |
Source: FactSet, MSCI as at 31 October 2025. Past performance is not a reliable indicator of future performance.
GWTH tracks the MSCI World ex Australia Growth Select Index (GWTH Index), and the charts below highlight that these growth characteristics have been growing faster in the companies in GWTH’s index than in the broader market.
Chart 4: 12 month trailing EPS
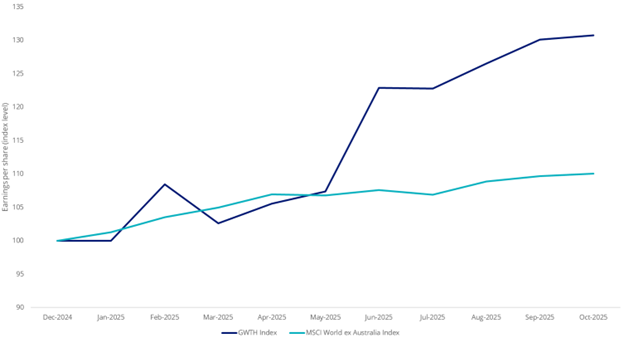
Source: MSCI as at 31 October 2025. Past performance is not a reliable indicator of future performance of the index or GWTH. You cannot invest in an index.
Chart 5: Year-on-year 12-month trailing EPS growth
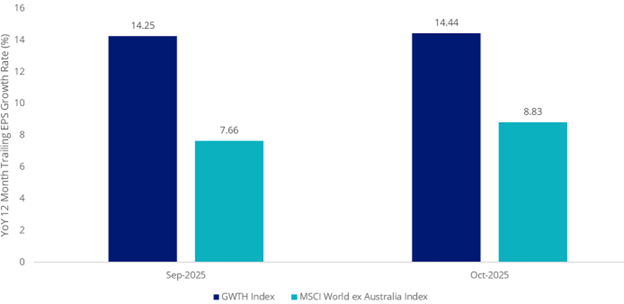
Source: MSCI as at 31 October 2025. Past performance is not a reliable indicator of future performance of the index or GWTH. You cannot invest in an index.
A new way to access growth
Traditionally, ‘growth’ has been the domain of active managers. Growth investing is a well-known strategy, but it is also a strategy associated with high volatility. Active growth managers can turbo-charge the returns of a portfolio one year, only to weigh a portfolio down in another.
Investing with a skilful ‘growth’ active manager, who is selective and curates their portfolio, has been rewarding for investors, irrespective of the era. Growth investing focuses on identifying companies poised for rapid revenue and earnings expansion, often driven by innovation, market disruption or evolving consumer preferences.
VanEck has a distinguished history of harnessing technological advancement and advanced analysis to identify and unlock opportunities for Australian investors. For over a decade, we have pioneered smart beta ETF strategies in Australia, with a vast number of our smart beta ETFs being the first of their kind on the ASX, offering investors the ability to construct portfolios with a targeted outcome in mind.
It is with this mindset that we contemplated the growth factor and a selective, systematic approach.
The result is GWTH, which started trading on ASX in August. GWTH invests in around 100 international companies that have been selected, according to MSCI, as being among the top companies based on:
- Long-term forward earnings-per-share (EPS) growth rate
- Short-term forward EPS growth rate
- Current internal growth rate
- Long-term historical EPS growth trend
- Long-term historical sales-per-share growth trend
Based on back testing, the GWTH Index net of GWTH’s 0.40% p.a. management fee displays strong long-term performance, as highlighted by the chart below. Noting that the past performance of the index should not be relied upon as an indication of future performance of GWTH.
Chart 6: Modelled calendar year performance: GWTH’s index after fees
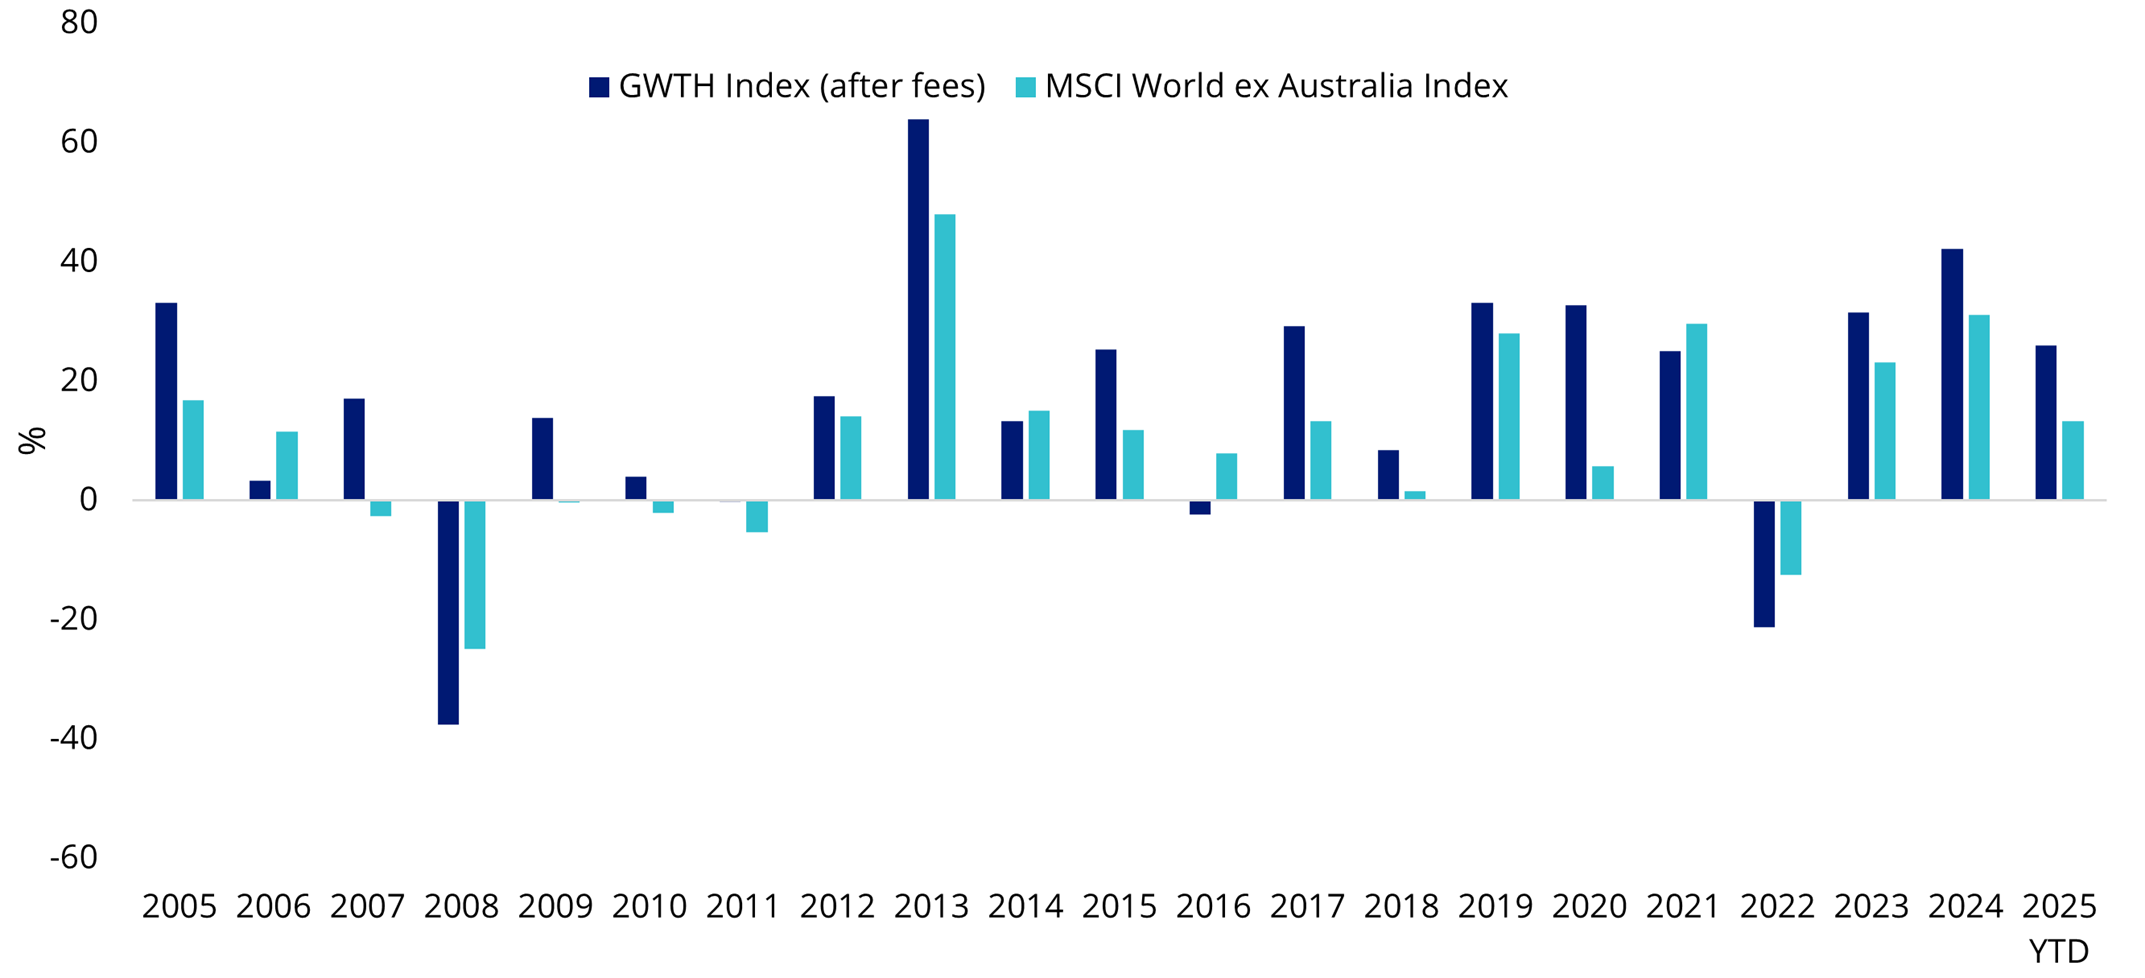
Table 2: GWTH and modelled GWTH Index after fees and MSCI World ex Australia Index as at 31 October 2025
| 1 month (%) | Since GWTH inception date# (%) | YTD (%) | 1 year (%) | 3 years (% p.a.) | 5 years (% p.a.) | 10 years (% p.a.) | 15 years (% p.a.) | 20 years (% p.a.) | |
| GWTH# | 4.81 | 8.48 | |||||||
| GWTH Index (net for GWTH management costs)* | - | - | 26.01 | 40.77 | 31.22 | 19.77 | 18.61 | 20.03 | 14.61 |
| MSCI World ex Australia Index | 3.32 | 4.56 | 13.37 | 22.32 | 20.89 | 17.30 | 12.82 | 14.07 | 9.51 |
| Difference | +1.49 | +3.92 | +12.64 | +18.45 | +10.33 | +2.47 | +5.79 | +5.96 | +5.10 |
Chart 6 and Table 2: source: VanEck, Morningstar, Bloomberg, as at 31 October 2025.
#GWTH inception date is 26 August 2025 and a copy of the factsheet is here.
* GWTH Index base date is 31 May 1998. GWTH Index results are net of GWTH’s 0.40% p.a. management costs, calculated daily but do not include brokerage costs or buy/sell spreads of investing in GWTH. You cannot invest in an index. GWTH Index performance prior to its launch on 18 August 2025 is simulated based on the current index methodology. Past performance is not a reliable indicator of future performance.
Chart 6 and Table 2 are hypothetical comparisons of the performance of the GWTH Index and the MSCI World ex Australia Index (“Parent Index”). Chart 6 contains returns for the past 20 calendar years, and Table 2 contains annualised performance data. The Parent Index is shown for comparison purposes as it is the widely recognised benchmark used to measure the performance of developed market large- and mid-cap companies, weighted by market capitalisation. The GWTH index measures the performance of approximately 100 companies selected from the Parent Index based on MSCI growth descriptors. Consequently, the GWTH Index has fewer companies and different country and industry allocations than the Parent index.
Key risks: GWTH invests in international markets, which have specific risks that are in addition to the typical risks associated with investing in the Australian market. These include foreign currency, ASX trading time differences, country or sector concentration, political, regulatory and tax risks. The PDS and TMD detail the key risks.
GWTH is likely suitable for an investor seeking capital growth, who intends to use it as a major, core, minor or satellite allocation within a portfolio, has an investment timeframe of at least five years, and has a high risk/return profile.


Published: 09 November 2025
Any views expressed are opinions of the author at the time of writing and is not a recommendation to act.
VanEck Investments Limited (ACN 146 596 116 AFSL 416755) (VanEck) is the issuer and responsible entity of all VanEck exchange traded funds (Funds) trading on the ASX. This information is general in nature and not personal advice, it does not take into account any person’s financial objectives, situation or needs. The product disclosure statement (PDS) and the target market determination (TMD) for all Funds are available at vaneck.com.au. You should consider whether or not an investment in any Fund is appropriate for you. Investments in a Fund involve risks associated with financial markets. These risks vary depending on a Fund’s investment objective. Refer to the applicable PDS and TMD for more details on risks. Investment returns and capital are not guaranteed.
GWTH is not sponsored, endorsed, or promoted by MSCI, and MSCI bears no liability with respect to GWTH, or respective Index, or Parent Index. The PDS contains a more detailed description of the limited relationship MSCI has with VanEck and GWTH.