Australian equity beta with smarts
Australian investors have long had an affinity for domestic equities. According to IMF’s Coordinated Portfolio Investment Survey, only the US has a more significant home country bias. Australia’s propensity was reflected in 2016’s ASX ETP flows. The other notable data in the 2016 exchange traded product flows is that smart beta ETFs are gaining popularity among Australian investors.
Both trends are likely to continue as a number of Australian equity smart beta ETFs outperformed in 2016 and are well positioned for 2017.
Australian investors have typically had a strong preference for investing locally in Australian equities. This was particularly the case in 2016 when Australian equity ETP inflows reached A$1.04 billion, exceeding international equity ETP inflows of A$967 million for the first time in several years.1
Ongoing global market volatility as a result of rising protectionism and anti-establishment sentiments around the world has especially fuelled Australians’ love affair with local equities since the second half of 2016.
Another trend in 2016 was the rise of investment in smart beta strategies. Smart beta ETFs accounted for almost 20% of total Australian ETP inflows in 2016, including into Australian equities. Savvy investors are increasingly recognising that alternative index approaches can provide better targeted outcomes and higher returns in an increasingly volatile and uncertain world.
Smart beta offers investors the best of both active and passive approaches. Smart beta has the potential for outperformance2 like an active strategy while providing the low cost, transparent and rules based attributes of a passive strategy. Examples of smart beta strategies include alternative weighting, such as equal weight, or factor and multi factor strategies. Examples of widely used factors are quality (financially strong companies) and value (inexpensive companies).
The proof is in the pudding. Below are two Australian equity smart beta ETFs which outperformed in 2016 and are well positioned for 2017.
Australian Equity
The Australian equity market is one of the most concentrated equity markets in the developed world. The standard benchmark, the S&P/ASX 200, is the most commonly used market capitalisation index by Australian equity active managers. However the index is dominated by the top 10 companies which make up over 55% of the index, including the big four banks. An equal weight strategy avoids this concentration by equally weighting all stocks in its index.
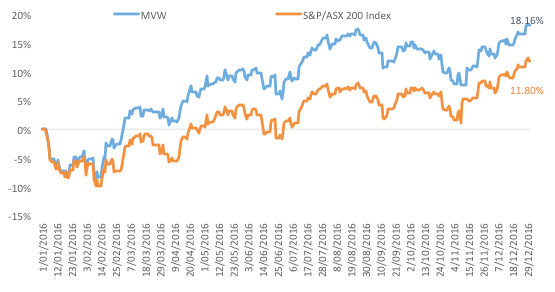
VanEck’s Australian Equal Weight ETF (ASX code: MVW) is the only ETF in Australia that adopts an equal weight approach. In 2016 MVW returned 18.16%, outperforming the S&P/ASX 200 Index by 6.37%.
MVW Performance 1 January 2016 – 31 December 2016
 Source: Morningstar Direct, as at 31 December 2016. Results are calculated daily to the last business day of the month and assume immediate reinvestment of all dividends. MVW results are net of management costs but do not include brokerage costs of investing in MVW. Past performance is not a reliable indicator of future performance.
VanEck’s Equal Weight strategy ranked 8th out of 96 'long only' Australian equity funds in Mercer’s annual fund manager league table in 2016. This is a remarkable result for a passive strategy and affirms a smart beta investment approach.
Since its launch in March 2014 it has outperformed the S&P/ASX 200 Index by 4.30% p.a.
MVW performance
 Inception date is March 4, 2014.
Source: Morningstar Direct, as at 31 December 2016. Results are calculated daily to the last business day of the month and assume immediate reinvestment of all dividends. MVW results are net of management costs but do not include brokerage costs of investing in MVW. Past performance is not a reliable indicator of future performance.
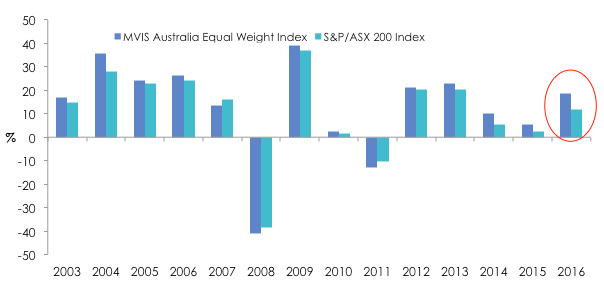
The index MVW tracks has now outperformed in 11 of the past 14 calendar years including the last five in a row.
Annual Returns of MVIS Australia Equal Weight Index vs S&P/ASX Index 2003 to 2016
 Source: VanEck, FactSet, as at 31 December 2016. Results are calculated to the last business day of the month and assume immediate reinvestment of all dividends and exclude costs associated with investing in MVW. You can’t invest directly in an index. Past performance of MVW’s Index is not a reliable indicator of future performance of MVW.
There is plenty of academic and commercial research that supports equally weighting. It has been shown that equal weighting outperforms market capitalisation because:
- it provides exposure away from mega and larger caps
- it provides exposure to value (inexpensive stocks) and
- of its contra trading strategy (frequently taking profits from winners and adding to losers at prescribed intervals to maintain equal weighting).
Australian Small Companies
Where active management once ruled, more and more active managers are falling behind the small caps index. The latest S&P Dow Jones SPIVA® Australia Scorecard released in July 2016 found that over half of Australian equity mid and small-cap funds lagged the S&P/ASX Mid-Small Index over the past one and three years. This trend appears to have continued even though small companies had their strongest calendar year return since 2007.
In 2016 small resource companies, coming out of the worst commodity bear market in history surged compared to other sectors.
2016 Small Companies returns
 Source: Morningstar Direct, as at 30 December 2016.Results are calculated daily and assume immediate reinvestment of all dividends. You cannot invest directly in an index. Past performance is not a reliable indicator of future performance.
The surge of resource companies caught many small cap ‘stock pickers’ by surprise. Over 75% of managers in the Morningstar Mid/Small Cap universe underperformed the S&P/ASX Small Ordinaries Index in 2016. Over the same period VanEck Vectors Small Cap Dividend Payers ETF ( MVS), a low fee, passive smart beta ETF, outperformed.
MVS vs Morningstar Open Ended Equity Australia Mid/Small Universe
 Source: Morningstar Direct, as at 30 December 2016. Net performance results are calculated daily and assume immediate reinvestment of all dividends and exclude costs associated with investing in MVS. Past performance is not a reliable indicator of future performance. Morningstar Open Ended Equity Australia Mid/Small Universe includes Australian Australia Mid/Small Blend, Australia Mid/Small Growth and Australia Mid/Small Value and is based on the defined universe funds that invest primarily in Mid/Small Australian companies. Stocks in the bottom 30% of the Australian equities market based on market cap are defined as ‘small’. The ‘blend’ style is assigned to portfolios where neither growth nor value characteristics dominate.
MVS exhibits a quality and value bias relative to the S&P/ASX Small Ordinaries index due to its screens for inclusion. The screens are:
- Liquidity - Holdings in MVS must pass MV Index Solution’s stringent size and liquidity screens so illiquid stocks are avoided; and
- Dividends - Screening for dividend payers helps identify more stable businesses as companies that pay dividends are typically profitable with robust balance sheets and strong cash flows.
Smart beta investing on the rise
There are a number of risks which could surface in 2017 resulting in ongoing market volatility, particularly as the new Trump administration unveils its new policies. Smart beta strategies are proving their worth by helping investors to navigate the landscape and achieve their investment goals.
IMPORTANT NOTICE: Issued by VanEck Investments Limited ABN 22 146 596 116 AFSL 416755 (‘VanEck’). This is general information only and not financial advice. It does not take into account any person’s individual objectives, financial situation or needs. Before making an investment decision, you should read the relevant PDS and with the assistance of a financial adviser consider if it is appropriate for your circumstances. PDSs are available at www.vaneck.com.au or by calling 1300 68 38 37.
MVIS Australia Equal Weight Index (‘MVIS Index’) is the exclusive property of MV Index Solutions GmbH based in Frankfurt, Germany (‘MVIS’). MVIS makes no representation regarding the advisability of investing in the Fund. MVIS has contracted with Solactive AG to maintain and calculate the MVIS Index. Solactive uses its best efforts to ensure that the MVIS Index is calculated correctly. Irrespective of its obligations towards MVIS, Solactive has no obligation to point out errors in the MVIS Index to third parties.
No member of VanEck group of companies gives any guarantee or assurance as to the repayment of capital, the payment of income, the performance, or any particular rate of return of any VanEck funds. Past performance is not a reliable indicator of future performance.
Australian domiciled ETFs: VanEck is the responsible entity and issuer of units in the Australian domiciled VanEck Vectors ETFs traded on ASX under codes FDIV, IFRA, MVA, MVB, MVE, MVR, MVS, MVW and QUAL.
1ASX defines “ETP” as all investment products on exchange including exchange trade funds (ETFs). As of 31 December 2016 ETFs made up just over 90% of total ETP assets.
2against standard market benchmarks
Published: 09 August 2018


