Being smart-er with beta
A flood of money has rushed into smart beta ETFs in recent years, which now hold a total of US$800 billion in assets globally as of year-end 2018, according to Morningstar data. This represents a growth rate of roughly 30% per year since 2012. The challenge for investors is to do it smarter.
Many investors diversify across asset classes in designing their portfolios to attain a future need. In the 1986 article “Determinants of Portfolio Performance”, Brinson et al, demonstrated that the asset allocation decision was responsible for 93.6% of a diversified portfolio's return pattern over time. Subsequent studies have confirmed this (Donaldson et al, 2013). The asset allocation decision is responsible for around 90% of portfolio movements, while the remaining 10% comes from security selection and market-timing.
An informed understanding of risk and return of the various asset classes is important to the portfolio construction process. VanEck has partnered with Lonsec Investment Solutions Pty Ltd (Lonsec) to provide three low-cost model portfolios comprised entirely of ETFs. Information on these can be found here: https://www.vaneck.com.au/etf-model-portfolios
VanEck ETF Model Portfolios are powered by Lonsec drawing on their established research and portfolio construction expertise to provide recommended strategic asset allocations tailored to three risk/return profiles: Balanced, Growth and High Growth. Each model portfolio is split between growth and defensive assets across a range of ETFs that Lonsec considers provide an appropriate exposure to the relevant asset class.
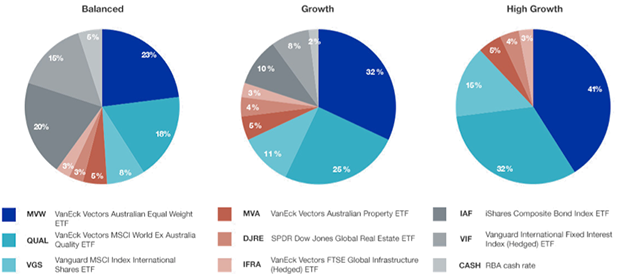
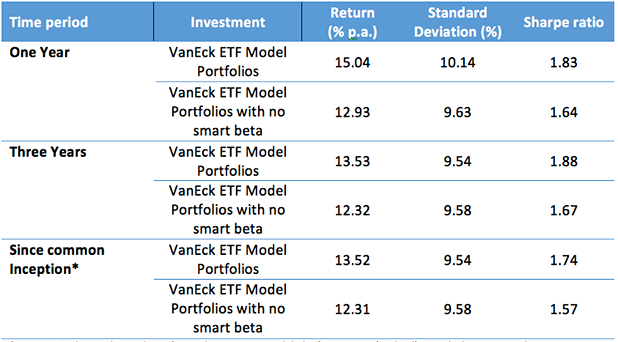
Tables 1, 2 and 3 show the returns of hypothetical portfolios based on VanEck ETF Model Portfolios. These include smart beta ETFs: MVW, QUAL and MVA compared to the returns if Lonsec had opted to use ETFs that track traditional benchmark indices to represent the returns of each asset class within the portfolio. In each instance the VanEck ETF Model Portfolios, with smart beta, outperforms the portfolios based only on traditional market cap weighted ETFs. This however comes with marginally higher standard deviation. Standard deviation is a common measure of the volatility of a portfolio.
The Sharpe ratio combines the return measure with a volatility measure to quantify the relationship between the returns and risk. It provides a measure of risk-adjusted performance. In each of the examples below, the portfolio with the smart beta has a higher Sharpe ratio. The results show using smart beta in a diversified portfolio delivers better returns without excessive risk.
Table 1. Balanced Portfolio (60% Growth / 40% Defensive assets)
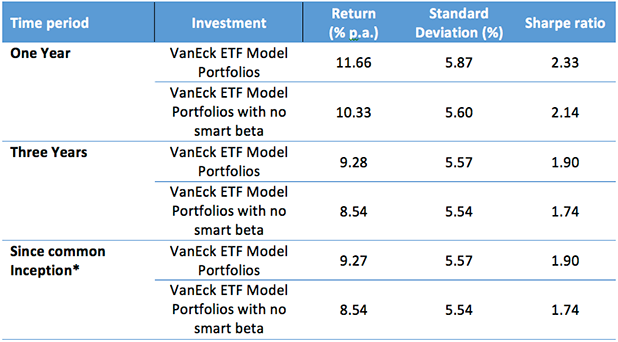
Table 2. Growth Portfolio (80% Growth /20% Defensive assets)
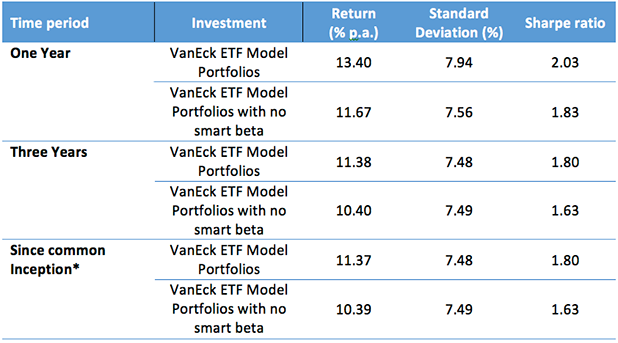
Table 3. High Growth Portfolio (100% Growth Assets)
*Inception is the ASX listing date of VanEck Vectors FTSE Global Infrastructure (Hedged) ETF which was 29 April 2016
Source: Morningstar Direct, Performance period ending 30 April 2019. Results are calculated daily to the last business day of the month and assume immediate reinvestment of all dividends. Results are net of management costs but do not include brokerage costs of investing in the ETFs. Performance on is not a reliable indicator of future performance. Assume rebalanced at the end of each calendar year.
The RBA cash rate is used for cash. ETFs used for VanEck ETF Model Portfolios with no smart beta: International Bonds – Vanguard International Fixed Interest Index ETF (Hedged), Australian Bonds – iShares Core Composite Bond ETF, International Equities – Vanguard MSCI Index International Shares ETF, Australian Equities – SPDR S&P/ASX 200 ETF, International Real Estate - SPDR Dow Jones Global Real Estate ETF, Global Infrastructure -VanEck Vectors FTSE Global Infrastructure (Hedged) ETF, Australian Property – Vanguard Australian Property ETF.
Putting in into practice: Disrupting active management
The above analysis assumes most investors achieve their exposure to different asset classes via passive index funds. In practice most investors will use active funds to gain some of these exposures.
The issue for active managers in Australia, however, has been that most have been underperforming the cap weighted benchmark over time. Every six months, S&P Dow Jones Indices release its SPIVA® Australia Scorecard (SPIVA is an acronym for Standard & Poor’s Indices Versus Active) and the most recent reported that over one, three, ten and 15 years, over 85% of Australian equity active funds were outperformed by the S&P/ASX 200. Over five years 79% of Australian equity funds were outperformed by the market cap weighted index.
This has been one of the reasons that passive investments such as ETFs have grown in popularity. Investors no longer want to pay high fees for poor performance. Morningstar recently highlighted this trend.
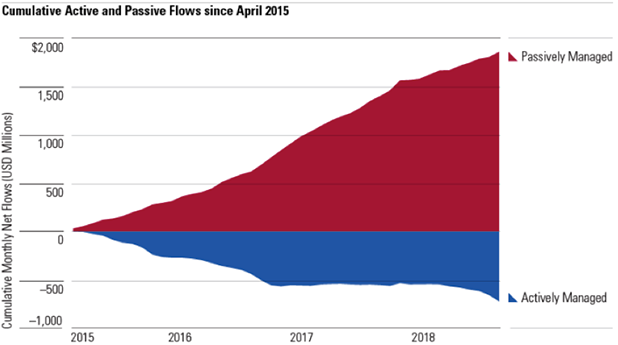
Source: Morningstar Direct. Data as of 31 March 2019
Smart beta is another threat to active managers. Smart beta has been identified as:
“a disruptive financial innovation with the potential to significantly affect the business of traditional active management. They provide an important component of active management via simple, transparent, rules-based portfolios delivered at lower fees.” (Kahn and Lemmon, 2016)
Savvy investors are flocking to smart beta, attracted by their targeted outcome, lower fees relative to active, ease of use and their ability to be a part of most diversified portfolios.
Issued by VanEck Investments Limited ABN 22 146 596 116 AFSL 416755 (‘VanEck’). VanEck is the responsible entity and issuer of units in the VanEck Vectors ETFs traded on ASX. This is general advice only about financial products and not personal financial advice. It does not take into account any person’s individual objectives, financial situation or needs. Before making an investment decision, you should read the relevant PDS and with the assistance of a financial adviser consider if it is appropriate for your circumstances. VanEck PDSs are available at www.vaneck.com.au or by calling 1300 68 38 37. PDSs of other issuers' ETFs are available from their websites. No member of VanEck group of companies gives any guarantee or assurance as to the repayment of capital, the payment of income, the performance, or any particular rate of return of any funds. Past performance is not a reliable indicator of future performance.
This information is provided by Lonsec Investment Solutions Pty Ltd ABN: 95 608 837 583, a Corporate Authorised Representative (CAR 1236821) (LIS) of Lonsec Research Pty Ltd ABN 11 151 658 561 AFSL421445 (Lonsec Research). LIS creates the model portfolios it distributes using the investment research provided by Lonsec Research but LIS has not had any involvement in the investment research process for Lonsec Research. LIS and Lonsec Research are owned by Lonsec Fiscal Holdings Pty Ltd ABN: 41 151 235 406. Please read the following before making any investment decision about any financial product mentioned in this document. Disclosure as at the date of publication: Lonsec Fiscal group companies receive fees and other benefits. Lonsec Research Pty Ltd ABN: 11 151 658 561 AFSL: 421445 receives fees from fund managers or product issuers for researching their financial product(s) using comprehensive and objective criteria. Lonsec Research receives subscriptions for providing research content to subscribers and fees for providing investment consulting advice to clients, which includes model portfolios, approved product lists and other advice. The fees are not linked to the financial product rating outcome or the inclusion of financial products in model portfolios, or in approved product lists. Warnings: Past performance is not a reliable indicator of future performance. Any express or implied rating or advice presented in this information is limited to “General Advice” (as defined in the Corporations Act 2001 (Cth)) and based solely on consideration of the investment merits of the financial product(s) alone, without taking into account the investment objectives, financial situation and particular needs (‘financial circumstances’) of any particular person. Before making an investment decision based on the rating(s) or advice, the reader must consider whether it is personally appropriate in light of his or her financial circumstances, or should seek independent financial advice on its appropriateness. If our advice relates to the acquisition or possible acquisition of particular financial product(s), the reader should obtain and consider the Investment Statement or Product Disclosure Statement for each financial product before making any decision about whether to acquire a financial product. Disclaimer: This information is for the exclusive use of the person to whom it is provided by Lonsec Research and must not be used or relied upon by any other person. No representation, warranty or undertaking is given or made in relation to the accuracy or completeness of the information, which is drawn from public information not verified by Lonsec Research. Financial conclusions, ratings and advice are reasonably held at the time of completion but subject to change without notice. Lonsec Research assumes no obligation to update this information following publication. Except for any liability which cannot be excluded, LIS and Lonsec Research, its directors, officers, employees and agents disclaim all liability for any error or inaccuracy in, misstatement or omission from, this information or any loss or damage suffered by the reader or any other person as a consequence of relying upon it.


Published: 23 May 2019