Goldilocks learns an investment lesson
We all know the story of Goldilocks and her experience at the Three Bears’ cottage. She complained when the chair was too big and she complained when it was too small. She complained when the porridge was too hot and she complained when the porridge was too cold. Then there was that incident with the bed. For Goldilocks, the middle is her ‘sweet spot’. While aiming straight down the middle has its advantages, investors sometimes need to be more nimble.
Goldilocks complained when the chair was too big and she complained when it was too small. She complained when the porridge was too hot and she complained when the porridge was too cold. Then there was that incident with the bed. For Goldilocks, the middle was her ‘sweet spot’. While aiming straight down the middle has its advantages, investors sometimes need to be more nimble.
How Goldilocks invested the royalties from selling her three bears encounter is the part of the fairy tale not often told. When Goldilocks buys shares in companies, she insists that the company not be too big and not be too small – the so-called ‘mid-caps’. The ‘mighty mid-caps’ are often referred to as the sweet spot in the investment universe because they combine the attractive attributes of large and small companies.
Some mid-caps can be former small-caps that have grown up. They balance spirit and safety. They have experienced management teams, established brands and client bases, infrastructure already built, and access to capital markets – advantages that small-cap companies may lack.
At the same time, they benefit from flatter management structures, entrepreneurial drive and quick decision-making so can adapt more quickly than their large-cap counterparts.
Mid-caps are not business giants with a huge market share that make it impossible to grow more than a few per cent. Mid-caps still have room to capture market share, offer new products, enter new markets, gain economies of scale or obtain intellectual property quickly. They also have a much greater potential of being taken over than large-caps have. In addition, analysts cover large-caps in such depth there are no hidden gems to find.
The S&P/ASX Index Series defines mid-caps to be the stocks ranking from 51 to 100 by market capitalisation. The following graph shows the mid-cap index outperforming other key indices over the long term.
Chart 1: How the S&P/ASX indices perform
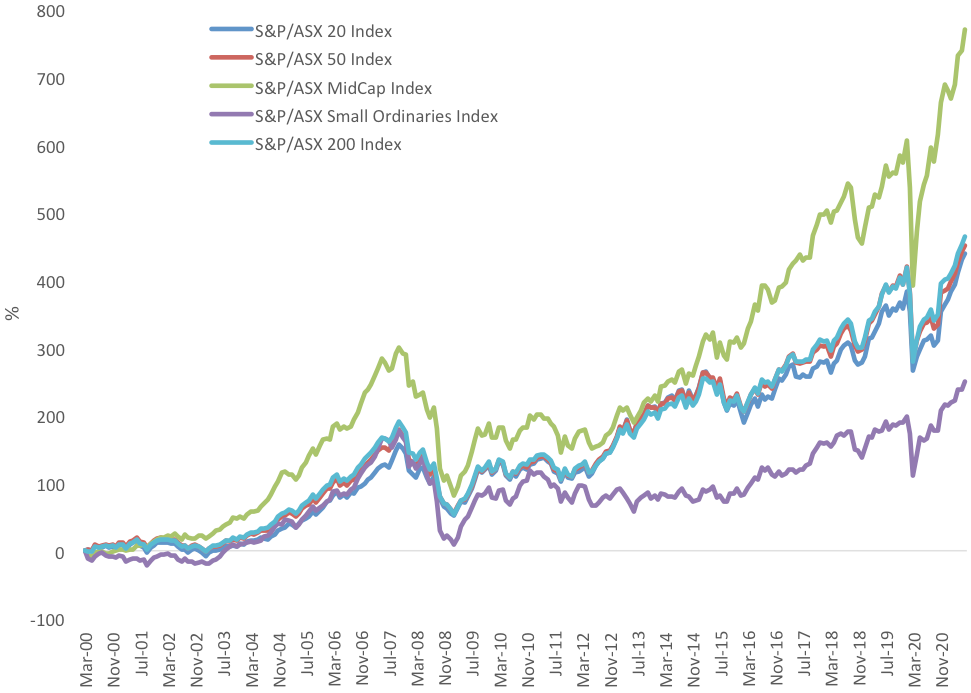
Source: Morningstar Direct, 31 March 2000 (commencement of S&P/ASX index series) to 30 June 2021. Results are calculated to the last business day of the month and assume immediate reinvestment of all dividends and exclude costs associated with investing in MVE. You cannot invest directly in an index. Past performance is not a reliable indicator of future performance of the MVE Index or MVE.
Below we present this data in a different way. The rolling returns show the performance results over each previous period. In other words, in chart 2 each dot point represents the return for the previous 12 months, in chart 3 each dot represents the returns of the previous 5 years.
Chart 2: 12 month rolling returns of the S&P/ASX indices
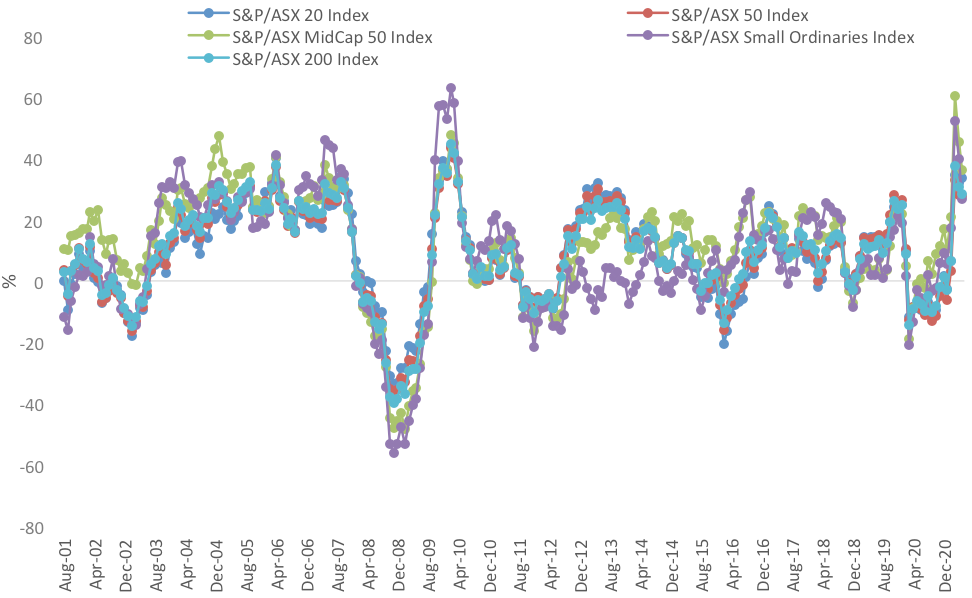
Source: Morningstar Direct, 31 March 2000 (commencement of S&P/ASX index series) to 30 June 2021. Results are calculated to the last business day of the month and assume immediate reinvestment of all dividends and exclude costs associated with investing in MVE. You cannot invest directly in an index. Past performance is not a reliable indicator of future performance of the MVE Index or MVE.
Chart 3: Five-year rolling returns of the S&P/ASX indices
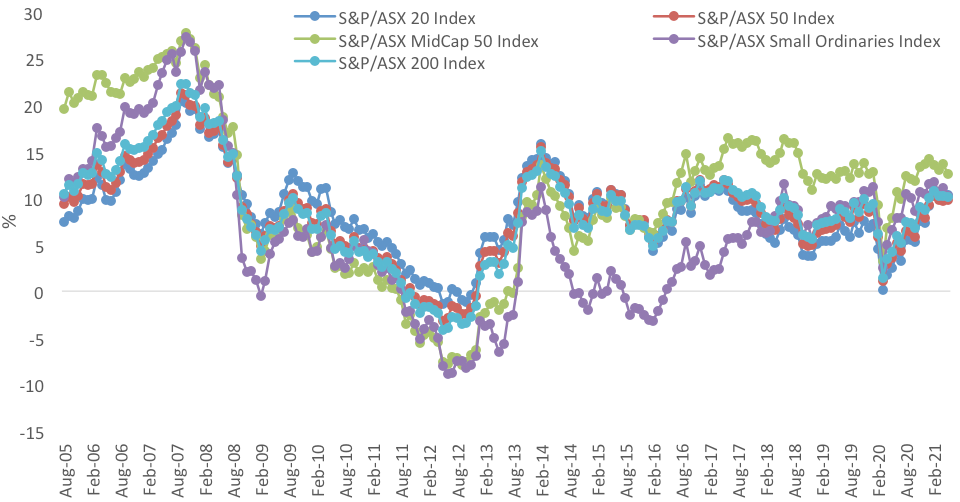
Source: Morningstar Direct, 31 March 2000 (commencement of S&P/ASX index series) to 30 June 2021. Results are calculated to the last business day of the month and assume immediate reinvestment of all dividends and exclude costs associated with investing in MVE. You cannot invest directly in an index. Past performance is not a reliable indicator of future performance of the MVE Index or MVE.
What is evident in both is that there are times when the mid-caps underperform the larger-caps. If we focus on chart 2, the last few months is a good case in point. In March this year, mid-caps were the best performing index for the previous 12 months. It was the second highest 12-month performance ever recorded by an S&P/ASX index. Fast forward three months and the mid-cap index is back in-line with the large-caps indices. Price fluctuations tend to be bigger in mid- and small-caps as the below table shows. Referring to the table below, the S&P MidCap 50 has the highest best month and best quarter, but the second lowest worst month and worst quarter.
Table 1: Returns and risk of S&P/ASX 200 indices since 2000
|
Return
(% p.a.) |
Std Dev
(%) |
Best Month
(%) |
Best Quarter
(%) |
Worst Month
(%) |
Worst Quarter
(%) |
|
|
S&P/ASX 20 Index
|
8.15
|
13.49
|
+10.31
|
+22.65
|
-19.24
|
-19.97
|
|
S&P/ASX 50 Index
|
8.15
|
13.18
|
+10.98
|
+21.27
|
-20.30
|
-22.33
|
|
S&P/ASX MidCap 50 Index
|
11.03
|
15.35
|
+16.12
|
+30.31
|
-22.72
|
-26.98
|
|
S&P/ASX Small Ordinaries Index
|
6.29
|
17.49
|
+14.27
|
+25.69
|
-24.81
|
-29.21
|
|
S&P/ASX 200 Index
|
8.35
|
13.34
|
+10.21
|
+21.50
|
-20.65
|
-23.10
|
Source: Morningstar Direct, 31 March 2000 (commencement of S&P/ASX index series) to 30 June 2021. Results are calculated to the last business day of the month and assume immediate reinvestment of all dividends and exclude costs associated with investing in MVE. You cannot invest directly in an index. Past performance is not a reliable indicator of future performance of the MVE Index or MVE.
Goldilocks, like any investor does not like to lose money, but recognises that timing the market, is impossible.
As with any investment strategy, diversification reduces the risk without, according to Modern Portfolio Theory, giving up too much of the return. Goldilocks is considering two ways to invest in Australian mid-caps. The first, the VanEck Vectors S&P/ASX MidCap ETF (MVE) gives Goldilocks one trade access to a portfolio that tracks the S&P/ASX Midcap 50 Index.
The other approach Goldilocks is considering is the VanEck Vectors Australian Equal Weight ETF (MVW). MVW invests in the most liquid ASX-listed companies across both large caps and mid-caps, with a greater exposure to mid-caps than you would get from a market capitalisation index approach like a fund that tracks the S&P/ASX 200. This is because MVW equally weights each constituent as opposed to a market capitalisation approach that weights each stock proportional to its size so the biggest companies make up a bigger proportion of the fund. MVW has more invested in mid-caps and less invested in Australia’s mega-caps.
Goldilocks can add mega-cap and high conviction ideas to both of these portfolios.
Goldilocks is learning that ETFs are useful trading tools for portfolio construction – a lesson almost as important as not stealing, not vandalising furniture and not falling asleep in your victim’s bed.


Published: 02 July 2021
VanEck Investments Limited ACN 146 596 116 AFSL 416755 (‘VanEck’) is the responsible entity and issuer of units in the VanEck Vectors Australian Equal Weight ETF (MVW) and VanEck Vectors S&P/ASX MidCap ETF (MVE). This is general advice only, not personal financial advice. It does not take into account any person’s individual objectives, financial situation or needs. Read the PDS and speak with a financial adviser to determine if either fund is appropriate for your circumstances. The PDS is available here. An investment in MVW and MVE carries risks associated with: financial markets generally, individual company management, industry sectors, stock and sector concentration, fund operations and tracking an index. See the PDS for details. No member of the VanEck group of companies guarantees the repayment of capital, the payment of income, performance, or any particular rate of return from any fund.
The S&P/ASX MidCap Index (the Index”) is a product of S&P Dow Jones Indices LLC or its affiliates (“SPDJI”) and ASX Limited (“ASX”) and licensed for use by VanEck. S&P® is a registered trademark of Standard & Poor’s Financial Services LLC (“S&P”); Dow Jones® is a registered trademark of Dow Jones Trademark Holdings LLC (“Dow Jones”); and these trademarks have been licensed for use by SPDJI and sublicensed by VanEck. The Fund is not sponsored, endorsed, sold or promoted by SPDJI, Dow Jones, S&P, their respective affiliates, or ASX and none of them makes any representation regarding the advisability of investing in the Fund. Such parties do not accept liability for any errors, omissions, or interruptions of the Index and do not give any assurance that the Fund will accurately track the performance of the index or provide positive investment returns. Inclusion of a security within the index or Fund is not a recommendation by any party to buy, sell, or hold such security.