Quality: You can’t fake it
While few investors dispute the validity of quality investing in equities, the definitions and descriptors used to define quality vary. The challenge for investors is to identify real quality stocks from the fakes.
John Ruskin was an English art critic in the Victorian era who once said, “Quality is never an accident; it is always the result of intelligent effort.” We think the same is true when constructing an international equities portfolio.
Less than a century after Ruskin was writing, Benjamin Graham, the founding father of value investing, was highlighting the importance of investing in high quality companies. A recurring theme of Graham’s The Intelligent Investor is that investors should demand from a company "a sufficiently strong financial position and the potential that its earnings will at least be maintained over the years."
These tenents, strong financial position and dependable earnings have been used to identify quality companies. Empirical research shows that quality companies have historically outperformed the market with relatively low volatility over long time periods (Smith 2010, Joyce and Mayer 2012). Going long on high quality stocks and shorting low quality stocks also produces better Sharp ratios or risk-adjusted returns than the market (Asness, Frazzini, and Pedersen 2013, Kozlov and Petajisto 2013).
According to the Fama-French model, all systematic risks are ultimately economic risks. Quality measures such as financial leverage and earnings growth are just different forms of economic risks. Campbell, Polk and Vuolteenaho (2003) concurred with this “fundamental” explanation, and showed that the primary source of systematic risks of both growth and value stocks is cash flow fundamentals.
In examining the profitability component of quality, Robert Novy-Marx (2012) found that profitable firms generate significantly higher returns than unprofitable firms, despite having significantly higher valuation ratios.
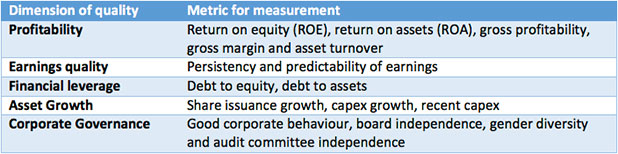
While so much has been written about the quality factor, after examining the academic research, MSCI found that that a company’s quality can be evaluated along five key dimensions: profitability, earnings quality, financial leverage, asset growth and corporate governance.
The table below summarises how these dimensions can be measured. Asset growth and corporate governance tend to be more difficult to quantify. Profitability, earnings quality and financial leverage are readily available in financial statements, and thus can be used to construct transparent, rules-based indices.
To demonstrate how these metrics perform, MSCI created 10 portfolios with decreasing exposure to ROE, debt to equity and earnings variability as well as a composite of the three descriptors. MSCI chose these as they were tangible and transparent and readily available in financial statements.
Individually, each of these descriptors achieved a positive return against MSCI World Index. However, combining all three descriptors provided superior performance to the standalone descriptors. From this, MSCI had the foundation for its Quality Index. Furthermore, Novy-Marx (2014) reported significant alpha from the combination of these metrics.
The MSCI World ex Australia Quality Index (MSCI Quality Index) only includes the highest quality scoring stocks determined by MSCI based on three easily identifiable financial characteristics:
- High ROE;
- Stable year-on-year earnings growth; and
- Low financial leverage.
The historical returns of the MSCI Quality Index are superior to the MSCI World Index over the long term.
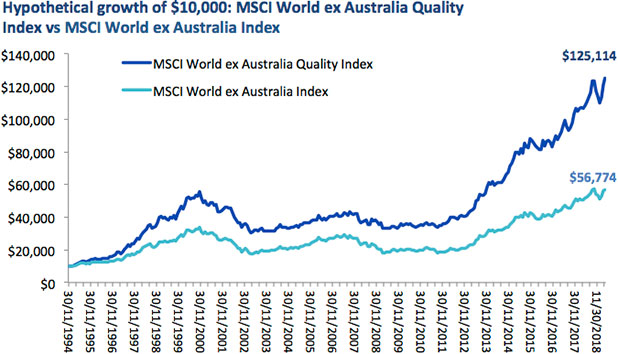
Source: Morningstar Direct, as at 31 March 2019.
The above graph is a hypothetical comparison of performance of a $10,000 investment in the Index and the parent index. Results are calculated to the last business day of the month and assume immediate reinvestment of all dividends and exclude costs associated with investing in the ETF. You cannot invest directly in the Index. The above performance information is not a reliable indicator of current or future performance of the indices or QUAL, which may be lower or higher.
Quality as a defence
MSCI compared its Quality Index to other factor indices and found that MSCI Quality traditionally has its strongest relative performance during volatile periods and periods of economic downturns due to its defensive characteristics. Quality has a large-cap bias and MSCI Quality also outperformed in periods identified as 'flight to quality'.
In the chart below, when the orange line is rising, quality is outperforming. In the five most recent periods of increased volatility, as represented by the CBOE Volatility Index (VIX), quality has outperformed the market benchmark.
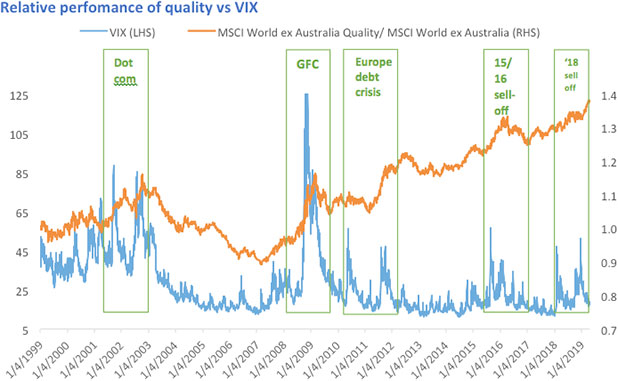
Source: MSCI Data/Calculations, Bloomberg, December 1998 to April 2019.
Chart shows performance of MSCI World Quality relative to MSCI World compared to VIX Index. Results include the reinvestment of all dividends, but exclude fees and other costs associated with an investment in QUAL. You cannot invest in an index. Past performance is not a reliable indicator of future performance of the index or QUAL.
Australian investors seeking the highest quality international companies identified by the world’s largest index provider, MSCI, can action this research through the VanEck Vectors MSCI World ex Australia Quality ETF (ASX code: QUAL).
QUAL tracks the MSCI World ex Australia Quality Index which means Australian investors can access a portfolio of 300 quality international companies in a single trade on the ASX.
QUAL has delivered outperformance since its inception
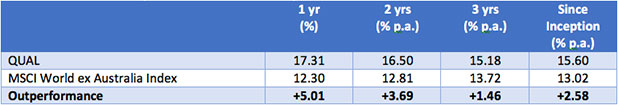
As at 31 March 2019
Inception date is 29 October 2014.
Source: Morningstar Direct. Results are calculated daily and assume immediate reinvestment of all dividends. QUAL results are net of management fees and other costs incurred in the fund but do not include brokerage costs or buy/sell spreads incurred when investing in QUAL. Past performance is not a reliable indicator of future performance.
Only QUAL tracks the MSCI World ex Australia Quality Index, an index supported by empirical research. QUAL is not an accident. It is the result of intelligent effort.
IMPORTANT NOTICE: This information is issued by VanEck Investments Limited ABN 22 146 596 116 AFSL 416755 (‘VanEck’) as responsible entity and issuer of the VanEck Vectors MSCI World ex Australia Quality ETF and VanEck Vectors MSCI World ex Australia Quality (Hedged) ETF. This is general information about financial products only and not personal financial advice. It does not take into account any person’s individual objectives, financial situation or needs. Before making an investment decision in relation to an ETF, you should read the PDS and with the assistance of a financial adviser consider if it is appropriate for your circumstances. The PDS is available at www.vaneck.com.au or by calling 1300 68 38 37. The funds are subject to investment risk, including possible loss of capital invested. Past performance is not a reliable indicator of future performance. No member of the VanEck group of companies gives any guarantee or assurance as to the repayment of capital, the payment of income, the performance, or any particular rate of return from any ETF.
QUAL and QHAL invest in international markets. An investment in QUAL or QHAL has specific and heightened risks that are in addition to the typical risks associated with investing in the Australian market. These include currency risks from foreign exchange fluctuations, ASX trading time differences and changes in foreign laws and regulations including taxation.
QUAL and QHAL are indexed to a MSCI index. is the ETFs are not sponsored, endorsed, or promoted by MSCI, and MSCI bears no liability with respect to QUAL or QHAL or the MSCI Index. The PDSs contain a more detailed description of the limited relationship MSCI has with VanEck and the ETFs.


Published: 25 April 2019