The too big Australian
Markets are in a constant flux and investors should be mindful how significant market composition changes affects their portfolios. Last week the Australian equities market experienced a paradigm shift as BHP amalgamated its UK and Australian listings into one on the ASX. Because of this unification, investors in an Australian equity fund that tracks or benchmarks to the S&P/ASX 200 or S&P/ASX 300 are now exposed to greater risk. Risk they may not even be aware.
However, there is a simple way to avoid this risk.
Last week BHP consolidated its corporate structure and stock trading to its primary listing on the ASX. Because of this, BHP’s composition within Australia’s market capitalisation S&P/ASX indices increased. On the day of the unification, there was unprecedented trading on the ASX. This is because passive managers, tracking the S&P/ASX 200 or S&P/ASX 300 have had to buy BHP to increase their holding to consider its new level, while selling others to make room. There is also no doubt that many active benchmark-hugging managers will continue to up-weight their holding in BHP if they have already not done so.
The reason your active manager may be buying BHP is that the way they construct their portfolios is to hold positions similar to the index, usually within a range. Otherwise, they are taking a big risk. If markets go against them and they drastically underperform the index, they will be seen as incompetent. Better to be just above or just below the index.
BHP now makes up over 11% of the S&P/ASX 200 increasing from just under 7% at the start of January. This is significant when you consider major global indices around the world. Australia is the most concentrated share market in the world. The top 10 stocks in the ASX 200 now makes up 47% of the index.
Chart 1: Concentration within global indices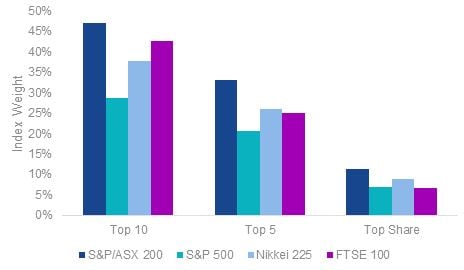
Source: Bloomberg, VanEck as at 31 January 2022
When you consider the sector composition of the S&P/ASX’s top 10, five companies are banks and two are materials. Investors buying a diversified Australian equity strategy would think it is unlikely one stock would be 10% of the portfolio, nor would they think two sectors represent over 50% of the portfolio, but that is what you will be getting from a portfolio linked to Australia’s largest 200 companies. This is a risk: Concentration risk.
Concentration makes sense if you have high conviction in these stocks and sectors, but for a core strategic allocation, it introduces unintended risk. Maybe your active manager likes BHP. The last time BHP was at its current level was in 2012, following the commodities ‘super-cycle’. While commodities are performing well at the moment due to their cyclical nature and inflation rearing its head, not many people are suggesting 2022 is going to be the start of a super cycle. Unless this is the case, such concentration is a risk for investors.
Chart 2: BHP’s weighting in S&P/ASX 200 index
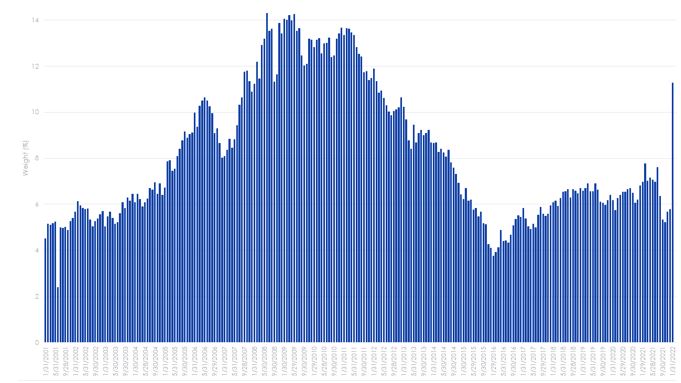
Source: Bloomberg, VanEck as at 31 January 2022
Managing Australian share market risk with alternative weighting
Rather than constructing an index or a portfolio considering a constituents’ size, like the S&P/ASX 200 or S&P/ASX 300, an alternative method is to equally weight the constituents. The MVIS Australia Equal Weight Index (MVW Index) includes only the largest and most liquid companies on ASX, currently 96 stocks, and equally weights them once a quarter at each rebalance.
Australian equity market – company weights
Because of the MVW Index’s equal weight construction methodology, at last rebalance no company was more than 1.04%. Therefore, the MVW Index has less stock concentration risk than the S&P/ASX 200. What this means is that if BHP or CBA goes down 2%, its impact on the S&P/ASX 200 is greater than in the MVW Index.
On the other side of the coin, there are 80 companies within the MVW Index which have a higher weighting compared to the S&P/ASX 200 and therefore have greater influence on it. As Chart 3 below shows MVW has a larger exposure than that of the market capitalisation weighted benchmark index for around 80% of its portfolio. The companies in which MVW is overweight may be former small and mid-caps that have grown large, or they may be large or mega caps that have fallen in size. Importantly these companies have much greater potential for growth or are more likely to be taken over than the largest handful of stocks on ASX.
Chart 3: S&P/ASX 200 and MVW Index company weightings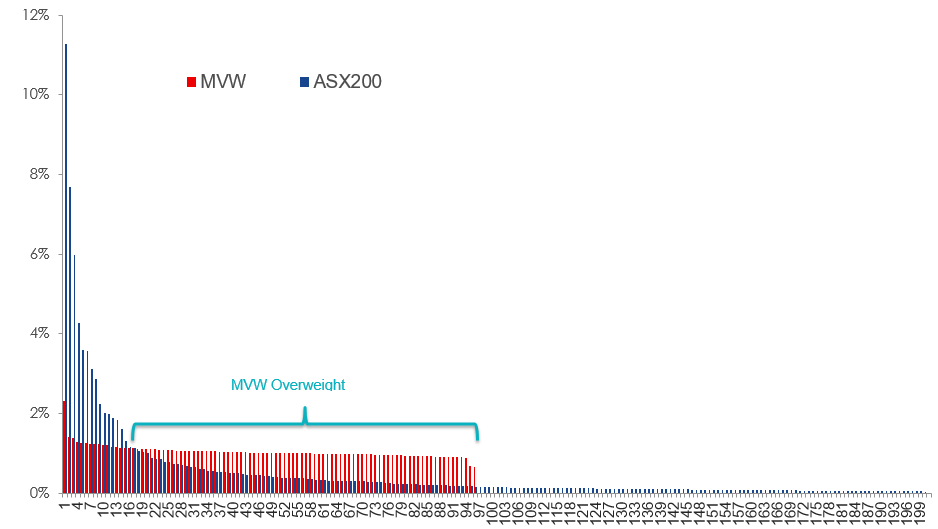
Source: Factset, 31 January 2022
Australian equity market – sector weights
Another consequence of MVW Index’s construction methodology, it will be underweight, relative to the S&P/ASX 200, sectors that contain larger than average companies. For example, the MVW Index is currently underweight the financials’ sector by 9.97% compared to the S&P/ASX 200. Conversely it will be overweight sectors that contain smaller than average companies. The MVW Index is currently overweight industrials by 6.62% and consumer discretionary by 3.56%. Therefore, the MVW Index has less sector concentration risk than the S&P/ASX 200.
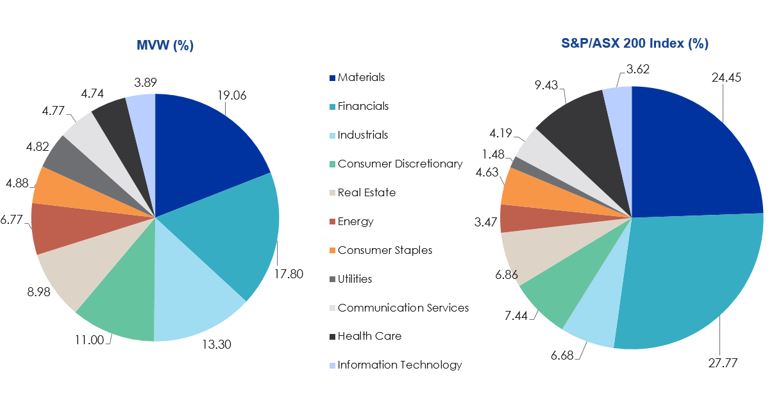
Source: Factset, 31 January 2022
What this means is that if there is another systematic banking issue, or commodities fall the impact on the S&P/ASX 200 is greater than in the MVW Index.
A mathematical investigation of diversification
Diversification is a cornerstone of modern portfolio theory. The principle being that when you diversify you improve your risk return trade off. There are two mathematical proofs that provide evidence that the MVW Index is better diversified than the S&P/ASX 200: the Herfindahl Index and some very complex calculus.
Economist Orris Clemens Herfindahl developed the Herfindahl Index and he first used his calculation to determine the concentration within the US steel industry. The concentration calculation has been used in fields beyond economics into fields such as engineering, aeronautics and biochemistry. As a measure, the higher the Herfindahl, the more concentrated. Therefore, a lower Herfindahl index signifies less concentration and greater diversification. The Herfindahl for S&P/ASX 200 is 264. For MVW it is 105. By this measure, the MVW Index is over 2 times more diversified than the S&P/ASX 200.
Further, in 2014 Hamich and Brown provided mathematical proof “that equal weight is the portfolio construction approach that gives the best diversification for the long term. Not just better than market capitalisation, but the best possible diversification among any portfolio construction strategy.” The maths involved is complex and included in Appendix 2 - here. Alternatively, the Australian Financial Review summarised these findings without the jargon - here.
The recent changes in the Australian equities market further strengthens the case for equal weight with the Australian equity market. The VanEck Australian Equal Weight ETF (MVW) tracks the MVW Index and is underweight mega-caps, financials and materials relative to portfolios that track or are benchmarked to the S&P/ASX 200 or S&P/ASX 300.
Key risks
An investment in the ETF carries risks associated with: financial markets generally, individual company management, industry sectors, fund operations and tracking an index. See the PDS for details.


Published: 04 February 2022
VanEck Investments Limited (ACN 146 596 116 AFSL 416755) (‘VanEck’) is the issuer and responsible entity of all VanEck exchange trades funds (Funds) listed on the ASX. This is general advice only and does not take into account any person’s financial objectives, situation or needs. The product disclosure statement (PDS) and the target market determination (TMD) for all Funds are available at vaneck.com.au. You should consider whether or not an investment in any Fund is appropriate for you. Investments in a Fund involve risks associated with financial markets. These risks vary depending on a Fund’s investment objective. Refer to the applicable PDS and TMD for more details on risks. Investment returns and capital are not guaranteed.
MVIS Australia Equal Weight Index (‘MVIS Index’) is the exclusive property of MV Index Solutions GmbH based in Frankfurt, Germany (‘MVIS’). MVIS is a related entity of VanEck. MVIS makes no representation regarding the advisability of investing in the Fund. MVIS has contracted with Solactive AG to maintain and calculate the MVIS Index. Solactive uses its best efforts to ensure that the MVIS Index is calculated correctly. Irrespective of its obligations towards MVIS, Solactive has no obligation to point out errors in the MVIS Index to third parties.