Nothing clears up volatility like VIX
For some investors volatility is something to be feared. Some thrive through it while others deteriorate. There are many solutions fund managers use in response to volatility and it is easy to get congested with information overload. There is a way to clear up misconceptions about the links between long term performance and volatility: VIX.
Active managers often claim to prosper in volatile markets, the rationale being that up-and-down markets create mispricing opportunities that active managers can exploit.
VIX is a real time volatility index, it is also known as the ‘fear index’. It is calculated so that investors, financial media, researchers and economists can assess investor sentiment and expected levels of market volatility. When used together with fund manager performance we can test the claims of active managers. S&P Dow Jones Indices present active fund manager performance compared to relevant benchmark indices in its SPIVA scorecard.
Last week S&PDJI released the SPIVA Australia 2016 Full Year results and the reading was bleak for investors paying high fees in Australian actively managed funds. In all categories most active managers underperformed their respective benchmarks. This result is repeated over three, five and ten year periods with the only one exception. It's been a bleak picture for active managers for some time.
Table 1. Percentage of Funds outperformed by the index
Source: S&P Dow Jones 2016 Full Year SPIVA scorecard. Data as of Dec. 31, 2016. Past performance is no guarantee of future results.
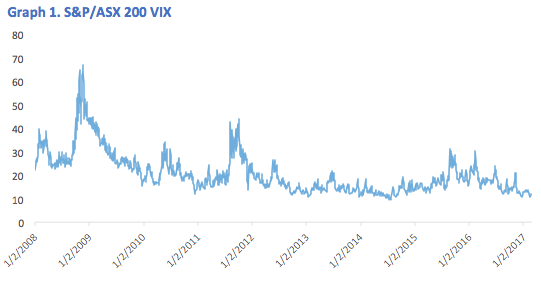
Now if we look at the S&P/ASX 200 VIX in Graph 1 below we can see VIX peaked during the height of the GFC. Over the past three years VIX has peaked twice returning to levels not seen since the European debt crisis in 2011/12. You might have expected that during this extended period of volatility active managers would have outperformed, but the SPIVA scorecard above illustrates this was not the case.

Source: S&P Dow Jones. Since first value date (2 January 2008) to 28 February 2017. Past performance is no guarantee of future results.
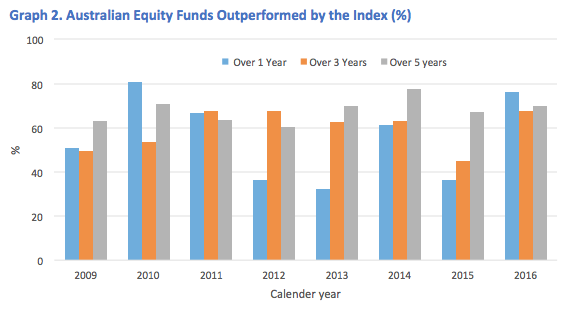
S&PDJI have been producing the SPIVA scorecard since 2009 so we can’t go back further than that year to test the claims of active managers. However the last eight years have been volatile and the results of each of the Full Year SPIVA scorecards are presented in Graph 2 below.

Source: VanEck, S&P Dow Jones 2016 Full Year SPIVA scorecard. Data as of Dec. 31, 2016. Past performance is no guarantee of future results.
The outcomes for one year periods are not clear. In 2009, the immediate aftermath of the GFC, most managers underperformed, worsening in 2010. However, during the volatility of the European debt crisis in 2011 and 2012 active managers did relatively better with less than 40% being outperformed by the market. Most Australian investors however invest for periods longer than 12 months. Over five years more than 60% of active funds are being outperformed by the index in each survey even though these periods all included volatility opportunities.
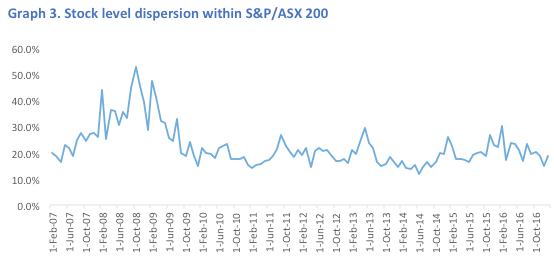
Active managers also argue that dispersion of the returns of the stocks within an index create opportunities for them to outperform. The below shows the stock level dispersion within the ASX over the past 10 years. It is immediately evident that this graph is a similar shape to the VIX graph above and dispersion is just another way of looking at volatility. The dispersion argument is therefore another version of the volatility argument that, for long term investors, we dispel above.

Source: VanEck, S&P Dow Jones. 1 Jan 2008 to 31 January 2017 at each month end. Past performance is no guarantee of future results.
Savvy investors are turning to passive
Since the GFC low cost passive funds have been on the rise as investors, using tools like SPIVA, assess their active manager's performance. The increased interest in passive management is not unique to Australia. Rainmaker estimates that around 18 per cent of funds under management in Australia is passively managed. In the US it is estimated to be as high as 40% and it continues to grow. According to Morningstar, since 2009 active funds in the US have suffered US$340 billion in outflows. Conversely passive funds have experienced US$505 billion in inflows.
There are some great active managers out there but they are becoming harder and harder to find. According to Warren Buffett, in his most recent letter to shareholders, “both large and small investors should stick with low-cost index funds.” ETFs are the simplest way to access low-cost index funds and ride out the VIX.
IMPORTANT NOTICE: Issued by VanEck Investments Limited ABN 22 146 596 116 AFSL 416755 ('VanEck'). This is general information only and not financial advice. It does not take into account any person's individual objectives, financial situation or needs. Before making an investment decision, you should read the relevant PDS and with the assistance of a financial adviser consider if it is appropriate for your circumstances. PDSs are available at www.vaneck.com.au or by calling 1300 68 38 37.
No member of VanEck group of companies gives any guarantee or assurance as to the repayment of capital, the payment of income, the performance, or any particular rate of return of any VanEck funds. Past performance is not a reliable indicator of future performance.
Published: 09 August 2018


