Skew returns in your favour
It's simple maths.
Skew has been getting some coverage recently in the financial press and it is now widely accepted that the distribution of the returns of individual stocks in the market are not distributed normally. Rather they are skewed. The degree of skew is measured by a value called 'skewness'.
Skewness is a statistical measure used to reflect the degree of asymmetry of a distribution. You may recall a normal distribution curve looks like this:
Figure 1: A normal distribution curve
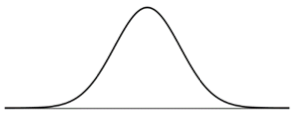
In a normal distribution curve the median, the mean and the mode (the highest point of the curve) are all equal. Statistically, a normal distribution curve would have a skewness of 0.
We were all taught to assume that real world variables are normally distributed. Investment theory enthusiastically adopted this but in real life the returns of stocks are not normally distributed. Instead they skew, with a long tail to the right like figure 2 below. For the mathematically inclined, figure 2 has positive skewness. A negative skew has a long tail to the left.
Figure 2: Skewed with long tail to the right
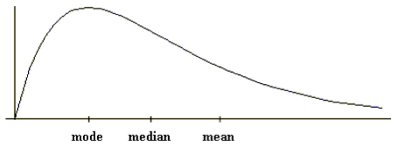
A feature of a positive skew is that the mean is higher than the median, which is higher than the mode.
Below is the actual data the 200 largest companies on ASX at 12 May 2015 and the return each generated over the following three years. These returns look more like figure 2 above, not figure 1. The average (mean) in this data set is 34%, well above the median of 21% which itself is well above the peak of the histogram (the mode) at 10%. The returns of stocks on the ASX have positive skewness.
Figure 3: Returns for the 200 Largest Australian Stocks Three Years to May 2018
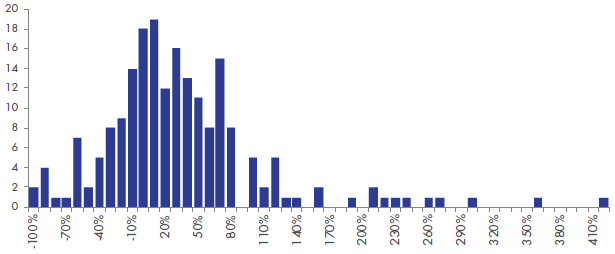
Source Bloomberg, VanEck
For the curious, the two bottom performers in figure 3 were Arrium and Slater & Gordon. The two top performers were BlueScope Steel and Regis Resources. A steelmaker at each end.
The chart also reveals:
- The lower returning groups are bunched together on the left hand side. One of the reasons for this is that stocks cannot lose more than 100%, while the upside potential is unlimited.
- The peak is way to the left. Many stocks have relatively low returns.
- The tail to the right is very long. A small number of stocks have a very high return. An investor would like more exposure to these stocks.
Smaller versus larger stocks
A further analysis of the data shows that mega-sized stocks are not likely to be at the extremes of the positively skewed distribution. Figure 4 below plots the returns against the market capitalisation of each stock at the beginning of the period.
Figure 4: Returns for the 200 Largest Australian Stocks Three Years to May 2018
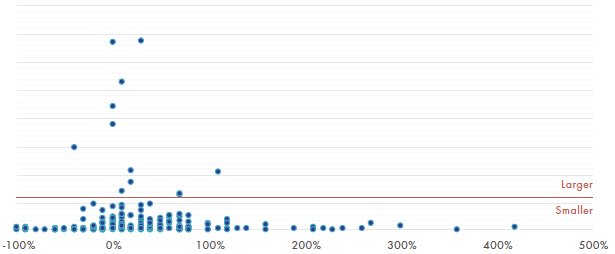
Source: Bloomberg, VanEck
Figure 4 shows that the companies that were the largest at the beginning of the period produced returns that are far more narrowly distributed than the rest of the stocks. The extremes are populated by smaller stocks than these mega-sized companies.
The twelve mega-cap stocks have a performance range of -36% (Telstra) to 107% (CSL) compared to the complete range of -100% to 416%.
Skewing returns in your favour
The return on any equity portfolio, passive or active, is made up by most of the stocks having a small or a negative return and just a small number of stocks having a high return. The greater weighting to higher-returning stocks, the higher the overall return.
Because of skew, portfolios based on the S&P/ASX 200 Accumulation Index (S&P/ASX 200), which allocate more to mega-caps, are hoping that the high-returning stocks are within the dozen or so stocks to which those portfolios have a reasonable exposure. As illustrated above these stocks are not in the long tail to the right.
An evenly spread portfolio like VanEck Vectors Australian Equal Weight ETF (MVW) is fishing with a much bigger net. There are currently 85 different stocks where the weighting is high enough that a rocketing share price won't be lost as a rounding error.
A fund benchmarked to the S&P/ASX 200 can only have significant holdings in the biggest stocks of which there are only around a dozen. MVW has ~70 extra significant holdings, all smaller than the mega-caps in the S&P/ASX 200 and all 70 of them have a chance of being the star performer.
Figure 5: MVW vs S&P/ASX 200 Index Constituent Rank and Weightings
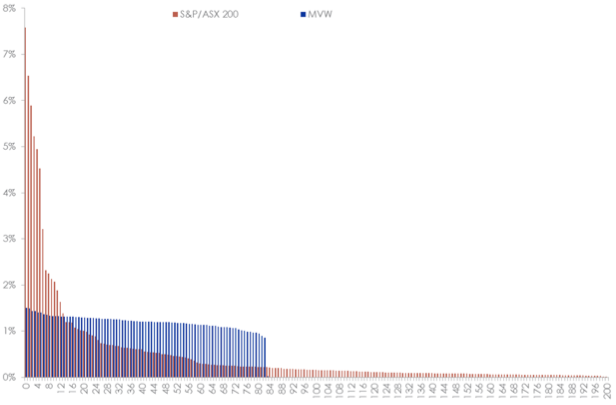
Source: Factset, as at 31 May 2018
No-one knows which stock's share price will be the next 300% to 400% performer but it is better to hold the additional 70 raffle tickets.
The effect of this can be seen in the historic performance of MVW against the S&P/ASX 200 Index.
Figure 6: Cumulative returns: MVW vs S&P/ASX 200 Index since MVW inception to 31 May 2018.
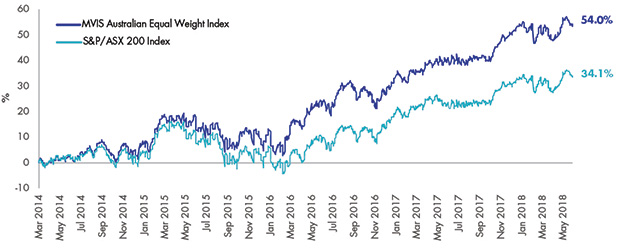
Source: Morningstar Direct. Inception date is 4 March 2014. Results are calculated to the last business day of the month and assume immediate reinvestment of distributions. MVW results are net of management costs and expenses, but before brokerage fees or bid/ask spreads incurred when investors buy/sell on the ASX. Past performance is not a reliable indicator of future performance.
The market is skewed in equal weight's favour. A more thorough examination of skew is available here.
IMPORTANT NOTICE:
This commentary is not intended as a recommendation to buy or sell any of the named securities.
This information is issued by VanEck Investments Limited ABN 22 146 596 116 AFSL 416755 ('VanEck') as responsible entity of the VanEck Vectors Australian Equal Weight ETF (MVW) ('Fund'). This is general information only and not financial advice. It is intended for use by financial services professionals only. It does not take into account any person's individual objectives, financial situation nor needs. Before making an investment decision in relation to the Fund, you should read the PDS and with the assistance of a financial adviser and consider if it is appropriate for your circumstances. The PDS is available at www.vaneck.com.au or by calling 1300 68 38 37. The Fund is subject to investment risk, including possible loss of capital invested. Past performance is not a reliable indicator of future performance. No member of the VanEck group of companies gives any guarantee or assurance as to the repayment of capital, the payment of income, the performance or any particular rate of return from the Fund.


Published: 09 August 2018